text in
  English (pdf)
 Article in xml format
 Article references
 Send this article by e-mail
 Cited by SciELO
  Cited by Google
  Similars in
SciELO
Similars in
SciELO  Similars in Google
 Permalink
INTRODUCTION
The ocean and the sea ice around Antarctica are the major mediators of the exchange of heat and momentum with the atmosphere. The variation of the exchange is largely determined by the interaction between these components in the marginal sea-ice zone, which has varying effects in different areas around Antarctica. How sea ice responds to atmospheric and oceanic changes is largely related to the physical properties of each component. The ocean properties change according to the intensity of different processes and structures such as internal waves, tides, turbulence, and diapycnal mixing, among others. These processes also affect the rate of melting and calving of ice shelves. A better characterization of these processes is key to understanding the global-scale circulation and the transport of heat, nutrients, and other climatically and ecologically important tracers.
A particular emphasis for oceanography is to understand processes such as turbulent mixing at the fine scale, and submesoscale (10-3 - 103 m) below the wind-mixed layer. This scale-range spans the transition from simple wave-wave propagation along water masses boundaries to turbulent mixing in which heat and salinity among others are vertically exchanged (Sheen et al., 2013). Several studies have highlighted the significance of turbulent mixing by the currents around the Antarctic Peninsula (i.e. Venables et al., 2014), but the impact of mixing in interior areas such as the bays in the Gerlache Strait (GS) remains understudied. Therefore, we located our oceanographic stations in the unique but difficult to access bays in the GS to obtain detailed information about the energy dissipation produced by the intrusion of non-resident water, as well as its properties and dynamics to understand how it impacts the local environment. As far as we know, there is currently a gap in data related to mixing in this area.
Here we present high-resolution turbulence microstructure data collected during the Fifth Antarctic Colombian Expedition 2018-2019, on board the ARC 20 de Julio. The dataset was collected by a free-falling Vertical Measuring Profiler (VMP) from Rockland Scientific, across three bays in the GS to map the intensity of the turbulent mixing in the area. This work aims to characterize the ocean dynamics in the GS at the smallest scales, in particular, to qualify and quantify the diapycnal mixing and its spatial variability. Diapycnal mixing is a relevant process because it controls vertical fluxes of biological and physical properties (Masson, 2002).
The manuscript is structured as follows: In Section 2 we present the study area and describe the ocean dynamics in the GS. The data and methodology are described in Section 3, where we detail the acquisition system and the methods applied to estimate the diapycnal diffusivity from the VMP. The water column properties and mixing levels are described in Section 4, and a discussion on how the entrance of Antarctic waters from the South influences the stability of the bays is presented in Section 5. Finally, Section 6 summarizes the main conclusions of this work, including how the entrance of Circumpolar Deep Water enhances the turbulence at the Flandes Bay and creates a well-mixing layer as it moves to the north to Charlotte Bay.
STUDY AREA
The Gerlache Strait (GS) is located in northernmost Antarctica, where it separates the Palmer Archipelago from the Antarctic Peninsula (Figure 1). It is around ~150 km long and ~10 km wide, with ~600 m average depth, and contains three main interior bays: Flandes, Andvord, and Charlotte (south to north respectively). It is an area characterized by a mainly south-to-north circulation of Antarctic Surface Water (AASW) and Upper Circumpolar Deep Water (UCDW) over the upper 400 m (Savidge and Amft, 2009). The AASW is a cold and fresh water mass affected by continental meltwater discharge, seasonal sea-ice melting, and atmospheric effects, which can control surface heat flux and sea-ice formation (Valkonen et al., 2008). During summer warming, the AASW can occupy the upper 100 m of the water column, where it can impact the melting and retreat rate of the surrounding glaciers (Cook et al., 2014). Below ~100 m, the warm and salty UCDW floods into the GS. From the north, there is a subsurface entrance of a core of Weddell Sea Deep Waters (WSDW) (Smith et. al., 1999). The WSDW is colder and saltier than UCDW; each water mass has a characteristic water signature. The entrance of these waters influences the ice stage inside the GS, a region where the coastal zone has been suffering rapid and strong change over recent decades (Lencina-Ávila et al., 2018).
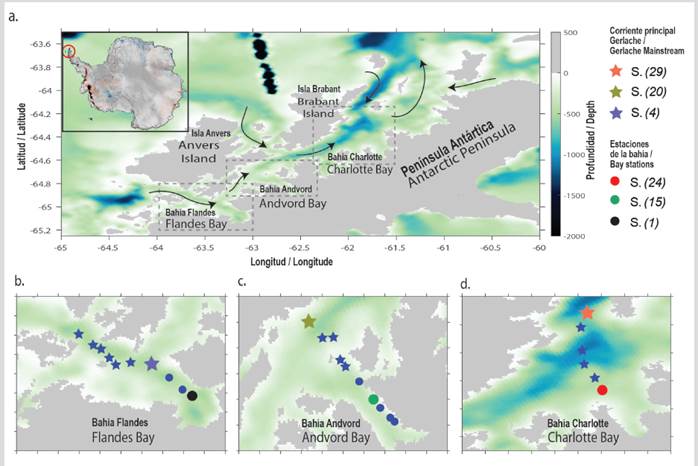
Figure 1 a. Gerlache Strait map. (Inlet) location at the northern tip of Antarctica. (Black arrows) Main ocean circulation pattern down to 400 m depth, based on Savidge and Amft (2009). (Segmented squares) Gerlache main bays location, b. Flandes Bay, c. Andvord Bay, and d. Charlotte Bay. (Stars) indicate the location of the VMP ocean station in the Gerlache mainstream. (Dots) location of VMP ocean stations at the interior of the bays. The color legend identifies the location, and the VMP station number selected to represent the different diagrams in the manuscript.
METHODOLOGY
Microstructure profiler
The dataset presented for this work was acquired onboard the Colombian Navy ship ARC 20 de Julio and its defender-class boat, from December 27, 2018, to January 4, 2019, during the Fifth Antarctic Colombian Expedition 2018-2019. A Vertical Microstructure Profiler (VMP) 250 (Figure. 2a) was used to characterize the microstructure of the water column. The VMP-250 has five sensors: two shear probes, one thermistor, one micro-conductivity, and one for pressure (Figure. 2b). The equipment comes with factory calibration. The VMP-250 is high-resolution equipment with a sampling rate of 512 Hz, that can record the micro-structure of the water column at the scale of centimeters during free-fall deployment. To obtain accurate shear measurements, the profiler requires a smooth and free descent to minimize contamination by the vibration of the measured shear signals. A motion decoupling winch PID-2 (Figure. 2a) was used to maintain a free-fall deployment by providing a slack of rope to ensure that the instrument is falling as freely as possible. The average fall speed under these conditions was ~0.85 m s-1. The real-time seafloor depth was recorded by the multibeam and sonar on board the boat. The winch rope was marked every 10 meters, reaching a maximum rope length of 400 m. In addition, a measuring pulley was used during the Charlotte Bay stations to control the amount of rope deployed.
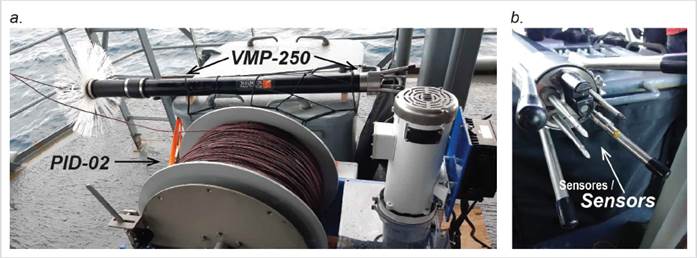
Figure 2 a. Equipment used during the oceanographic stations, a VMP- 250, and the PID-02 winch. b. close up of the sensors (temperature, conductivity, shear, pressure) used during the expedition.
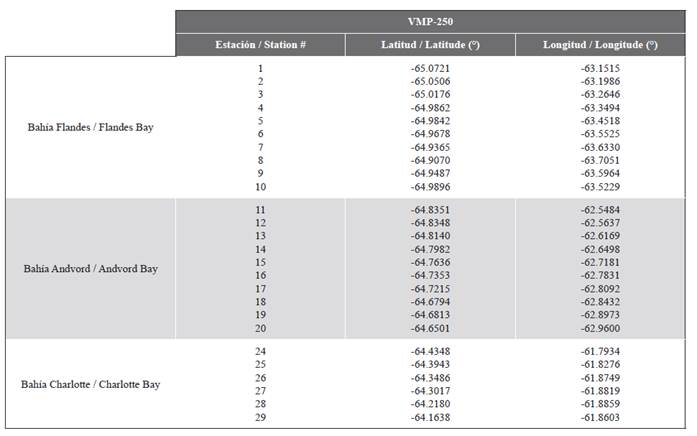
To study the microstructure of the GS, three cross-sections were occupied along its length from the main water entrance in the southwest to the exit at the northeast. Each section starts from the Gerlache mainstream (i.e. main Gerlache depth channel) and traverses to the interior of each bay. The first section ends inside the Flandes Bay, the second inside the Andvord Bay, and the third at the entrance to Charlotte Bay (Figure 1). All three sections exhibit smooth changes in topography. Precise locations of the stations are given in Table 1 (supplementary material).
We monitored 26 VMP stations in total, with an average separation of 2 km for each section bay, to record the variability from the ice shelf edge to the mean stream of the GS. The ARC 20 de Julio, which is not an icebreaker, was used to record the Charlotte stations; just 6 of 10 proposed stations on the Charlotte Bay were recorded because of a heavy sea-ice condition. A defender-class boat was used for the deployments in the other bays (Andvord and Flandes) to reach areas with almost full sea-ice cover. All three sections were performed with high synopticity (~ 5 hours per section).
MotoCross and RSILink software, provided by Rockland Scientific, was used to access the dataset that was recorded in the internal computer memory (persistor) of the VMP. Processing was performed using Matlab 2018B. We converted the dataset to physical units after correlating with the profiling speed (to be sure about the free fall), then we deleted spikes and bad flags by applying a low pass filter at 1 Hz to identify vibrations detected by the internal accelerometers. Only data recorded during free fall were used for the analysis, to ensure stability of the vertical velocity, as in this case there was no perturbation of the water column due to the equipment. Shearing values were recorded individually by two different sensors to identify possible malfunction or noisy data. The mean of the dissipation rates was estimated from the two probes.
Diapycnal diffusivity
The turbulent energy dissipation rate (ε) is related to the transfer of kinetic energy from large to small scales in terms of flow velocity fluctuations (Kolmogorov, 1941). Assuming isotropy as a condition, the GS can create eddies at different sizes that are limited by the flow stratification. Shear instability is a common energy transfer mechanism from stability to turbulence and can be quantified as a production rate by the Reynolds theory:
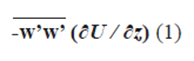
where (-u’w’) is the Reynolds stress and ( ∂U / ∂z ) is the mean shear. The eddy interactions produce a cascade of energy from smaller scales down to molecular scales where the energy is transferred from mechanical to caloric at the order of the kinematic molecular viscosity (ν) following:
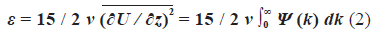
where ( Ψ ) is the spectrum of the shear (Nasmyth, 1970). Following Oakey (1982), we calculated the Nasmyth empirical spectrum. The energy spectrum was calculated via the Fast Fourier Transform (FFT) to identify the signature of the process that drives the water column dynamics. We choose an FFT length of 0.1 m to resolve the lowest wavenumber of the processes that can be developed in the area. Once this is known, we proceed to estimate the vertical mixing through the diapycnal diffusivity ( k p ), which influences the strength and pattern of the ocean circulation and determines the heat and salt heterogeneity at different spatial scales (Steward, 2008). The relationship to quantify k p was proposed by Osborn (1980):
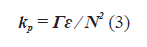
where Γ = 0.2 is the empirically mixing efficiency defined by Osborn and Cox, (1972), and N is the buoyancy frequency. An oceanic global average for vertical mixing estimates values of k p ≈ 10-4m2s-1, and the average pelagic diffusivity is given by k p ≈ 10-5m2s-1 (Thorpe, 2005). Following this methodology, we can produce a 2D map in terms of mixing that describes the general microstructure dynamics in the GS.
Among the processes that provide energy to ocean circulation in the GS, we can count rolling icebergs, breaking internal waves, convection, and intrusions (Arneborg et al., 2004). As an initial approach to identify which of these might be responsible for the measured mixing levels, we calculate the Turner angle (McDougall et al., 1988).

Where β is the salinity contraction coefficient, α is the thermal expansion coefficient, θ is the potential temperature, S is the salinity, and z is defined positive upwards. Angle values of -45° ≤ T U ≤ 45° indicate stable ocean conditions, while 45° ≤ T U ≤ 90° indicates that the stability is decreasing by salt, a condition in which salt fingering processes may develop.
RESULTS
Hydrographic context
There is a clear change in the water mass properties of the upper 400 m of the water column from the southern entrance of the GS (next to Anvers Island over 63.68°W) to the northern exit (Liege Island over 61.63°W). The AASW is identified at a maximum depth of ~100 m. The shallow water warms as it circulates to the north, where a maximum surface temperature of 2.6 °C, was recorded compared to a maximum of 1.2 °C in the south. There is a seasonal thermocline at around 80 m depth that works as a boundary layer between the shallow and intermediate waters. In general, there is a similar salinity range at all three sections in the top 400 m of the water column. A minimum value of 33.4 psu was recorded at the surface waters in the Flandes section, possibly due to fresh waters from melting ice coming from southern regions. An interface layer separates the AASW and the UCDW, and this can be seen clearly in the temperature and density variations, produced by the internal dynamics caused by the mixing of the different water masses entering the GS (Figure 3). The Flandes Bay section stands out because its small temperature variability over the upper 400 m of the water column (range 1.2 - 0.3 °C) indicates that UCDW has higher temperatures than those recorded at shallower depths. UCDW is characterized by a core of warm water around ~150 m depth, where it reaches a temperature of 1.0 °C and salinity of 34.4 psu. These properties are typical in regions where precipitation dominates over evaporation and is termed diffusive layering (Kelley et al., 2003). This diffusive layering configuration changes at the Andvord section, where mixing of UCDW and WSDW can be identified, impacting layers below 100 m, with a higher salinity value of 34.5 psu compared to the Flandes section. The deeper water here is colder and denser than Flandes Bay. The Charlotte section has the largest temperature range (2.8 to -0.7 °C). Here the shallow AASW is warmer and the deepest water is colder with a clear signature of WSDW that influences the dynamics in the area. The density changes are principally driven by the temperature rather than salinity.
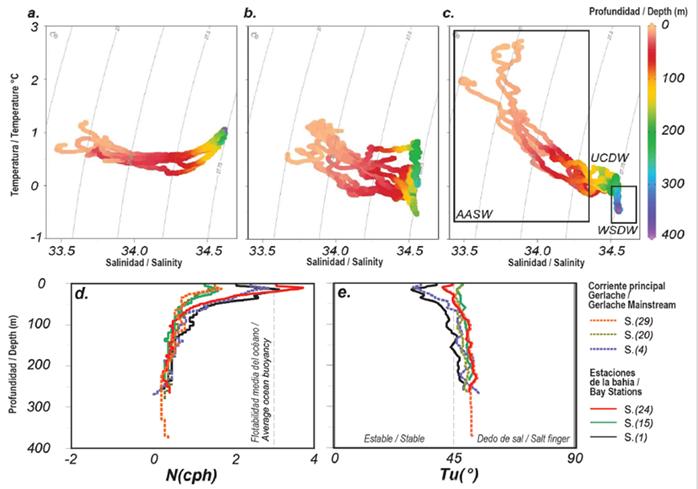
Figure 3 T-S diagram a. Flandes, b. Andvord, and c. Charlotte Bay respectively, from the full VMP data profiles. d. buoyancy frequency, and e. Turner angle for six representative stations, three located over the Gerlache mainstream, and three inside the study bays. In c. we located boxes with the location of the main water masses.
The buoyancy frequency identifies the area as weakly stratified, with sporadic shallow stratified water (~100 m) at the Flandes section and next to each bay entrance where the local waters reside (except for Andvord bay). The N mean is 0.42 cph, while the average ocean buoyancy is ~3 cph (Figure 3d). Low stratification indicates a system prone to intrusions that can produce well-mixed water. Most of the profiles were characterized by Turner angle values of 40° ≤ T U ≤ 55°, implying the potential presence of salt fingering. At the Flandes section, strongly-stratified shallow water (< 100 m) is the only water that is not prone to develop salt fingering, a product of the cold water mainly produced by melting. The entrance of warmer shallow water from the North decrees the stability. The water transition is clear and almost constant in the Charlotte Bay (Figure 3C). From here we can identify the relevance of the bathymetry and the location (North-South) of the water stability.
Mixing measurements
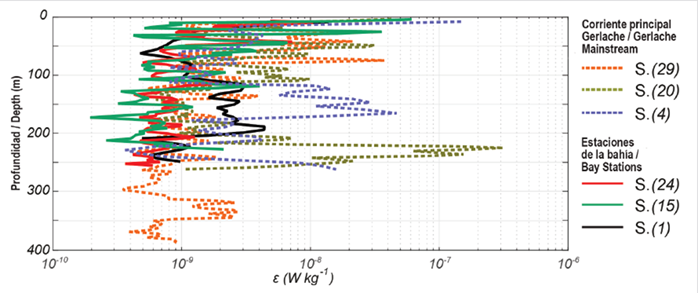
The high resolution of the shear sensors installed in the VMP-250 allowed us to calculate the Nasmyth empirical spectrum at the GS (Figure 4). High energy concentrations are evident over the stations located in the Gerlache mainstream, where most of the UCDW and the WSDW circulate. The triangles in Figure 4 identify the maximum wavenumber for estimating the dissipation rate; above this limit, the instrument noise prevails over the measurements. The maximum wavenumber to estimate the integration upper limit is 46 cpm. The ε associated with each spectrum represents the spatial energy variation for each water mass. The lowest values are associated with the stations inside the bays (ε = 5 × 10⁻¹⁰ Wkg -1), while the highest value was located in the mainstream (ε = 3 × 10⁻⁸ Wkg -1) at a depth and location associated with the UCDW. The ε associated with the presence of WSDW has the lowest energy values.
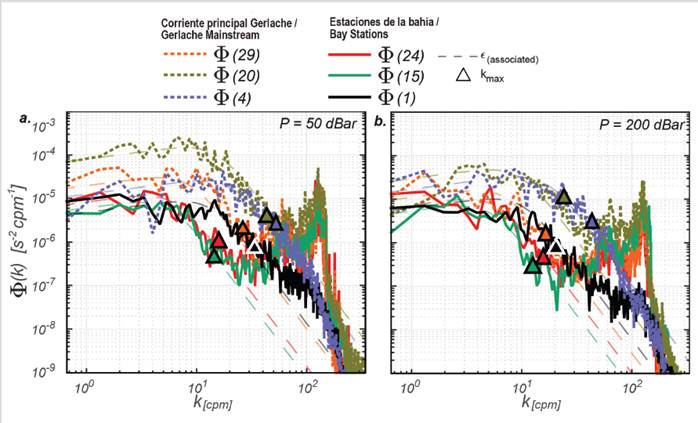
Figure 4 Wavenumber energy spectrum at a. 50 m and b. 200 meters depth for three stations inside each bay, and three stations over the Gerlache mainstream. 50 and 200 m depth was chosen to illustrate the influence of direct convective processes that dominates shallow waters. The dashed lines indicate the predicted spectrum at high wavenumbers where instrument noise dominates the measurements.
The variability of ε with depth was estimated in 3 m bins, resulting in an average value of ε = 2 × 10⁻⁸ Wkg -1 with remarkable and sporadic peaks of O (ε = 1 × 10⁻¹⁰ Wkg -1) inside the bays and O (ε = 3 × 10⁻⁶ Wkg -1) in the Gerlache mainstream at around ~200 m depth (Figure 5), where the water interface is located. The variability at the surface and over the first 100 m is higher than at depth due to the wind and atmospheric influence, in agreement with the water stratification (N). Below 100 m the stratification is essentially uniform, and ε at the stations located over the Gerlache mainstream is larger by one to two orders of magnitude than in the bays, largely due to bathymetry and water-shear interaction. Sections of the vertical profile of dissipation as a function of depth (Figure 5) have uniform values of dissipation (same order of magnitude). For instance, stations on the Gerlache mainstream show a large ε over different depths range, this indicate depth ranges over which vertical overturning of water is occurring. This occurs principally where different water masses meet and interleave and thus mix. The results are roughly in agreement with Ross and Lavery (2010) who report an average of ε = 1 × 10⁻⁹ Wkg -1 close to Anvers Island.
DISCUSSION
Higher levels of energy dissipation (i. e. ε > 10-8 Wkg -1) are related to the exchange of energy and turbulent dissipation produced by the entrance of UCDW and the AASW to the GS. This assumption is evidenced by the depth location of the maximum ε (Figure 5), where the water masses are mixing and thus eroding the signature of the original water masses. At the Flandes location, there is a transfer of energy from the warmest deeper to the coldest upper waters that releases potential energy from the temperature field. This compensation produces a well-mixed layer marked by density gradients, diapycnal mixing occurring in some locations is confirmed by the reduction of the deep-water vertical density gradient recorded in the interior stations. For instance, when comparing bays, once can see from Figure 3f, that the pycnocline is much more eroded in Flandes than in Anvord Bay or Charlotte Bay. The increase of the mixing values from Flandes to Andvord and Charlotte Bays is related to the reduction in the stratification of the pycnocline (Figure 3g-h); this could be produced by the dominance of the turbulent processes reflected in the lower values of both the water buoyancy and Turner angle.
High values of the buoyancy frequency are required to maintain the balance of the vertical diapycnal flux; because of this lack of stability, the system is prone to produce overturning through the full water column. A weak stratification allows the entrances of the UCDW to the GS, which brings lower levels of oxygen (220 µmol kg-1) and due by biological processes can reach 37 µmol kg-1 in the area (Torres et al., 2020). Mixing and water masses interaction can affect biological cycles such as vertical migration. Lower stratification also affects the system stability as we quantified by the Tu. There is an area where the full water column is prone to change easily its condition from stable to salt fingering and is the Charlotte Bay. The Charlotte Bay is the first location affected by the entrance of colder northern water (WSDW), that interact with relative warmer southern water (UCDW); this interaction creates a decreasing value of potential temperature and salinity in-depth, conditions to develop double diffusion process. At the southern bays the stability is enhanced by the remarkable presence of UCDW below the AASW, but just until the first 100 m depth where the system loses the stratification and double-diffusive process such as salt fingering can be produced (Figure 3h).
Diapycnal diffusivity calculated at the GS gives a mean value of O (log 10 k ρ = -4.7 m2 s-1) at the Flandes section, O (log 10 k ρ = -4.9 m2 s-1) at the Andvord section, and O (log 10 k ρ = -5.3 m2 s-1) at the Charlotte section (Figure 6). At all sections the highest values of k ρ occur at the surface due to ventilation with the atmosphere. This implies a higher level of energy that can be transferred from the ocean to the glaciers, accelerating the glacier retreatment located in the study area (Torres et al., 2020). The diapycnal map is patchy, with clear hot spots at the upper mixed-layer; these are mainly located at the entrance of each bay, where there is a slight topography change. The resident waters work as a natural barrier resisting the erosion and impact of external waters with higher temperatures that could impact directly the interior glaciers bays. The location of the hot spots implies that there may be interaction with the resident waters in the bays at such depths. The bays are configured such that each southern border acts as a thermal and mechanical barrier to the main South-to-North circulation of the GS, thereby reducing the diapycnal mixing by reducing the water-mass interaction. Comparing the three sections from the southwest to the northeast, there is a clear enhancement of dissipation in the south part where the mixing was concentrated in the shallow waters (AASW - UCDW interaction). In the north part, the mixing was concentrated in the interface UCDW - WSDW.
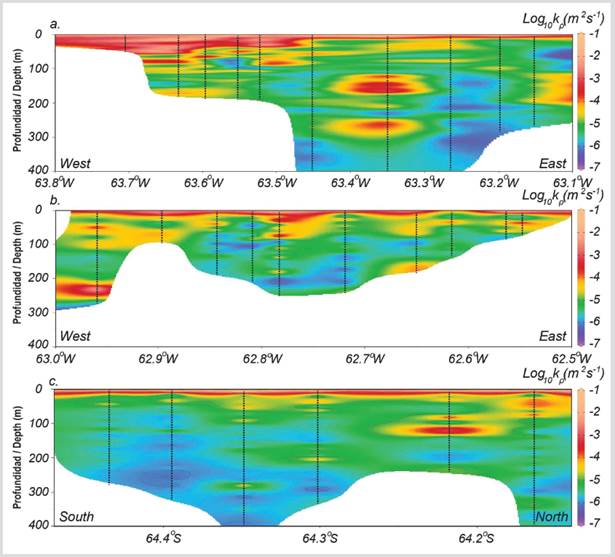
Figure 6 Diapycnal diffusivity sections calculated in logarithmic scale over the a. Flandes, b. Andvord, and c. Charlotte Bays. Dashed lines identify the location of each VMP station.
To confirm if the entrance of UCDW and the AASW can provide the energy for the observed mixing, we consider if internal wave radiation is relevant in this area. This is the level of propagation of the internal waves regarding the bathymetry, current, and water stability. To do so, we calculate the steepness parameter:
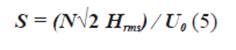
where H rms is the RMS height of topography; we get an average peak value of 0.2. Values S < 0.3 indicate that 10 % or less of internal wave energy is dissipated locally, confirming a transition from a linear to an inertial oscillation regimen (Nikurashin and Ferrari, 2011). This low value indicates that most of the energy provided for the observed turbulence and mixing at intermediate layers is likely to be produced by the wave-wave interaction. From the distribution of the energy spectrum at different depths (Figure 4), there is a non-linear interaction with energy variations at the water interfaces where the entrance of UCDW and AASW were. Further studies will need to confirm this hypothesis.
The AASW moves around the west side of the Antarctic Peninsula, impacting the shallow part of the local ice-shelves and their glaciers. The impact causes loss of stability of the waters in the northern part of the GS in terms of temperature, lower stratification, and higher vertical mixing values. There is a clear exchange of properties between the UCDW and the branch of the WSDW that enters the intermediate waters of the GS from the north. This can produce an interleaving process due to temperature, and salinity variability (diapycnal spiciness). The UCDW has the highest energy available to produce the sort of mixing that can potentially impact the Gerlache Bays. Since the main circulation and the sea-ice -cover protect the interior water properties of the bays, the resident waters are only slightly affected by this intrusion. Another factor to consider is the bathymetry: the smooth slope from the Gerlache mainstream to the interior of the bays helps to block the entrance of external waters. In Flandes Bay, the water flow interacts with the bathymetry, suggesting internal wave generation. This could be an energy source for the mixing recorded in this area.
CONCLUSIONS
For the first time, a summer-time diapycnal diffusivity map was successfully quantified in the main bays of the Gerlache Strait. The mixing and diapycnal diffusivity profiles quantified with the VMP shear sensors are consistent with the variation of the internal water properties measured by the temperature and salinity sensors on the Gerlache pathway from the southwest to the northeast and from the mainstream to the interior of the bays. Stratification is significantly weaker when we move to the northeast, due to erosion of the summer thermocline from shear and mixing developed earlier the southwest. Maximum diapycnal diffusivity values change from log 10 k ρ = -2.5 m2 s-1 at the Flandes section to log 10 k ρ = -3.1 m2 s-1 at the Charlotte section, implying well-mixed waters in the northern part of the GS. The high stability levels of the waters inside each bay combined with low values of k ρ , may influence the amount of sea ice produced in each bay. These k ρ values show that a high amount of energy is potentially available to produce mixing in the northern part where the WSDW enters, and shallow waters at the southern part of the GS. This result should motivate further studies to identify the different mixing mechanisms that can impact the fluxes of properties and nutrients from the UCDW into the AASW, affecting the physical, biological, and chemical systems. To identify the predominant mixing processes that originate in the area, we will deploy a parallel ADCP to measure the current velocities in a future expedition.
Here, we have identified a spatial pattern that relates the intrusion of UCDW to the resident water in the bays. This interaction produces a range of well-mixed waters in the Gerlache Strait Bays. This pattern matches the location of the hot spots of higher mixing turbulence levels and the variability of water properties throughout the Gerlache water column. Interleaving processes may be present at the entrance of each bay. Another consideration is how fast (spatially) the AASW temperature might change. Low temperatures in primary production location is a condition to capture atmospheric carbon dioxide (CO2), conditions we observed in Flandes Bay but not Charlotte Bay. These processes need further research in the context of climate change, which is likely to water mass variations that may supply energy (heat) that contributes to the cycle of glacier melting in the area and oceanic sequestration zones for CO2. In further work, we will quantify the production, incidence, and dissipation of internal waves and tides in the area.