text in
  English (pdf)
 Article in xml format
 Article references
 Send this article by e-mail
 Cited by SciELO
  Cited by Google
  Similars in
SciELO
Similars in
SciELO  Similars in Google
 Permalink
Estuaries are one of the most productive ecosystems, next to corals (Sharples et al., 2017). This productivity is affected by fluctuations in the physical forcing including tides, river discharge, anthropogenic influence and local geomorphology. The Guayas estuary is the largest estuarine ecosystem on the Pacific coast of South America, and has an inner and outer estuary (Cucalón, 1983; Stevenson, 1981; Twilley et al., 2001; Figure 1A). The outer estuary is the Gulf of Guayaquil, while the inner estuary includes: 1) the Guayas River estuary; 2) the Ecological Reserve of Manglares de Churute estuary, influenced by the Guayas, Taura and Churute rivers, and 3) the Faunistic Production Reserve of Estero Salado, currently uncoupled from river flow and highly influenced by the city of Guayaquil and shrimp pond effluents. Freshwater input is heavily affected by hydrologic projects, including the Daule-Peripa dam and the Bulubulu-Cañar diversion.
We used oceanographic and meteorological observations to describe the hydrographic variability of two study areas in the inner-estuary: Manglares de Churute and Estero Salado (here on referred to as MC and ES). These sites were chosen due to their physical differences, importance for several economically-important fishery species (Solórzano and Viteri, 1993; Naranjo, 2002; Zambrano and Meiners, 2018) and the large city of Guayaquil.
Data were taken from six stations in MC and seven in ES, from the mouth to the head of each estuary along the channel. Stations were evaluated monthly from February/2016 to February/2017, during different tidal stages, using a Conductivity Temperature Depth (CTD) profiler (Sontek CastAway) to obtain salinity, temperature and depth. Turbidity and dissolved oxygen (DO- content and percentage) were measured at the surface using a Turbidimeter 2100Q-Hach (calibrated before each campaign), and a multiparametric device Hach-HQ40D, with an LDO10101-Campo Sonde. Nutrients (nitrites and phosphates) were determined from surface water samples taken in Nalgene bottles, whenever available. These bottles were washed with Milli-Q water and dried in a hood in the lab, and then rinsed with in-situ water before sample collection. Precipitation and air temperature were obtained from stations nearest to the study sites: Guayaquil Airport and Payo-Bulu Bulu (Figure 1). We used a two-way Analysis of Variance (Anova) with site, season, and their interaction as fixed factors, and daily mean values as the sampling unit, to determine if the environmental properties varied significantly. The type III sum of squares was computed for determining significance because the sampling design was unbalanced (Underwood, 1981). Data were log10 (x + 1) transformed to meet parametric assumptions. Assumptions were tested using normal probability (quantile-quantile) plots, and boxplots of residuals versus fitted values (Sokal and Rohlf, 1995). Pair-wise comparisons were conducted using Tukey’s Honestly Significant Difference test.
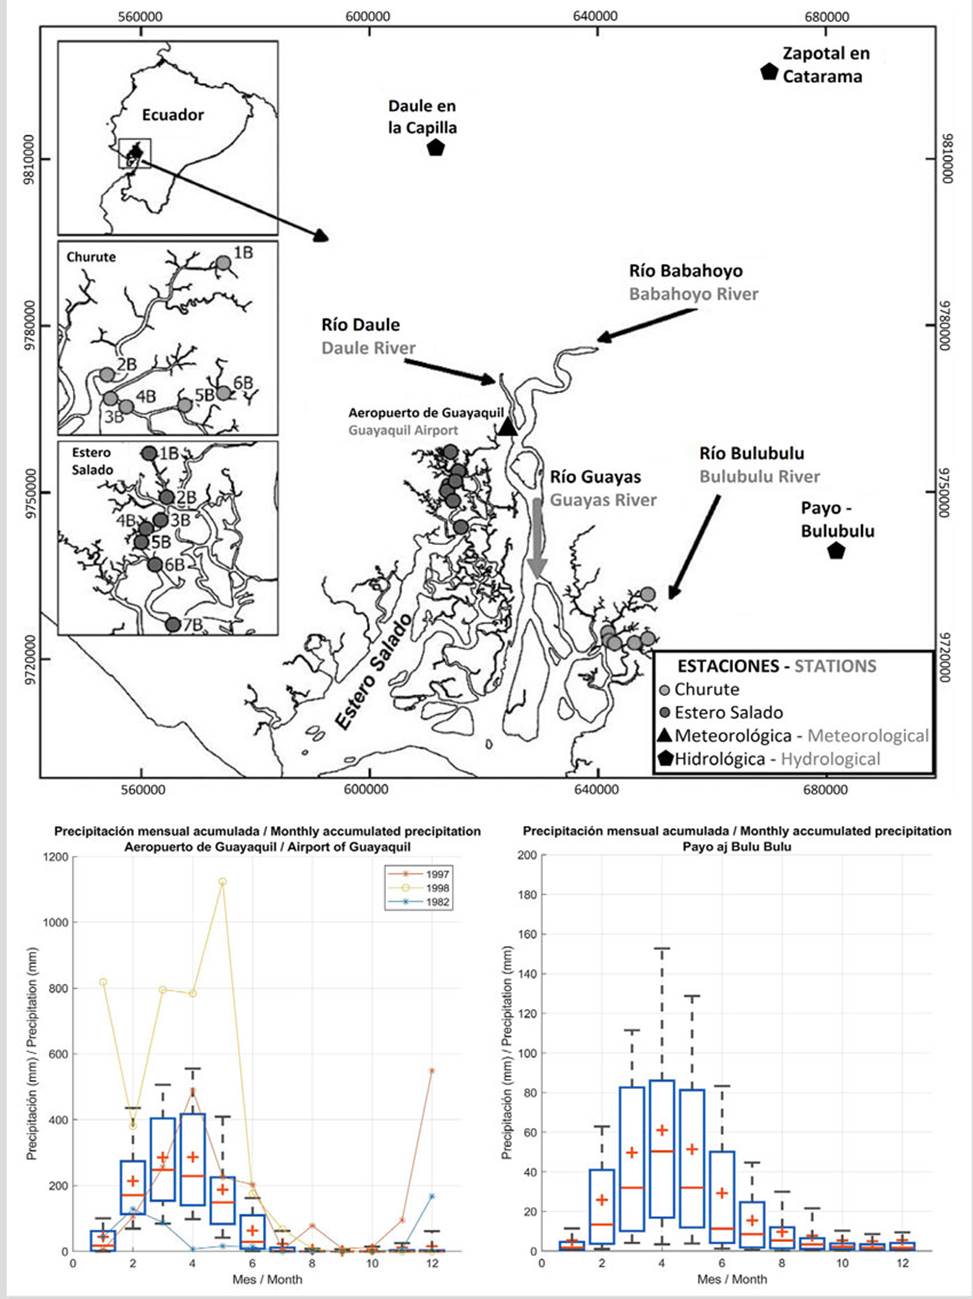
Figure 1 Gulf of Guayaquil inner estuary: Manglares Churute stations in light grey circles; Estero Salado stations in dark grey circles; meteorological/hydrological stations in triangles and pentagons. Boxplot of monthly-averaged precipitation for 1964-2015 for a) Guayaquil and b) Payo-Bulubulu. Black and grey lines show 1997-1998 El Niño (data not available at Payo station). Precipitation from the 1998 Meteorological yearbook of INAMHI (Ecuadorian National Institute of Meteorology) Nº38.
Circulation and salinity distribution in the estuary are impacted by two seasons: dry (June to November) and wet season (December to May). Salinity in the inner estuary (8 to 20 PSU) reflect the seasonality of discharge and precipitation, along with exchange flow (Murray et al., 1975; Cifuentes et al., 1996; Barrera Crespo, 2016). On longer timescales, interannual events such as El Niño Southern Oscillation (ENSO) have a strong influence on precipitation and temperature. Positive sea surface temperatures (SST) anomalies in the Pacific enhance convection, leading to large precipitation events on the coast of Ecuador. This survey started at the end of a strong Central Pacific ENSO (late 2014 -Tollefson, 2014). These warm anomalies did not disappear from the area until the 2017 April-May-June triad (Climate Prediction Center, 2020). The Ecuadorian Sea, in the ENSO 1+2 region, registered positive anomalies from April 2015 (1.35 °C) to May of 2017 (0.78 °C), with a peak of 2.87 °C in July 2015. Our surveys were performed during this warm event; thus, our data describe the Guayas estuary in warmer and potentially wetter conditions.
Surface water temperature (Figure 2A) ranged from 24.2 to 29.2 °C in MC and from 26.1 to 36.0 °C in ES, with significantly higher values in the latter (F1,22= 25.01, p < 0.001). Higher temperatures were found in both sites during the rainy season (Wet: 28.6 ± 1.2 vs. Dry: 26.7 ± 0.5, F1,22= 51.20, p < 0.001) along with lower salinities (0.08 PSU / 37.9 °C in MC, 10.33 PSU / 36.00 °C in ES, Figure 2B). Precipitation in Guayaquil during January-April 2016 had values > 150 mm × month-1; for all other months, values were below 1 mm × month-1. Precipitation was not available at Payo-Bulu Bulu for the survey; however previous data show monthly values from 0 to 278 mm, with a maximum in April (Figure 1C). As the dry season began, air temperatures decreased from 28.30 °C, in May, to 25.70 °C, in October (at the Guayaquil Airport), and mean salinity increased, reaching a maximum of 29.03 PSU in MC, and 28.50 PSU in ES. Water temperature during the dry season reached its minimum values of 24.20 °C in MC, and 26.10 °C in ES. Salinity in ES was significantly higher than in MC (22.1 ± 5.0 vs. 12.9 ± 7.8, F1,21= 4.96, p = 0.04), indicating the influence of freshwater mostly from precipitation, and the lack of river input in ES (Figure 2B).
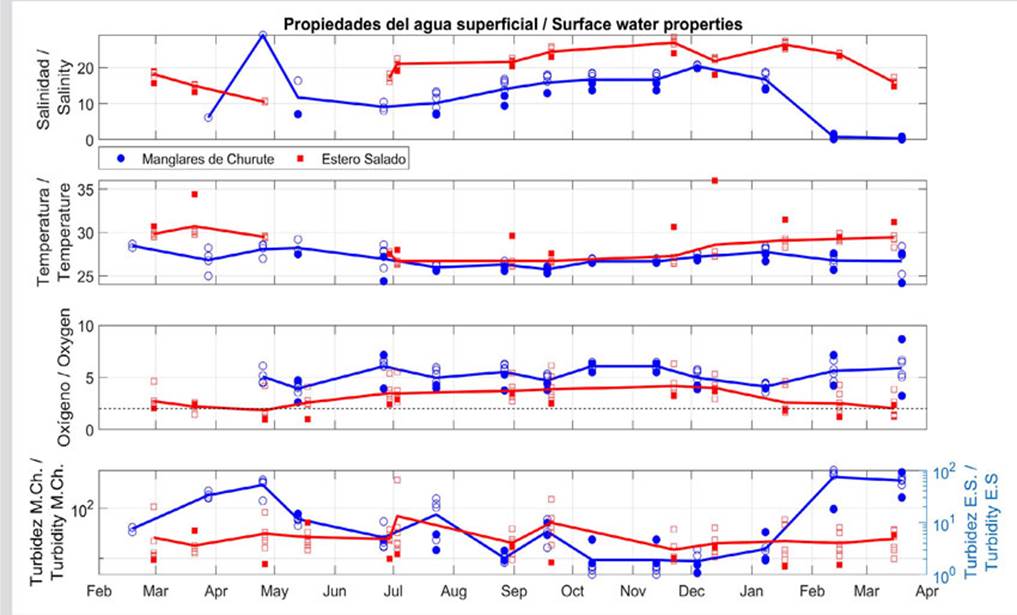
Figure 2 Surface water properties at Manglares Churute (six stations in blue) and Estero Salado (seven stations in red). a) Salinity (PSU). b) Temperature (°C). c) DO (mg × L-1), the dashed line indicates low DO values at 2 mg × L-1. d) Turbidity (log NTU) in MC (left axis), and ES (right axis). Survey averages in continuous lines, samples taken at mouths of each site are shown as filled symbols.
Most of the MC stations had DO values between 2 and 6.5 mg × L-1, while ES registered lower values (average 2.5 mg × L-1), with hypoxia (< 2.0 mg × L-1) from January to April (Figure 2C). MC registered significantly higher DO levels than ES (5.3 ± 0.8 vs. 3.0 ± 0.8, F1,21= 73.53, p < 0.001). Average DO values in both areas increased in the dry season: MC averaged 5.1 mg × L-1, and ES 4 mg × L-1. Values were significantly lower during the wet season (F1,21= 4.96, p = 0.001). Differences between the mouth and the head of the estuaries show the influence of the ocean, with lowest values at the heads of the estuaries. The wet 2017 season had lower values of DO in both study areas compared to 2016, as expected from the solubility relationship (higher DO under lower temperatures, and vice versa -Weiss, 1970). Higher DO values in MC, in particular during the wet season, might suggest city-related contamination, waters from shrimp farms and lack of mixing or entrainment in ES (Solorzano and Viteri, 1993; Limongi et al., 2018).
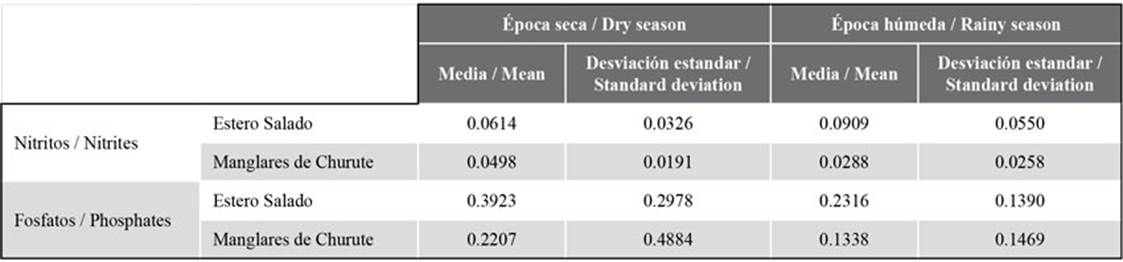
Turbidity values in MC were an order of magnitude greater than in ES (Figure 2D). In MC, the highest turbidity values were found in the wet season and appeared to be associated with lower salinity, while the dry season showed the lowest turbidity and high salinity. In contrast, ES’s turbidity values were higher during the dry season between March and September, when precipitation was reduced to its minimum. There was a significant interaction in nitrites between sites and seasons (F1,20= 5.69, p = 0.03, Table 1), with higher values in ES during the wet and dry season than in MC during the wet season (p < 0.04). Phosphates were significantly higher in ES than MC (0.31 ± 0.17 vs. 0.17 ± 0.16, F1,22= 10.64, p = 0.004) and during the dry when compared to the wet season (0.34 ± 0.22 vs. 0.17 ± 0.10, F1,22= 7.17, p = 0.01). Elevated nutrient values in ES, though scarce, are indicative of anthropogenic influence in the estuary (Borbor-Córdova et al., 2006; Cárdenas Calle, 2010; Limongi et al., 2018).
Table 1 Surface nutrients in Manglares Churute and Estero Salado during 2016. Means and standard deviations determined for each station and each season.
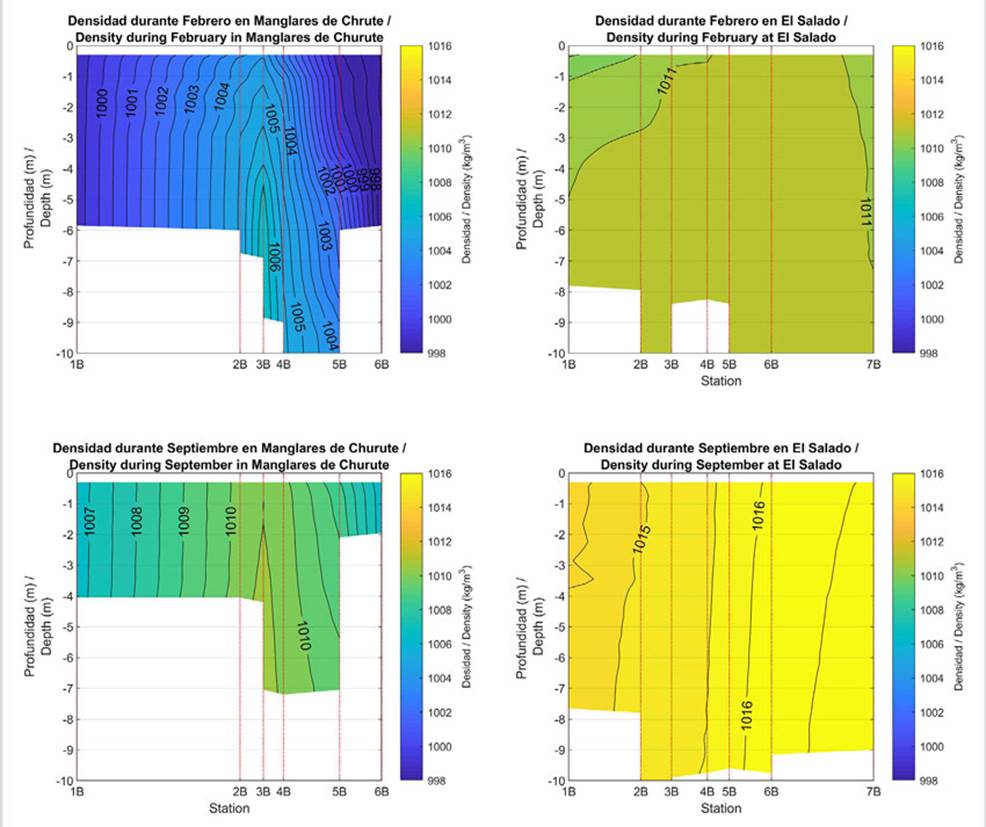
CTD profiles of density were highest at station 3 in MC (1007 kg × m-3 in February, 1010.5 kg × m-3 in September), with the highest values at depth indicative of the ocean forcing (Fig. 3). Density at MC also decreased at the stations up the arms of the estuary (from stations 3 to 1 and from 3 to 6). In ES, density decreased with distance from the mouth of the estuary, and increased with depth, potentially due to the lack of freshwater input (Figure 3c-d). Higher density (related to higher salinity and lower temperature) were found in September (1014 kg × m-3 at the head and 1017 kg × m-3 at the mouth), while in February, readings were lower with values between 1010 kg × m-3 at station 1 (head) and 1011 kg × m-3 at station 7 (mouth).
Our results suggest that hydrographic conditions in the inner Guayas estuary are influenced by seasonal variability and anthropogenic activities. Seasonal variability influences the two estuaries differently, as MC is more connected to the Guayas River, and has a stronger runoff effect than ES, which is not connected to a river and in an urban location.