


Services on Demand
Journal
Article
 English (pdf)
 Article in xml format
 Article references
 Send this article by e-mail
Indicators
-
 Cited by SciELO
 -
 Access statistics
Related links
-
 Cited by Google
 -
 Similars in
SciELO
Similars in
SciELO -
 Similars in Google
Share

 Permalink
Ingeniería y Universidad
Print version ISSN 0123-2126
Ing. Univ. vol.18 no.1 Bogotá Jan./June 2014
Livelihood Factors, Explaining Water Consumption in a (de facto) Multiple Uses Water System in Colombia1*
Medios de sustento como factor explicativo del consumo de agua en un sistema de abastecimiento rural para uso múltiple (de hecho) en Colombia2
Isabel Domínguez3
Wilmar Torres-López4
Inés Restrepo-Tarquino5
Ricardo Oviedo-Ocaña6
Ian Smout7
1Reception date: September 28th, 2012. Acceptance date: June 4th, 2013. This paper was developed on a research project from the Integrated Water Resource Management Group, Universidad del Valle, Cali, Colombia.
*The authors thank the musgroup for providing financial support; the communities from La Palma and Tres Puertas, in Restrepo; and to the Coffee Growers Committee from Valle del Cauca Department (Colombia). Isabel Domínguez y Ricardo Ocaña-Oviedo thank Colciencias (Administrative Department of Science, Technology and Innovation in Colombia), for their PhD scholarships.
2Fecha de recepción: 28 de septiembre de 2012. Fecha de aceptación: 4 de junio de 2013. Este artículo fue desarrollado en el grupo de investigación en Gestión Integrada del Recurso Hídrico, de la Universidad del Valle, Cali, Colombia.
3Ingeniera sanitaria, Universidad del Valle, Cali, Colombia. MSc. in Water and Environmental Management, Loughborough University, United Kingdom. PhD student, Newcastle University, Newcastle upon Tyne, United Kingdom. E-mail: i.c.dominguez-rivera@ncl.ac.uk.
4Estadístico, Universidad del Valle, Cali, Colombia. Profesor auxiliar, Escuela de Estadística, Universidad del Valle. E-mail: wilmar.alexander torres@correounivalle.edu.co.
5Ingeniera sanitaria, Universidad del Valle, Cali, Colombia. MSc. en Ingeniería de Sistemas, Universidad del Valle. PhD in Knowledge Transfer, University of Leeds, United Kingdom. Profesora asociada, instituto Cinara-Universidad del Valle. E-mail: ines.restrepo@correounivalle.edu.co.
6Ingeniero sanitario, Universidad del Valle, Cali, Colombia. MSc. en Ingeniería, Universidad del Valle. Candidato a PhD en Ingeniería, Universidad del Valle. Profesor auxiliar de la Escuela de Ingeniería Civil de la Universidad Industrial de Santander, Bucaramanga, Colombia. E-mail: eroviedo@uis.edu.co.
7B.A. Engineering, University of Cambridge, United Kingdom. MSc in Agricultural Engineering, University of Reading, United Kingdom. Principal Programme Manager, Water Engineering and Development Centre (WEDC), Loughborough University, United Kingdom. E-mail: i.k.smout@Lboro.ac.uk
Abstract
In developing countries, rural water supply systems, generally planned for a single purpose, are used for domestic and productive activities. Research has found linkages between access to water and livelihoods, thus, promoting the implementation of Multiple Uses of Water Systems (MUS). However, there is concern on how users with more productive assets may exploit the highest levels of service promoted by MUS affecting users with fewer chances to use water productively. This article analyses through a case study and using multivariate techniques (Principal Component Analysis and Cluster Analysis): key variables to characterize the users of a de facto MUS; identifies groups of users according to those variables, and discusses implications of the findings in the design and management of systems. Results show correlations for the variables Homestead Area, Storage Capacity and Number of Cows, with Household Water Consumption. Two groups of customers with statistically significant differences for key variables are identified. The results suggest that rural water systems should not be designed with household size as the only criterion. It also highlights the need of managerial rules for equitable access to water in systems, recognizing diversity of users, livelihoods and thus, water demands.
Keywords: Access to water, livelihoods, Multiple Uses of Water (MUS), multivariate analysis, principal component analysis, cluster analysis, water consumption, Colombia.
Keywords plus: Water consumption, water use, water resources development, water-supply rural, Cluster analysis- Colombia.
Resumen
En países en desarrollo, sistemas de abastecimiento de agua rurales, generalmente planeados para un propósito, se usan para actividades domésticas y productivas, que evidencian relaciones entre acceso al agua y medios de sustento. Estas relaciones han impulsado sistemas de usos múltiples del agua (MUS). Sin embargo, hay preocupación de que usuarios con mayores activos productivos puedan beneficiarse de los mayores niveles de servicio de MUS y afecten a usuarios con menor capacidad para usar el agua productivamente. Esta investigación emplea un caso de estudio y técnicas multivariadas para: a) identificar variables clave para caracterizar los usuarios de un MUS de hecho; b) identificar grupos de usuarios acorde con dichas variables y c) plantear implicaciones de los hallazgos en el diseño y gestión de sistemas. Se encontraron correlaciones entre: tamaño de predio, capacidad de almacenamiento, unidades de vacas, y consumo de agua. Se identificaron dos grupos de usuarios con diferencias estadísticamente significativas para variables clave. Se concluye que los sistemas rurales no deben restringirse al tamaño de hogar como único criterio de diseño. Así mismo, se deben adoptar estrategias de gestión para garantizar acceso equitativo al agua, reconociendo la diversidad de usuarios, medios de sustento y, por tanto, de demandas de agua.
Palabras clave: Acceso al agua, medios de sustento, usos múltiples del agua (MUS), análisis de componentes principales, análisis de clúster, consumo de agua, Colombia.
Palabras clave descriptotes: Consumo de agua, utilización del agua, desarrollo de recursos hídricos, abastecimiento de agua rural, análisis Cluster - Colombia.
D0I:10.11144/JAVERIANA.IYU18-1.MSFE
Introduction
The drinking water target from the Millennium Development Goals has been reached. In 2010, however, over 780 million people in the world still did not get their drinking-water from improved sources, with a more pronounced disparity between rural and urban areas in developing countries. While 80% of the urban population had access to piped water connections in urban centres, only 26% had this level of service in rural areas (WHO and Unicef, 2012), and it is commonly the poor people from those rural areas who are most vulnerable to lack of the services, or to receive them with lower quality or reliability (Hansen and Bhatia, 2004).
On the other hand, most poor people living in rural areas of developing countries, depend on agricultural production for their income (World Bank, 2009), relying on physical assets such as land, cultivated areas, livestock, agricultural equipment, among others (Haughton and Khandker, 2009). For these people, access to water is key to support their livelihoods, increase productivity, employment, reduce the risks associated with drought, and diversify their income sources (UNDP, 2006).
Because agriculture is essential for poor people, in rural areas water supply systems are commonly used for domestic and productive activities. However, the systems are generally planned and managed to provide water for drinking or irrigation purposes, separately. Thus, small-scale productive uses of water are usually neglected by the mandates of the various water sector agencies in the different countries (Van Koppen, Moriarty, and Boelee, 2006; Smits et al., 2010a), contributing to poverty, food insecurity and migration to the cities.
Declarations from important multilateral events placed access to water for poor people as a key issue on the international agenda (UN, 2002). In response to this challenge, the concept of Multiple Uses of Water Systems (MUS) emerged aiming to introduce water access that responds to the full range of people's needs (Van Koppen and Smits, 2010). MUS takes elements from the Sustainable Livelihoods Approach, which considers that people require a range of assets to achieve positive livelihood outcomes. Water supply and sanitation are part of the physical assets required to achieve those livelihood outcomes, and lack of them is considered a core dimension of poverty (Moriarty and Butterworth, 2003).
Several studies on MUS addressed relations between variables such as water use, water consumption, access to water and livelihoods (Perez de Mendiguren Castresana, 2004; Upadhyay, 2005; Hadjer, Klein, and Schopp, 2005; Katsi et al., 2007; Smits et al., 2010a; Mikhail, 2010; van Houweling et al.; 2012). Perez de Mendiguren Castresana (2004) in South Africa, Upadhyay (2005) in India, and Katsi et al. (2007) in Zimbabwe found evidence on the positive relations between access to water for multiples uses, livelihoods and poverty reduction. Van Houweling et al. (2012) in rural Senegal, characterize women's livelihood activities that rely on MUS and analyse the income and livelihood benefits obtained from access to these systems.
On the other hand, there is an increasing concern on the way benefits of MUS services are distributed across different population sectors, since there is a risk that these interventions allow rich people to exploit the opportunities of the highest levels of service to the detriment of the poorest (Mikhail, 2010). For instance, in rural Honduras, Smits et al. (2010b) found that water consumption varies according to user categories: people in the labourer category had negligible water consumption for productive uses (2.7 litres per capita per day [lpcd]) compared to those in the large-farmer category, with consumptions around 480 lpcd; and Hadjer et al. (2005) found that the rich consumed up to 50% more water than poor households. Therefore, if within a system all have virtually the same level of service, some questions to address are: What are the most important variables to characterize the users of a MUS? What groups of users exist in the system according to those key variables? What are the implications of those differences between groups of users for design and management for MUS?
This study approaches the above-mentioned questions using a case study. A survey was conducted to household customers of a de facto MUS system - a system designed for a single purpose, i.e. provision of drinking water, but used for multiple purposes (Van Koppen et al., 2006). The data collected considered aspects of access to water and livelihoods. These aspects were linked to household water consumption records. Data were analysed using statistical multivariate techniques. Key variables that influence water consumption in this MUS were identified and the relations among them. Customers were grouped in clusters according to those key variables. This information contributes to improved understanding of relations between water consumption in rural MUS systems and aspects of livelihoods and access to water. It provides evidence that highlights the need of mechanisms to incorporate the diverse needs of different categories of customers in the design and operation of the rural water systems.
1. Methods
1.1. The Study Area
The water supply system of La Palma Tres Puertas serves eight rural settlements in Valle del Cauca, Colombia. The territory is mountainous located on the Andes range. The villages have a dispersed settlement pattern with land suitable for crops and forest. The median temperature is about 20 °C, with bimodal precipitation, with annual average between 880 and 1,392 mm/year (Ospina, 2009).
The water supply system had 100% of coverage, serving 437 households, on average once a week. This required shifts for provision and families implemented adaptation strategies, such as building private storage tanks. Households had individual meters, and a centralized packaged drinking water plant is operating since 2010. An administrative board manages the system and hires a caretaker for operation and maintenance. In 2010, households paid 2.5 US$ for the first 25 m3 every two months. Beyond 25 m3, each m3 had a charge of 0.16 US$.
About 80% of the population use water for at least one productive activity, animal husbandry, agriculture or both. The water supply system is used by almost all households for all domestic uses (98%) and for raising animals (96%). It is used to a lesser extent for crops, since rainfed agriculture is practised. However, when water is needed for agricultural uses it is obtained from the water supply system (Ospina, 2009).
1.2. Data Collection
1.2.1. Household's Average Water Consumption
Water consumption of households was obtained from readings of their meters, which were carried out every two months. Average water consumption for each household was calculated from available valid records from January 2009 to December 2009 (six records — one record every two months). Households with three or more valid records were kept for the analysis. Records were classified as "invalid" in cases with no reported value, reported values from 0 to 3 m3 (for 2 months) or a reported negative value. By using these criteria, 313 households resulted for analysis. The variable monthly Household Water Consumption (HWC) for each household was obtained by dividing by two, the average of the valid records of water meters for each household. As bimonthly records were available instead of monthly records, a differentiated analysis between wet and dry season was not possible, since the bimonthly periods of readings did not match with the bimodal climatic behaviour in the area.
1.2.2. Water Use Related Characteristics of the Households
Water use related characteristics of households were captured from a household survey. The 313 households with valid water consumption records were the sample frame for the survey, including households from all the villages covered by the system in a range of water consumption, from an average of 4 to 378 m3/month. A simple random sample was defined. The sample size was estimated by using the equation for Sample Size to estimate the mean for Finite Populations (Fernández, 2001). A confidence level of 95% was used and a precision of ± 7 m3 for a sample size of 112 households to survey. Considering a non-response rate of 10%, 11 additional households were randomly selected allowing for replacement. The sample size was 123 households.
The survey was formulated to characterize households according to livelihoods and access to water aspects, believed to influence water consumption in this MUS. The survey included questions informed by findings from a preliminary study carried out in the locality (Ospina, 2009), and literature reviewed on MUS (Moriarty and Butterworth, 2003; Perez de Mendiguren Castresana, 2004; Hadjer et al., 2005; Upadhyay, 2005; Boelee, Laamrani, and Van der Hoek, 2007; Katsi et al. , 2007; Senzanje, Boelee, and Rusere, 2008; Mikhail, 2010; Smits et al., 2010a; Van Koppen and Smits, 2010), and livelihoods (Ashley and Carney, 1999; UNDP, 2003 and 2006; Haughton and Khandker, 2009; World Bank, 2009). The survey was administered through face to face interviews, targeting adult household members that provided granted verbal consent before they were interviewed. Information was collected on 39 variables, most of them regarding the range of different species of animals and crops people had, since most livelihoods dependent from water were agriculture and livestock keeping.
1.2.3. Data Analysis
Descriptive statistics were calculated for the 39 variables in the survey — those statistics are discussed elsewhere — (Domínguez, 2010). This descriptive analysis allows reducing the set of 39 variables to nine. For the discarded variables, most customers had missing data (0); therefore, these variables did not provide enough information to allow their use for subsequent statistical analysis with the selected techniques.
The nine variables used from the household survey were: Household Size (HS), Homestead Area (HA), Cows Units (CU), Maize Area (MA), Pineapple Area (PA), Coffee Area (CA), Pigs Units (PU), Frequency of Service (FS) and Storage Capacity (SC). Data from average household water consumption (HWC) obtained from records of household meters were added to the data from the nine variables collected in the 123 households through the household survey. The analysis used ten variables in total for each of the 123 households.
Two multivariate techniques were used: Principal Component Analysis (PCA) and Cluster Analysis, using the freely available statistical software R version 2.11.1 (http://www.r-project.org/)http://www.r-project.org/. PCA has many applications (Peña, 2002). In this case, it was used to find relationships between the 10 variables under analysis and identify key variables based on these relationships. Cluster analysis was performed to obtain groups of customers from the MUS according to the similarity between them. Customers belonging to one cluster are expected to be homogenous and between clusters customers should be heterogeneous with respect to the analysed variables. With the used clustering method, similarity is represented through a dendogram that facilitates the selection of the final number of clusters (Willis et al., 2011). Readers interested in more detailed description of the statistical procedures used may refer to Peña (2002) and Díaz (2002) for PCA and cluster analysis, and Pardo and Del Campo (2007) for a combination of PCA and cluster analysis using the software R.
To characterise the resultant groups of customers (clusters), descriptive statistics for the ten variables were computed. Finally, the Mann-Whitney test was performed to establish statistical significant differences between the clusters for the variables studied.
The key variables in the MUS, the groups of customers and their characteristics relating to water consumption, livelihoods and access to water were analysed to provide insights on the implications for design and management of MUS in rural areas of Colombia.
2. Results and Discussion
2.1. Key Variables to Characterize the Users of a MUS System
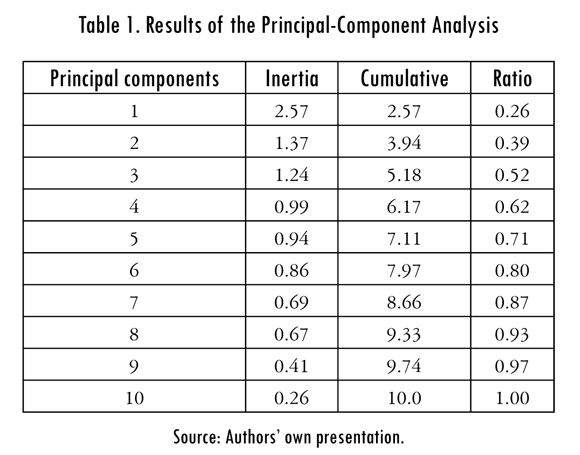
The PCA carried out with the ten variables produced 10 components. In a PCA, the number of resultant components is equal to the number of variables analysed. However, a component is not only comprised of a single variable but all the variables in the study (Ouyang, 2005). In this research, the first four Principal Components (PCs) accounted for 62% of total variance in the original set of variables (Table 1). Therefore, the first four components were analysed.
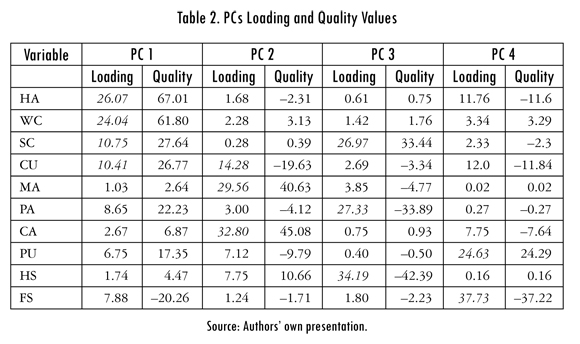
Each variable in a PC has associated a contribution (load) and a quality of representation. For this analysis tool, variables with high loads and high quality of representation are considered key variables. Table 2 includes the variables with loads and quality of representation for the first four PCs, with key loading values in italics. In most of the cases, those variables that had high loadings also had high quality of representation (e.g. HA and WC in PC1; MA and CA in PC2). A negative value for quality of representation of a variable in a PC indicates an opposite relation of this variable with other (positive) variables in the PC (e.g. FS in contrast to the remaining variables in PC1).
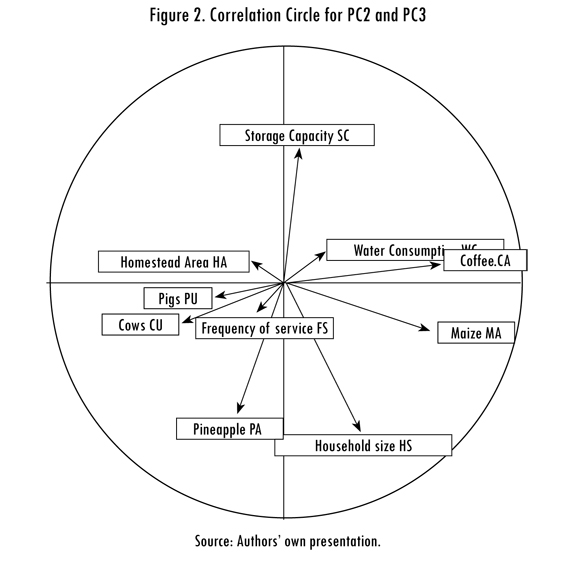
Figure 1 and 2 include correlation circles. These circles are graphical representations of the variables in Table 2, showing which variables are correlated among themselves, which variables are correlated with each PC. Since it is not possible to graphically represent more than three PCs, various correlation circles are needed to show the relations of interest, by using Cartesian planes (X, Y), showing pairs of PCs. The correlation circle in Figure 1 includes PC1 and PC2, PC1 represented in axis X and PC2 represented in axis Y. Correlation circle 2 (Figure 2) shows PC2 and PC3, with PC2 in axis X and PC3 in axis Y. PC4 was not represented in a correlation circle because important relations between the variables in this PC (FS and PU) had statistical connotation, but those relations do not have a practical explanation.
The correlation circle for PC1 and PC2 (Figure 1) shows that HA, HWC, SC and CU were strongly correlated and had direct positive relations (PC1). This may indicates that customers of this MUS with bigger homestead areas were mostly engage in livestock keeping, for which they demanded significant amounts of water and required big storage tanks to ensure permanent access to the resource. Thus, in this system, the livelihood activity most strongly correlated to HWC was livestock keeping. The average consumption for one cow ranges from 40 to 85 litres per head per day (Peden et al., 2007). This activity may represent an important demand for a system originally designed for domestic purposes, and could be an unplanned use that cannot be absorbed by the system (Van Koppen et al., 2009).
The relation between the private storage capacity and water consumption was also found in previous studies in the area, using different analysis techniques (Ospina, 2009). Benefits of storage are recognized such as time-savings in water collection, or synchronization of irrigation shifts. However, storage is also considered a potential source of inequities when large tanks are filled from communal systems, allowing some people hoarding water (Van Koppen et al., 2009).
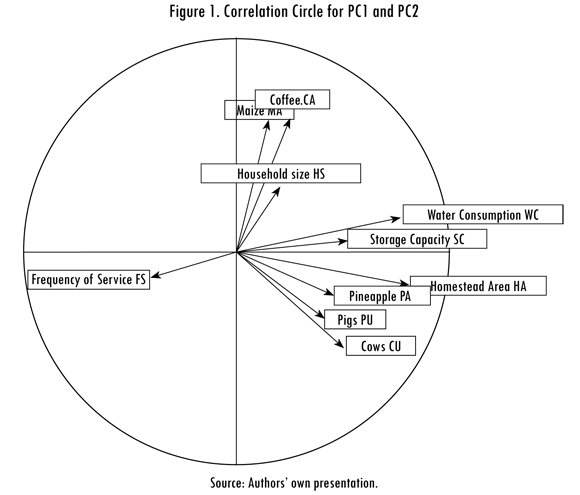
PC2 shows a strong correlation between CA and MA, which were opposite to CU. This reflects the existence of two differentiated types of customers, those whose livelihoods depend on coffee and maize cultivation and those engage in livestock keeping. In this system, customers with coffee and maize had these crops under rainfed systems, which may explain why these livelihoods did not appear correlated to HWC in the PCs.
The correlation circle for PC2 and PC3 (Figure 2), shows that SC has an inverse relation with HS and PA (PC3). The negative relation between storage capacity and household size may be explained because those who had big storage tanks, invested in them not because their domestic water needs, but to ensure water for productive activities. The negative relation between storage capacity and pineapple area may be due to the water requirements for this crop are satisfied by the water available with the precipitation levels in the area, decreasing dependency from the MUS to support water crop requirements, and thus, from storage due to the service intermittence in this system. There is also a negative relation between HS and PA, which may lack a practical explanation or which is not properly understood.
2.2. Groups of Users According to Key Variables in the MUS System
A cluster analysis using the variables in the PCA for the segmentation is shown in the dendogram in Figure 3. The heterogeneity change that appears in the dendogram suggests that two clusters were a good solution to divide the customers of this MUS. The number of customers in the first group was 20 (cluster 1) and 103 in the second group (cluster 2).
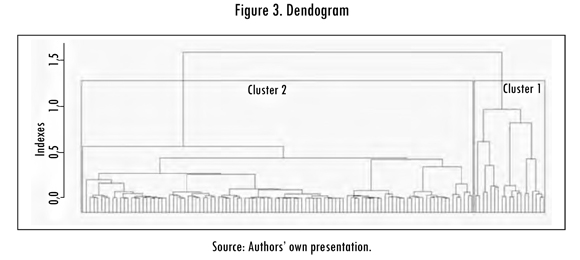
Figure 4 presents the final centroids of the two clusters identified in Figure 3. The centroids represent the clusters' general characteristics. Distance between the centroids confirms the adequate classification in two defined clusters. The scattered pattern of customers in cluster 1 suggests these customers are more heterogeneous than those in cluster 2.
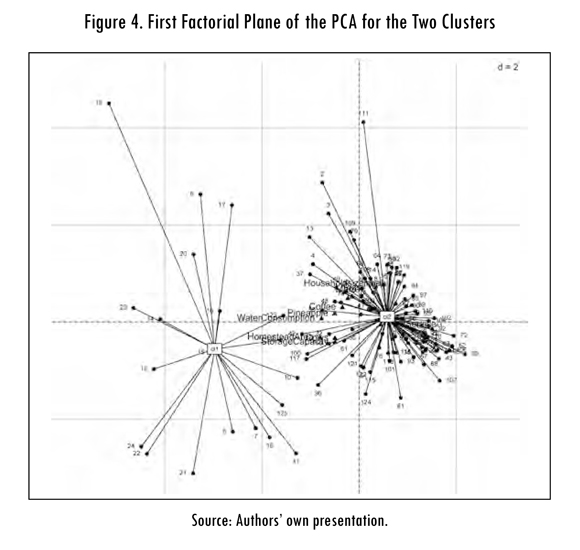
Table 4 includes descriptive statistics to compare the clusters and understand clusters' distinctive characteristics. The variables included are those with statistical significant differences between the two clusters (p values < 0.05 for the Mann-Whitney test).
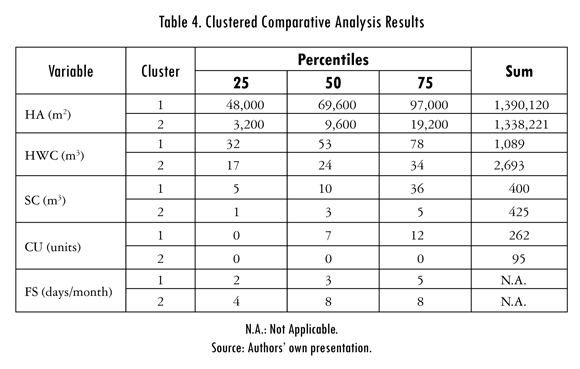
There are significant differences between the two clusters for the variables: HA, HWC, SC, CU and FS. Cluster 1 (20 households) was mainly composed by families with higher homestead area, higher storage capacity, more cows units, larger water consumption and less frequency of service. 50% of customers in cluster 1 consumed twice the water, had homesteads areas seven times bigger and storage tanks with capacities three times bigger compared the same proportion of users in cluster 2. These results look to the light to the dendogram, are in line with Van Koppen et al. (2009) who recognize that variations in water use are much larger for productive water uses, particularly at the higher end of the spectrum, due to the nature of water-dependent activities and scale. They suggest this may be a threat for equitable water distribution.
Translated to per capita demand, taking into account HS in both clusters that was 4 people, water consumption for 50% of customers in cluster 1 was 441 lpcd, while it was 200 lpcd for 50% of customers in cluster 2. These values for both clusters are classified as a high level of MUS, according to the water ladder proposed by Smits et al. (2010a) for allocations higher than 100 lpcd, which according to them, allow meeting a variety of water needs including, all domestic needs, garden, trees, livestock, and small enterprises.
50% of customers in cluster 1 had more than seven cows, while 75% of customers in cluster 2 did not have cows. These results contrast with research on MUS in other countries where livestock is a subsistence activity for the majority, such as in Senegal, where more than 80% of households have at least two cows (Van Houweling et al. 2012). In this case, livestock keeping was a livelihood for a few, those with greater assets.
The cumulative area of customers in cluster 1 (1,390,120 m2) is similar to the cumulative area of customers in cluster 2 (1,338,221 m2). In addition, customers in cluster 1 have a total storage capacity of 400 m3 compared to the 425 m3 total storage capacity of customers in cluster 2. These figures support the fact, that in many occasions the better-off have more land and other assets (such as big storage tanks) to use more water productively, in which cases, the productive use of water may exacerbate social inequities (Van Koppen et al., 2009). This also shows how water is only one factor contributing to livelihoods, and other aspects are also critical to enhance the benefits of water use such as land, veterinary care and food, seeds, fertilizers, among others. Lack of access to these means of production is many times a constraint for poor people to engage in productive activities, despite having access to sufficient quantity of water (Van Houweling et al. 2012).
There were no significant statistical differences for the two clusters on the variables: HS, CA, MA and PA. In this case, these variables are not important to define characteristics of the two groups of customers within this MUS. The lack of relation between household size and household water consumption was a result from both the PCA and the cluster analysis.
2.3. Implications of Key Variables and Clusters Identification for Design and Management of Rural Water Supply Systems Used for Multiple Purposes
The previous results provide insight on aspects to consider when designing and managing rural water supply systems to achieve the goals promoted by the MUS approach:
From the perspective of designing, this study offers evidence on the fact, that in rural areas, household size is not necessarily the key variable and thus, should not be the only criteria to plan rural water systems when looking for promoting sustainable livelihoods. This idea has been advocated by MUS promoters, by stating the need for responsive planning and design of services, based on a thorough understanding of people's livelihoods and assessing the range of water needs in collaboration with end users, translating those needs into water demand characteristics (e.g. Moriarty y Butterworth, 2003; Van Koppen and Smits, 2010). Particularly, gravity fed systems with household connections have been considered the systems that hold most promise for MUS for their ability to allow sufficient water at very limited costs, compared to systems supplied by groundwater or where water is distributed through communal standpipes (Smits et al., 2010a). Gravity fed systems are the most common systems in rural mountainous regions in Colombia, therefore, in these regions, there would be significant potential to contribute to rural people livelihoods through MUS.
Looking at management aspects, MUS possess challenges to account for diversity in water demands as result of diverse livelihoods to ensure equitable sharing (Van Koppen et al., 2009). Some rules developed by communities in planned-MUS are: prioritize water access for small users over large users; prioritize particular uses; set limits to diameters in household connections, among others. The need for external support to local communities for implementing these rules has been emphasized and it is considered a more difficult task to undertake in de facto MUS compared to planned-MUS (Smits et al., 2010a). In this case study (de facto MUS), the correlation between livestock keeping and water consumption require water managers to work with customers and staff from other sectors (e.g. extension personal from agricultural agencies) to adopt efficient water use strategies that help customers with livelihoods with higher water demand to reduce pressure over the system.
In the present case, internal regulations are also needed for the size of storage tanks to avoid that some customers with large tanks jeopardize access to water for other customers. As it was shown, 20 customers from cluster 1 have almost the same water storage capacity than 103 customers from cluster 2. This large storage capacity from some may be a possible cause for the service intermittence, and thus, a threat for the system as a whole, and especially for those that are not able to build big storage tanks to ensure their water needs.
While these aspects may be valid for MUS in areas where rainfed agriculture predominates, such as this case, the aspects discussed may become more relevant in places where the climate conditions and crops selected by people require supplemental irrigation in some periods during the year. In this situation, an expected higher water demand may require more advanced designs and stronger cross-sectoral and interdisciplinary work.
Identifying key variables which influence water demand in a MUS, and characteristics of groups of customers, are inputs to design fair differential tariffs. As the results show, customers of rural water supply systems are different, and still in rural systems flat tariffs are common, which discourage efficient use of water and contribute to inequities, especially in conditions where water is scarce. The different livelihood practices within a community and their associated water consumption levels should be transparent for all the costumers and discussed to adopt managerial decisions, including tariff systems (Van Koppen et al., 2009). Having differentiated charges, according to consumers' productive activities, their scale, and other socioeconomic variables contributes to sustainability and equity. Different tariff systems are suitable for multiple uses, such as volumetric pricing, block tariff and cross-subsidies. Volumetric tariffs are an option when there is a differentiated demand, and the operational costs increase according to provided water volumes (Van Koppen et al. , 2009). However, they require managerial capacity; including covering the upfront costs of meters, an organization for billing and collection, maintenance and replacement of the meters. In this case, despite the fact, there is a differentiated demand and an organization in charge of billing and collection, the ability for maintenance of meters is in doubt since 23% (117/437) of the meters were not working properly. A further study could assess whether the tariff structure is fair and allow financial sustainability.
The information and methodology in this study contributes to improve understanding of MUS and suggests some ideas to design and manage those systems. However, the study has some limitations. First, it was not possible to introduce the variable income within the analysis, due to a high non-response rate for this variable. Second, no information was elicited to identify whether the tariff was a variable of importance in the system, since this variable may be a constraint to access, especially in the case of households with lower income levels and lower water consumption. While these limitations do not undermine the validity of this study, further research can be done, including together with aspects of livelihoods and access to water, income and tariff variables to analyze their relation to water consumption in MUS.
Conclusions
This study identified the relation between 10 variables related to livelihoods, access to water, and water consumption in a de facto MUS, serving a rural area in Colombia. The outcome showed strong relations between household water consumption, homestead area, storage capacity and cows units, and no relation between household water consumption and household size. These results highlight the need to avoid using household size as the most important variable for designing rural water supply systems, since the water needs of rural people are diverse and cannot be addressed under urban perspectives, if systems are expected to be sustainable and to contribute to people's livelihoods.
The study identified two types of customers with significant statistical differences for the variables: household water consumption, homestead area, storage capacity, cows units and frequency of service. Customers with larger water consumption (cluster 1) were less and more heterogeneous compared to customers in cluster 2, which were mostly smallholders with rainfed crops. The diversity of customers in rural water systems not only poses challenges for design, but also for management when looking for fighting poverty and achieving equitable access. In this case, among the managerial strategies to achieve those goals are: differential tariffs according to water use characteristics; regulation of volumes for individual storage tanks; and coordinated work with other sectors, especially extension, to improve water productivity in the livelihoods with higher pressure over water resources.
References
ASHLEY, C. and CARNEY, D. Sustainable livelihoods: Lessons from early experience. London: DFID, 1999. [ Links ]
BOELEE, E.; LAAMRANI, H. and VAN DER HOEK, W Multiple use of irrigation water for improved health in dry regions of Africa and South Asia. Irrigation and Drainage. 2007, vol. 56, no. 1, pp. 43-51. [ Links ]
DÍAZ L. G. Estadística multivariada: inferencia y métodos. Bogotá: Universidad Nacional de Colombia, 2002. [ Links ]
DOMÍNGUEZ, I. Balancing consumption and availability in a MUS system, Unpublished MSc. Report, Water, Engineering and Development Centre (WEDC), Loughborough University, Loughborough, UK, 2010. [ Links ]
FERNÁNDEZ, P Determinación del tamaño muestral [documento en línea]. 2011. <http://www.fisterra.com/mbe/investiga/9muestras/9muestras.asp> [Cited 22-06-2010] [ Links ].
HADJER, K. ; KLEIN, T. and SCHOPP, M. Water consumption embedded in its social context, north-western Benin. Physics and Chemistry of the Earth, Parts A/B/C, 2005, vol. 30, no. 6-7, pp. 357-364. [ Links ]
HANSEN, S. and BHATIA, R. Water and poverty in a macro-economic context. New York: United Nations, 2004. [ Links ]
HAUGHTON, J. and KHANDKER, S. R. Handbook on poverty and inequality. Washington D.C.: World Bank, 2009. [ Links ]
KATSI, L.; SIWADI, J.; GUZHA, E.; MAKONI, F. S. and SMITS, S. Assessment of factors which affect multiple uses of water sources at household level in rural Zimbabwe - a case study of Marondera, Murehwa and Uzumba Maramba Pfungwe districts'. Physics and Chemistry of the Earth. 2007, vol. 32, no. 15-18, pp. 1157-1166. [ Links ]
MIKHAIL, M. Opportunities revealed by the Nepal multiple use water services experience, Waterlines. 2010, vol. 29, no. 1, pp. 21-36. [ Links ]
MORIARTY, P. and BUTTERWORTH, J. The productive use of domestic water supplies: how water supplies can play a wider role in livelihood improvement and poverty reduction. Delft, Netherlands: International Water And Sanitation Centre (IRC), 2003. [ Links ]
OSPINA, A. Propuesta para incorporar dotaciones de agua para actividades agropecuarias a pequeña escala al acueducto La Palma-Tres Puertas. Undergraduate research project, Sanitary and Environmental Engineering. Universidad del Valle, Cali, Colombia. [ Links ]
OUYANG, Y. Evaluation of river water quality monitoring stations by principal component analysis. Water Research. 2005, vol. 39, no. 12, pp. 2621-2635. [ Links ]
PARDO, C. E. and DEL CAMPO, P. C. Combinación de métodos factoriales y de análisis de conglomerados en R: el paquete factoclass. Revista Colombiana de Estadística. 2007, vol. 30, no. 2, pp. 231-245. [ Links ]
PEDEN, D.; TADESSE, G.; MISRA, A. K.; AWAD AMED, F.; ASTATKE, A.; AYALNEH, W.; HERRERO, M.; KIWUWA, G.; KUMSA, T.; MATI, B.; MPAIRWE, D.; WAS-SENAAR, T.; YIMEGNUHAL, A. Water and livestock for human development. In MOLDEN, D. (ed.). Water for food water for life, a comprehensive assessment of water management in agriculture. Earthscan, London: UK, 2007. [ Links ]
PENA, D. Análisis de datos multivariados. Madrid: McGraw Hill, 2002. [ Links ]
PÉREZ DE MENDIGUREN CASTRESANA, J. C. 'Productive uses of water at the household level: evidence from Bushbuckridge, South Africa'. In MORIARTY P.; BUTTERWORTH, J. and VAN KOPPEN, B. (eds.). Beyond domestic: case studies on poverty and productive uses of water at the household level. Delft, The Netherlands: International Water And Sanitation Centre (IRC), 2004. [ Links ]
SENZANJE, A.; BOELEE, E. and RUSERE, S. Multiple use of water and water productivity of communal small dams in the Limpopo basin, Zimbabwe'. Irrigation and Drainage Systems. 2008, vol. 22, no. 3-4, pp. 225-237. [ Links ]
SMITS, S.; VAN KOPPEN, B.; MORIARTY, P and BUTTERWORTH, J. Multiple-use services as an alternative to rural water supply services: a characterisation of the approach', Water Alternatives. 2010a, vol. 3, no. 1, pp. 102-121. [ Links ]
SMITS, S.; MEJÍA, T.; RODRÍGUEZ, S. E. and SUAZO, D. Effects of multiple-use of water on users' livelihoods and sustainability of rural water supply services in Honduras. Waterlines. 2010b, vol. 29, no. 1, pp. 37-51. [ Links ]
UN. Johannesburg Declaration on Sustainable Development. United Nations, Johannesburg, 2002. <http://www.un.org/esa/sustdev/documents/wssd_poi_pd/english/poi_pd.htm> [consulta: 19-11-2009] [ Links ].
UNDP Human Development Report 2003: Millennium Development Goals: a compact among nations to end human poverty. New York: United Nations Development Programme, UNDP, 2003. [ Links ]
UNDP Human Development Report 2006: Beyond scarcity: power, poverty and the global water crisis. New York: United Nations Development Program, UNDP, 2006. [ Links ]
UPADHYAY, B. Gendered livelihoods and multiple water use in north Gujarat. Agriculture and Human Values. 2005, vol. 22, no. 4, pp. 411-420. [ Links ]
VAN HOUWELING, E.; HALL, R.P.; SAKHO DIOP, A.; DAVIS, J. and SEISS, M. The role of productive water use in women's livelihoods: Evidence from rural Senegal. Water Alternatives. 2012, vol. 5, no. 3, pp. 658-677. [ Links ]
VAN KOPPEN, B.; MORIARTY, P. and BOELEE, E. Multiple-use water services to advance the millennium development goals. Colombo Sri Lanka: International Water Management Institute (IWMI), 2006. [ Links ]
VAN KOPPEN, B.; SMITS, S.; MORIARTY, P; DE PENNING VRIES, F.; MIKHAIL, M. and BOELEE, E. Climbing the water ladder: multiple-use water services for poverty reduction. The Hague, The Netherlands: International Water and Sanitation Centre (IRC)-International Water Management Institute (IWMI), 2009. [ Links ]
VAN KOPPEN, B. and SMITS, S. Multiple-use water services: climbing the water ladder, Waterlines. 2010, vol. 29, no. 1, pp. 5-20. [ Links ]
WHO and UNICEF. Progress on sanitation and drinking water: 2012 Update. United States of America: World Health Organization (WHO) and Unicef, 2012. [ Links ]
WILLIS, R. M.; STEWART, R. A.; PANUWATWANICH, K.; WILLIAMS, P. R. and HOLLINGSWORTH, A. L. Quantifying the influence of environmental and water conservation attitudes on household end use water consumption. Journal of Environmental ¡Management. 2011, vol. 92, no. 8, pp. 1996-2009. [ Links ]
WORLD BANK. Global monitoring report: a development emergency. Washington: World Bank Publishers, 2009. [ Links ]
