


Services on Demand
Journal
Article
 English (pdf)
 Article in xml format
 Article references
 Send this article by e-mail
Indicators
-
 Cited by SciELO
 -
 Access statistics
Related links
-
 Cited by Google
 -
 Similars in
SciELO
Similars in
SciELO -
 Similars in Google
Share

 Permalink
Ingeniería y Universidad
Print version ISSN 0123-2126
Ing. Univ. vol.18 no.1 Bogotá Jan./June 2014
Analysis and Detection in V-Formations with Outliers1
Análisis y detección de formaciones en V con individuos atípicamente separados2
Francisco Moreno Arboleda3
Jaime Alberto Guzman Luna4
Sebastian Alonso Gómez Arias5
1Reception date: May 3th, 2013. Acceptance date: February 13, 2014. This article derived from Apoyo al Grupo de Sistemas inteligentes Web-Sintelweb project. National call Apoyo para el Fortalecimiento de Grupos de Investigación o Creación Artística que Soporten Programas de Posgrado from National Colombia University, 2012, code 205010011129, developed by the research group Sistemas Inteligentes Web (Sintelweb), from National Colombia University, Medellin, Colombia.
2Fecha de recepción: 3 de mayo de 2013. Fecha de aceptación: 13 de febrero de 2014. Este artículo se deriva del proyecto Apoyo al Grupo de Sistemas inteligentes Web-Sintelweb, convocatoria nacional Apoyo para el Fortalecimiento de Grupos de Investigación o Creación Artística que Soporten Programas de Posgrado de la Universidad Nacional de Colombia, 2012, modalidad única, código 205010011129, desarrollado por el grupo de investigación Sistemas Inteligentes Web (Sintelweb), de la Universidad Nacional de Colombia, Medellín, Colombia.
3Systems Engineer, Universidad de Antioquia, Medellín, Colombia. Master's Degree in Systems Engineering, Universidad Nacional de Colombia, Medellín, Colombia. Doctor in Systems Engineering, Universidad Nacional de Colombia. Associate Teacher at Universidad Nacional de Colombia. E-mail: fjmoreno@unal.edu.co.
4Civil Engineer, Universidad Nacional de Colombia, Medellín, Colombia. Specialist in Educational Communication, Universidad de Pamplona, Pamplona, Colombia. Master's Degree in Systems Engineering, Universidad Nacional de Colombia. Doctor in Systems Enginnering, Universidad Nacional de Colombia. Associate Teacher at Universidad Nacional de Colombia, Medellín, Colombia. E-mail: jaguzman@unal.edu.co.
5Systems and Infomation Technologies Engineer, Universidad Nacional de Colombia, Medellín, Colombia. Master's Degree Candidate in Systems Engineering at Universidad Nacional de Colombia. E-mail: seagomezar@unal.edu.co.
Abstract
A diversity of movement patterns may be identified when studying a set of moving entities. One of these patterns is called V-formation since its shape resembles such letter. Informally, a set of entities shows a V-formation if they are located in one of its two characteristic lines. In this paper, we propose a model for identifying V-formations with outliers in a list of moving entities. An outlier is an entity of the formation that is apart from its characteristic lines. We present the formal rules of our model and an algorithm for detecting outliers. Our model was validated in NetLogo, a programming and modeling environment for simulating natural and social phenomena.
Keywords: Moving objects, movement patterns, V-formation, outliers.
Keywords plus: Outlier, movement patterns, V training, atypically separated values.
Resumen
Una gran variedad de patrones de movimiento puede ser identificada cuando se estudia un conjunto de entidades móviles. Uno de estos patrones se denomina formación en V, ya que su forma se asemeja a dicha letra. Informalmente, un conjunto de entidades exhibe una formación en V si está ubicado en una de sus dos líneas características. En este artículo se propone un modelo para identificar formaciones en V con outliers en una lista de entidades móviles. Un outlier es una entidad de la formación que está separada de sus líneas características. Se presentan las reglas formales del modelo y un algoritmo para la detección de este tipo de entidades. El modelo se validó mediante NetLogo, un ambiente de programación y de modelamiento para simular fenómenos naturales y sociales.
Palabras clave: Objetos móviles, patrones de movimiento, formación en V, valores atípicamente separados.
Palabras clave descriptores: Valor atípico, patrones de movimiento, formación en v, valores atípicamente separados.
DOI:10.11144/JAVERIANA.IYU18-1.ADFV
Introduction
A diversity of movement patterns may be identified when studying a set of moving entities, for example, a flock of birds (Dodge et al., 2008). One of these patterns is called V- formation since its shape resembles such letter. Informally, a set of entities shows a V- formation if they are located in one of its two characteristic lines. The lines converge in a position where a unique entity is located, being this one considered the leader of the formation (Cativelli and Sayed, 2009).
Several authors have analyzed this type of formations. Seiler et al. (2002) and Sewatkar et al. (2010) try to explain, from a physical point of view, the reasons why some species of birds such as Canada Goose (Branta canadensis), Red Knot (Calidris canutus) and the Dunlin (Calidris alpina), tend to fly this way.
Other authors try to simulate this type of formations to a computational level. For example, Nathan and Barbosa (2008) propose a model based on rules which allow the generation of V- formations according to determined parameters. The authors validated the mentioned model in NetLogo (Wilensky and Rand, 2007), a programming and modeling environment for simulating natural and social phenomena.
On the other hand, Andersson et al. (2007) provides a model to identify the leader entity in a group of moving entities. However, his model is not appropriate to V-formations as it is shown in (Moreno et al., 2012 and 2013). There, Andersson's model is scaled up in order to identify V-formations. Nevertheless, the extended model does not consider entities which are part from the formation, but are apart from its characteristic lines, that is, outliers entities.
In this paper, the model of Moreno et al. (2013) is extended in order to identify V-formations considering the possible presence of outliers. For achieving this goal, a group of formal rules and an algorithm are presented. Besides, the degree of linearity of the formations is analyzed in more detail, an aspect that was not deepened in the original model.
The analysis of this type of formations can be applied in areas such as economics where formations of this type can be presented in stock prices (Rueda, 2005), in zoology to analyze the birds movement (Cativelli and Sayed, 2009), and in the military and video games fields where ships and aircrafts squadrons often adopt this type of formations (Cativelli and Sayed, 2009).
This paper is organized as follows: In section 1, the model of Moreno et al. (2013) is presented to detect aligned V-formations. In section 2, this model is extended to introduce the mechanisms to detect non-aligned V-formations; and then, in section 3, a method to detect outliers in this type of formations is presented. In section 4, experiments are presented, and finally the paper is concluded and future works are proposed.
1. Aligned V-Formations
In this section, the essential elements of the model of Moreno et al. (2013) are presented, which at the same time, are an extension of the models of Andersson et al. (2007) and Moreno et al. (2012).
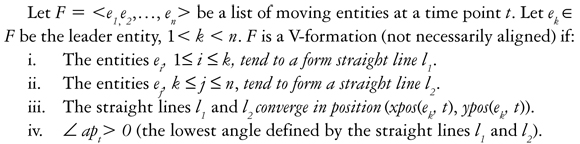
Consider a group E of n entities {e2, e2, ...,en} that moves in a space during a time interval (t1, tf). This space is represented by the Euclidian plane. Furthermore, Ts represents the set of time points {t1, t2, ...,tf}. Every ti ∈ Ts, represents a time-step and corresponds to a time point in which the position of the entities was registered.
The entity coordinates at a time point are given by a couple of functions xpos and ypos, both with signature: E x Ts → Real. It is assumed that between two consecutive time-steps, the entity moves through a straight line and with a constant speed (Behr and Güting, 2005; Cativelli and Sayed, 2009).
Let F = <e2 e2, ...,en> be a list of moving entities at a time point t. Let ek ∈ F be the leader entity where k = [nl2] and let be em ∈ F, 1 ≤ m ≤ n, m ≠ k. The angle between ek and em at t, denoted  , is defined by the line that goes from (xpos(ek, t), ypos(ek, t)) to (xpos(em, t), ypos(em, t)).
 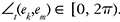 . F is an aligned V-formation at a time point t ∈ Ts if:
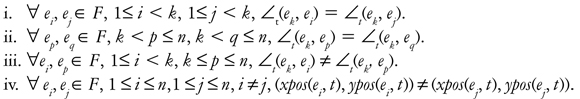
The condition i) states that the angles formed by the leader entity ek and each of the preceding entities must be equal. The condition ii) is analogous and it is applied to every entity succeeding the leader entity ek in the list. The condition iii) establishes that the angles of the conditions i) and ii) must be different. The condition iv) states that two formation entities in the same position cannot exist.
In the original model (Moreno et al. 2013), additional rules to make the model more flexible are introduced: i) allow the number of entities in every formation line not to be necessarily equal, ii) limit the distance between entities, iii) limit the opening angle of the formation, and iv) limit the entities orientation regarding the direction of the leader entity. Besides, some incipient elements which lead to model V-formations not necessarily aligned are presented. The following section is focused on this aspect.
2. Not Necessarily Aligned V-Formations
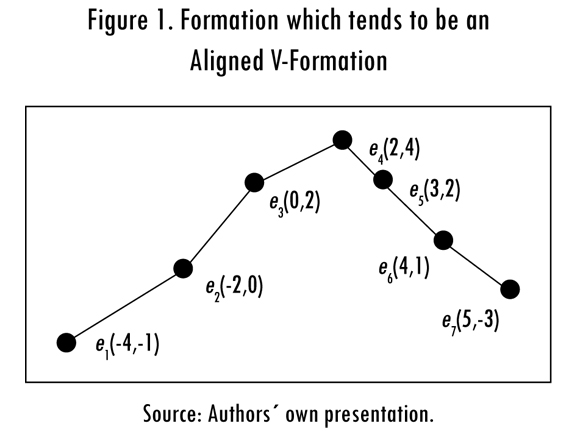
Consider Figure 1, a formation without aligned entities is observed; however, this formation tends to show a configuration in V. Consequently, the previous section conditions are extended in order to identify and consider this type of formations as V-formations.
Regarding the conditions i) and ii), to state if a set of entities tend to form a straight line, the Pearson's correlation coefficient r (Calderon and Sherry, 2011) is used. Thus, given a set of points {(x1,y1), (x2,y2), ...,(xn, yn)}, r indicates how much these points fit a straight line (degree of linearity). r ∈ (-1, 1), if |r|≈1 data then tend to form a straight line. r is calculated as shown in the equation (1).
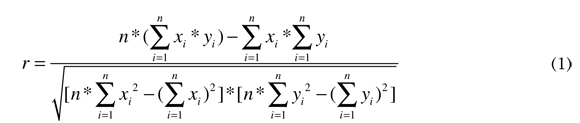
It can be specified a threshold h to indicate the degree of linearity required to the formation lines, that is, |r|≥ h.
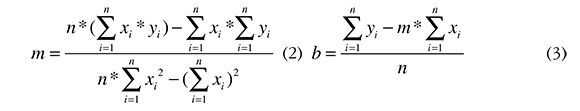
Consider a set of points {(x1, y1), (x2, y2), ...,(xn, yn)} that represents the positions of the entities of a characteristic line at a time point. To obtain the equation of the straight line y = mx + b that best fits this set of points we can apply equations (2) and (3).
In Table 1, the results for the formation of Figure 1 are presented.

Regarding the condition iv),  it is calculated as follows: the straight lines li and l2 of the formation are obtained, and the lower angle among them is obtained like this: let a be the angle of the leader entity towards l1, b the angle of the leader entity towards l2 and w = | a-b |, then
 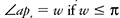 and
and 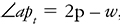 , otherwise. To illustrate this a = 40.36, b = 294.44 and w = 254.08; therefore,
  .
.
3. Outliers
There exist groups of entities that, although tending to show a V-formation, can have distant entities from its characteristic straight lines at a time point t and; therefore, they affect Pearson's coefficient. These entities are called outliers (Hawkins, 1984; Ben-Gal, 2005).
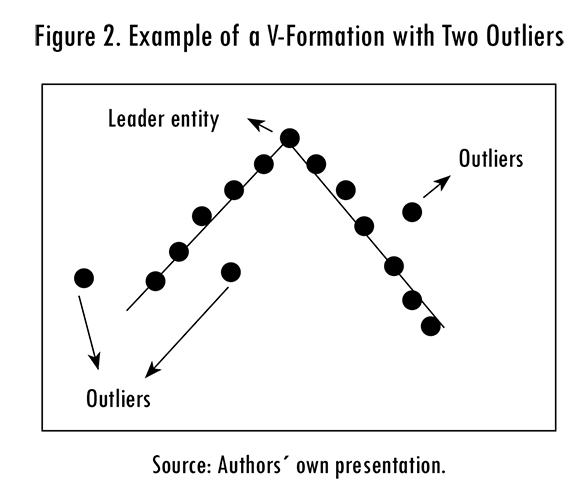
There are numerous methods to detect outliers in different fields (Papad-imitriou, 2003). Consequently, an algorithm, that receives a set of entities m (lineMembers array) forming a characteristic straight line of a formation at a time point t, is presented. The algorithm determines if when removing a maximum number of entities from the group, the Pearson's coefficient exceed a given threshold μp. For instance, if a maximum of two entities are taken away from a straight line of the formation, the entities from Figure 2 are considered to show a V-formation which has two outliers in one straight line and one outlier in the other one. The algorithm then receives the minimum value from the Pearson's coefficient μp and the maximum percentage of entities (percentageOutliers) that can be taken away from the group of entities. This percentage is calculated considering the total number of entities m.

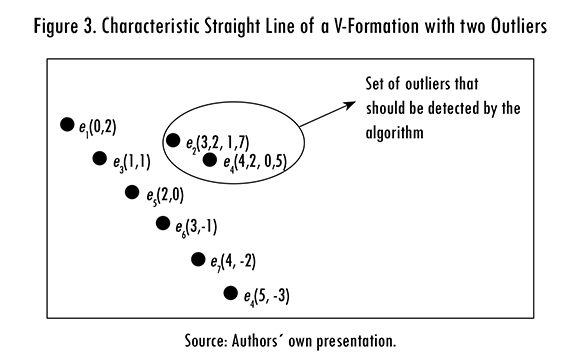
Example: Consider the set of entities from Figure 3 which form a straight line if the entities e 2and e4 are not considered, that is, e2 and e3 are outliers.
Input parameters of the algorithm:
lineMembers = [e1, e2, ..., e8], μp = 0.99 and percentageOutliers = 30%. So maxOutliers = [8*0.3] = [2.4] = 3, that is, a maximum of three outliers in the array of the entities is allowed.
The algorithm calculates all the combinations of 1 element in 8. In Table 2, each of the generated combinations are shown, the contents of the auxMembers array and the value of Pearson's coefficient (newPearson) corresponding the positions of the entities of such array.
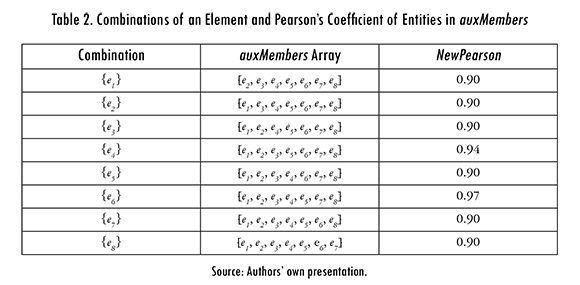
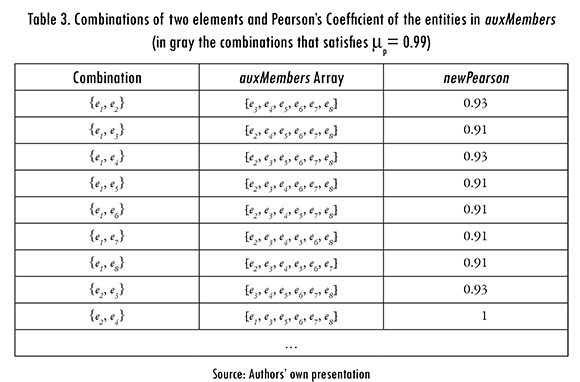
In the absence of a value of newPearson which meets the threshold μp = 0.99, see Table 2, the algorithm calculates all the combinations of 2 elements in 8. The results are shown in Table 3. When the algorithm evaluates the combination {e2, e4}, the auxMembers array = {e1, e3, e5, e6, e7, e8} and newPearson = 1. As this value is higher than the required threshold (μp = 0.99), the algorithm determines that the entities e2 and e4 are outliers. It is then concluded that the entities e1, e3, e5, e6, e7, and e8 , tend to form a straight line with a Pearson's coefficient over 0.99.
4. Experiments
For the experiments, NetLogo was used to allow the exploration of the relationship between the behavior at a micro level of the individuals and the patterns at a macro level of the groups, an approach followed in previous works (Andersson et al., 2007; Miller et al., 2010). A model by (Nathan and Barbosa, 2008) was used, which was conceived specifically to generate V-formations in NetLogo.
A population of 15 moving objects was used. The dimensions of the space were (-35, 35) for both axis x and axisy. To create V-formations, parameters of the Table 4 were used. These parameters allow defining aspects related to speed, visual range, and the proximity of the entities. Furthermore, these parameters manage to stabilize the creation of V-formations within a reasonable amount of time (around 4000 ticks) since such model requires a stabilizing time. A tick is the time unit in NetLogo, and at a normal speed it is equivalent to 0.5 seconds; however, in Netlogo it is possible to change and program the speed, this is why the value in seconds of a tick is relative.
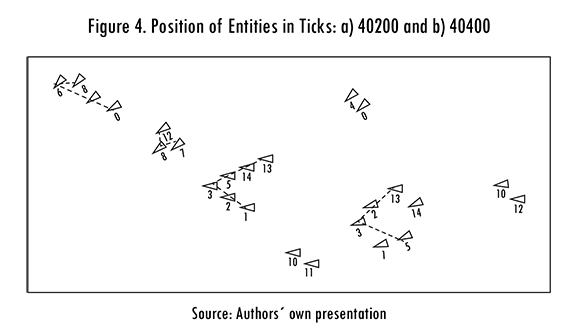
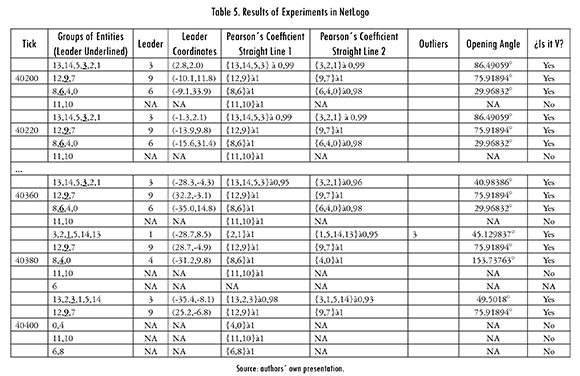
The experiments started from tick 40199 and finished in tick 40400 (for this moment, the model that generates V-formations in NetLogo had already been stabilized). The time-steps were taken at 20 ticks intervals, because if we considered a shorter step, it will become practically imperceptible to the change of position and direction of the entities. Thus, the total number of steps was 10. In Figure 4, the position of objects in ticks 40200 and 40400 is shown, and in Table 5 the results are summarized.
In accordance with the results of Table 5, the algorithm classified several groups of entities as V-formations. These results are in accord with what was expected since it was supposed that the model of Nathan & Barbosa (2008) had been already stabilized; and that V- formations were effectively been generated at that moment. Besides, only in one tick (in the tick 40380, for formation 1) it was required to apply the algorithm of detection of outliers (μ > 0.92 and percentageOutliers < 4). On the other hand, it was found that the formations present a high degree of linearity since the Pearson's coefficients, in all cases, were higher than 0.92.
Conclusions and Future Works
In this paper, a formal model to identify V-formations with outliers was proposed. The model considers the location of the entities in order to determine if they constitute this type of formations. The rules of the model are flexible since they allow V-formations that are not necessarily aligned as it is in the real world. In addition, the possible presence of outliers entities was considered, that is, members of the formation that can be apart from its characteristic lines. For this reason, an algorithm, where the analyst can specify the maximum number of allowed outliers and the required degree of linearity, was presented. The model was validated using the programming environment NetLogo. The results demonstrate the validity of the proposed model since it was possible to identify the V formations generated by NetLogo.
Concerning future works, we plan to apply our model to the stock market where formations of this type are presented (Rueda, 2005). We also plan to extend our model to identify other kinds of patterns, for instance, identifying isolated entities, which are entities that although being considered members of a group, they follow their own way and do not have any influence over the other entities (Laube and Imfeld, 2002); convergence, that is, to identify a set of entities which converge or get closer to a site; divergence, that is, to identify a set of entities that are spread-out from a site (Gudmundsson et al., 2004), and self-organization, that is, a set of entities moving in groups without a leader entity (Cañizo et al., 2010) or that the members do not recognize the leader (Zongyao and Dongbing, 2007; Su et al., 2013).
References
ANDERSSON, M. et al. Reporting leadership patterns among trajectories. Proceedings of the 2007 ACM Symposium on Applied Computing. ACM, 2007, pp. 3-7. [ Links ]
BEHR, T. and GUTING, R. H. Fuzzy spatial objects: An algebra implementation in Secondo. Proceedings of the International Conference on Data Engineering. IEEE Computer Society Press. 1998, 2005, p. 1137. [ Links ]
BEN-GAL, I. Outlier detection. In Data mining and knowledge discovery handbook. New York: Springer, 2005. [ Links ]
CALDERÓN-MEZA, G. and SHERRY, L. Adaptive agents in NAS-wide simulations: A case-study of CTOP and SWIM. Integrated Communications, Navigation and Surveillance Conference (ICNS). 2011, pp. F6-1-F6-13. [ Links ]
CAÑIZO, J. A.; CARRILLO, J. A. and ROSADO, J. Collective behavior of animals: Swarming and complex patterns. Arbor, 2010, vol. 186, pp. 1035-1049. [ Links ]
CATTIVELLI, F. and SAYED, A.H. Self-organization in bird flight formations using diffusion adaptation. Computational Advances in Multi-Sensor Adaptive Processing (CAMSAP), 2009 3rd IEEE International Workshop, 2009. p. 49-52. [ Links ]
DODGE, S.; WEIBEL, R. and LAUTENSCHÜTZ, A. K. Towards a taxonomy of movement patterns. Information Visualization. 2008, vol. 7, nos. 3-4, pp. 240-252. [ Links ]
GUDMUNDSSON, J. ; VAN KREVELD, M. and SPECKMANN, B. Efficient detection of motion patterns in spatio-temporal data sets. Proceedings of the 12th annual ACM international workshop on Geographic information systems.ACM, 2004, pp. 250-257. [ Links ]
HAWKINS, D.M.; BRADU, D. and KASS, G.V. Location of several outliers in multiple-regression data using elemental sets. Technometrics. 1984, vol. 26, no. 3, pp. 197-208. [ Links ]
LAUBE, P. and IMFELD, S. Analyzing relative motion within groups of trackable moving point objects. In Geographic information science. Berlin: Springer, 2002. [ Links ]
MILLER, B.W et al. Using stylized agent-based models for population-environment research: a case study from the Galápagos Islands. Population and Environment. 2010, vol. 31, no. 6, pp. 401-426. [ Links ]
MORENO, F. ; GOMEZ, S. and ECHEVERRY, J. Análisis y detección de formaciones en V [technical report]. Medellín: Universidad Nacional de Colombia, 2013. [ Links ]
MORENO, F.M.; DUITAMA, J.F. and OSPINA, E.C. A method for estimating the position and direction of a Leader. Revista Facultad de Ingeniería Universidad de Antioquia. 2012, no. 62, pp. 11-20. [ Links ]
NATHAN, A. and BARBOSA, VC. V-like formations in flocks of artificial birds. Artificial Life. 2008, vol. 14, no. 2, pp. 179-188. [ Links ]
PAPADIMITRIOU, S. et al. Loci: Fast outlier detection using the local correlation integral. Proceedings of 19th International Conference on Data Engineering, 2003, pp. 315-326. [ Links ]
RUEDA, A. Para entender la bolsa: financiamiento e inversión en el mercado de valores. Madrid: Thomson, 2005. [ Links ]
SEILER, P.; PANT, A. and HEDRICK, K. Analysis of bird formations. Proceedings of the 41st IEEE Conference on Decision and Control, 2002, pp. 118-123. [ Links ]
SEWATKAR, C. M.; SHARMA, A. and AGRAWAL, A. A first attempt to numerically compute forces on birds in V formation. Artificial Life. 2010, vol. 16, no. 3, pp. 245-258. [ Links ]
SU, H. et al. Adaptive flocking with a virtual leader of multiple agents governed by locally Lipschitz nonlinearity. Nonlinear Analysis: Real World Applications. 2013, vol. 14, no. 1, pp. 798-806. [ Links ]
WILENSKY, U. and RAND, W. Making models match: Replicating an agent-based model. Journal of Artificial Societies and Social Simulation. 2007, vol. 10, no. 4, p. 2. [ Links ]
ZONGYAO, W. and DONGBING, G. Behaviour based fuzzy flocking systems. Proceedings of the IEEE International Conference on Fuzzy Systems. 2007, pp. 1-6. [ Links ]
