


Services on Demand
Journal
Article
 English (pdf)
 Article in xml format
 Article references
 Send this article by e-mail
Indicators
-
 Cited by SciELO
 -
 Access statistics
Related links
-
 Cited by Google
 -
 Similars in
SciELO
Similars in
SciELO -
 Similars in Google
Share

 Permalink
Ingeniería y Universidad
Print version ISSN 0123-2126
Ing. Univ. vol.18 no.2 Bogotá July/Dec. 2014
https://doi.org/10.11144/Javeriana.IYU18-2.ifcd
Influence of the Flow Control (Declining Rate - Constant Rate) on the Filtration Process in Drinking Water Treatment1
Influencia del control de flujo (tasa declinante y tasa constante) sobre el proceso de filtración en el tratamiento de agua potable2
Lina M. Perea-Torres3
Patricia Torres-Lozada4
Camilo H. Cruz-Vélez5
1Reception date: April 25th, 2014. Acceptance date: July 31st, 2014. This article is derived from the research project Identification, evaluation and management of risk in the drinking water supply system of the low network of the city of Cali, framed in a Water Safety Plan (WSP), developed by the research group Estudio y Control de la Contaminacion Ambiental.
2Fecha de recepción: 25 de abril de 2014. Fecha de aceptación: 31 de julio de 2014. Este artículo se deriva de un proyecto de investigación denominado Identificación, evaluación y manejo del riesgo en el sistema de abastecimiento de agua potable de la red baja de la ciudad de Cali, enmarcados en un Plan de Seguridad del Agua (PSA), desarrollado por el grupo de investigación Estudio y Control de la Contaminación Ambiental de la Universidad del Valle, Cali, Colombia.
3Ingeniera sanitaria, MSc., Universidad del Valle, Cali, Colombia. Miembro del Grupo de Investigación Estudio y Control de la Contaminación Ambiental (ECCA), Escuela EIDENAR, Universidad del Valle. E-mail: linapeto@gmail.com
4Ingeniera sanitaria, Universidad del Valle, Cali, Colombia. MSc. and PhD, Universidad de São Paulo, Brasil. Profesora titular, Grupo de Investigación Estudio y Control de la Contaminación Ambiental (ECCA), Escuela EIDENAR, Universidad del Valle. E-mail: patricia.torres@correounivalle.edu.co
5Ingeniero Sanitario, Universidad del Valle, Cali, Colombia. MSc., Universidad de São Paulo, Brasil. Profesor asociado, Grupo de Investigación Estudio y Control de la Contaminación Ambiental (ECCA), Escuela EIDENAR, Universidad del Valle. E-mail: camilo.cruz@correounivalle.edu.co
How to cite this article
PEREA-TORRES, L.; TORRES-LOZADA, P., and CRUZ-VÉLEZ, C. Influence of the Flow Control (Declining Rate - Constant Rate) on the Filtration Process in Drinking Water Treatment. Ingeniería y Universidad. 2014, vol. 18, no. 2, pp. 21 7-234. http://dx.doi.org/10.11144/Javeriana.IYU18-2.ifcd
Abstract
Quick filtration is an important and complex process within the conventional treatments of water purification, since it is the final physical barrier to retain particles and control the microbiological risk. This study evaluated the influence of flow control on the filtration process of the clarified water of the Cauca River on the city of Cali — Colombia (Puerto Mallarino Water Treatment Plant) at pilot scale. Operation's results of the pilot plant on a declining rate condition were compared with the results of the previous operation at constant rate; the operational control variables of the filters were turbidity of the filtered water and load loss. In general, the declining rate operation allowed a better performance of filters, resulting in a lower turbidity in filtered water during the period of maximum efficiency and a better outcome of the load loss, behavior that is associated with a better distribution of solids on the filter media, which allows to reduce the risk of transfer of particles through the filter.
Keywords: career of filtration; filtration; load loss; constant rate; declining rate
Resumen
La filtración rápida es un proceso complejo e importante dentro de los tratamientos convencionales de agua para potabilización, ya que es la última barrera física para retener partículas y controlar el riesgo microbiológico. En este estudio se evaluó a escala piloto la influencia del control de flujo en el proceso de filtración del agua clarificada del río Cauca —planta de potabilización Puerto Mallarino de la ciudad de Cali, Colombia—. Los resultados de la operación a tasa declinante se compararon con los resultados de la operación previa de la planta piloto en la modalidad de tasa constante, las variables de control operacional de los filtros fueron turbiedad del agua filtrada y la pérdida de carga. En general, la operación a tasa declinante permitió un mejor desempeño de los filtros, pues se obtuvo una menor turbiedad en el agua filtrada durante el periodo de máxima eficiencia y una mejor evolución de la pérdida de carga. Tal comportamiento está asociado a una mejor distribución de los sólidos sobre el medio filtrante, lo que permite reducir el riesgo de traspaso de partículas a través del filtro.
Palabras clave: carrera de filtración; filtración; pérdida de carga; tasa constante; tasa declinante
Introduction
The multiple barrier concept is very important on the water treatment for human consumption; it is an integrated system of procedures, processes and tools that brought together prevent or reduce drinking water contamination from the source to the final user, thus affording protection to the general public health. In this framework, each stage of the Drinking Water Supply System (DWSS) represents a barrier in the face of danger with two important benefits: i) It helps to the partial reduction of risk in spite of the lack of total elimination, and ii) the resulting risk as a result of the failure from one of the barriers may be mitigated or eliminated by further barriers (Fournier, 2006; Moreno, 2009; Plummer et al., 2010). The DWSS conception sets the water treatment plant (WTP) as the principal barrier to insure the supply of suitable water from the public health view point (Okun, 2003).
The removal of particulate material (colloidal and suspended solids) in the conventional treatment systems mainly takes place in the stages of sedimentation (with prior coagulation and flocculation) and filtration which is considered one of the particle separation methods most widely used in the drinking water and wastewater treatment (Gao et al., 2012). Filtration is the last physical barrier for the removal of particles, bacteria and protozoa such as Giardia lamblia and Cryptosporidium (Cornwell et al., 2003; Spellman, 2009); additionally, disinfection is the process that complements the removal of the remaining pathogens (Crittenden et al., 2012).
The filtration flow control allows that the total load on the WTP, be fairly distributed among the battery of filters and prevents or reduces preferential flow lines through any of the filters (Cleasby, 1993a). The two flow control methods are the constant rate (CR) and the declining rate -DR (AWWA, 2011). In the CR the intake of water is made for the flow to be fairly distributed among all the filters from a free discharge reservoir; in the DR the flow may be distributed on a continuous or variable manner on this last, placing the intake of the filters below the operational minimum level in order to conduct water through a channel or common pipe operated in the fashion of communicating vessels (Akgiray y Saatçi, 1998; Di Bernardo y Sabogal, 2009) to make each filter work within a variable rate related to the individual level of dirtiness.
In general, the filters that operate under DR are based on the interaction between the lineal non-turbulent friction in the drainage orifice and the laminar and lineal friction in the filtering mechanisms (Cleasby, 1993b). The first one is much more appropriate on clean filters and the second one is the dominant factor at the end of the filtering process when the filtering media is highly obstructed (Escobar, 1992; Mackie et al., 2003).
The DR flow control is commonly used for economical reasons and due to that the quality of the filtered effluent is generally comparable with that of the filters regulated by the flow speed controllers (Dabrowski, 2006). On the design of these filters, a hydraulic load is generally fixed in order to guarantee that the maximum rate will not exceed 1.5 times the medium rate (Di Bernardo y Sabogal, 2009). The frequent cleaning of the battery of filters generates interruptions in the WTP delivering variations in the flow rate and pressure; the DR operation drastically reduces these changes, generating economical benefits through the enhancement of the career of filtration and the reduction of the cleaning frequency (Zielina y Dajbrowski, 2011).
Di Bernardo and Cleasby (1980) and Hilmoe and Cleasby (1986) mentioned by Di Bernardo and Sabogal (2009) observed that either for clarified water in a conventional treatment process or for coagulated water entering to the filters of a direct filtration system, the DR filtration was better than the one under CR because the quality of the filtered water was equal or superior, and there was less hydraulic load needed in the DR filtration.
Baylis (1959) mentioned by Makie et al. (2003) found similar turbidity results in the two types of flow control evaluated (CR and DR) in a WTP in Chicago (coagulated water filtration). Cornwell (1991) mentioned by Makie et al. (2003) found a similar behavior on the filtration of different rates of coagulated water in the reservoir of North Carolina. Makie et al. (2003) modeled the behavior of the flow control methods and found that the loss of the total load was lower in the DR operation for the same duration of career of filtration.
Filtration has been widely studied, but, nonetheless, an analytic model to allow the non-empiric optimization of the process parameters has not been accepted. This, in turn, makes it necessary to perform pilot scale studies because they become a very close form to represent what actually takes place within the filtration units on a real scale and to additionally extrapolate data (Boller and Kavanaugh, 1995; Jegatheesan and Vigneswaran, 2005). The Puerto Mallarino WTP (PM-WTP) in the city of Cali supplies water to 60% of the population of the city (Pérez et al., 2012). This study shows the results of the clarified water filtration on a pilot plant from the PM-WTP operated under the modality of declining rate and the comparison with the operation results under the modality of constant rate.
1. Materials y Methods
1.1. Relationship between Raw and Clarified Water
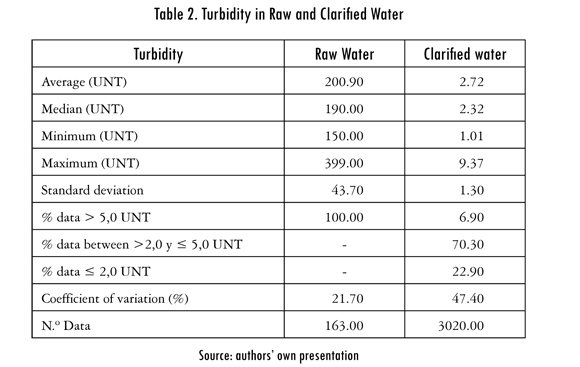
In view that the filtration pilot plant was operated with clarified water from the PM-WTP and given the high variability of the raw water (Montoya et al., 2011), it was considered important to analyze the characteristics of the raw water and its effect on the quality of the clarified water during the filtration assays. This was carried out applying descriptive statistics in the form of averages, medians, maximums, and minimums.
1.2. Description of the Pilot Plant
Figure 1 shows the pilot plant characteristics. The columns are made in acrylic (thickness of 8 mm), internal diameter of 0.134 m, height of 3.75 m and 0.15 m deepness. The columns have a plate with 138 orifices (0.005 diameter) to serve as support to the filtering mechanism and to uniformly distribute the wash water.
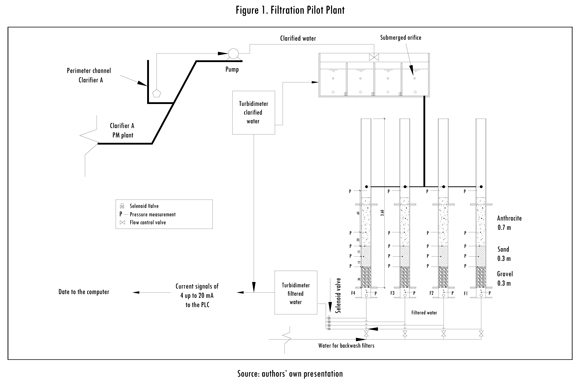
The turbidity was measured with 2 turbidimeters, in line, belonging to the ACCU4 brand with low range (0 to 100 UNT, precision 0.001 UNT). One was used to measure the turbidity of the clarified water and the other was used to measure the turbidity of the filtered water, in both cases through the use of 5 electrovalves that were programmed to control the water pass from each filter to the turbidimeter. The 4 to 20 mA signals used by the turbidimeters to relay the data are captured in a PLC in order to transmit the result to a computer.
The pressure was monitored manually in 6 points of each one of the columns with the support of piezometers installed in each filter. The measuring points was located above the filtering media, the other one below the false bottom and the remaining four were distributed along the filtering bed.
The configuration of the filtering media used was selected in a previous study operating the pilot plant in the modality of constant rate (Perea et al., 2013) showing the following characteristics: double layer media with sand (30 cm thickness, 0.56 mm of effective size, and UC: 1.21), anthracite (70 cm thickness, 1.16 mm of effective size, and UC: 1.41); the gravel support media was composed with the following sizes: 150 mm of 1/8" - #10, 50 mm of 1/4" - 1/8", 50 mm of 1/2" - 1/4" and 50 mm of 3/4" - 1/2".
1.3. Description of the Assays
Before initiating the operation of the filters in the declining rate modality, it was necessary to calculate the levels of operation under which the pilot plant was going to work. Therefore, several assays with treated water from the PM-WTP took place in order to measure the load loss due to the accessories and the filtering media. With this information and with the medium rate of the filters from the PM-WTP plant, was determined the system losses load using the Equation 1, and, thereafter, with the use of the model proposed by Di Bernardo (1986) mentioned by Di Bernardo and Sabogal (2009) were calculated the levels of water and operation rates at declining rate modality.
Y = 8.92 10-7 T2 + 0.001869T (Equation 1)
Where:
Y= total load loss (m)
T= filtering rate (m3.m-2.day-1)
The behavior of the level of water (hydraulic load) in the common intake channel, the filtration rate, and the turbidity of the filtered water was measured during the operation of the system in stability conditions. The levels of water obtained in the common intake channel were: level when a clean filter enters in operation (N1): 0.63 m; level when a filter must be washed (N2): 0.80 m; and level when there is a filter out of operation because it is being washed (N3): 0.98 m. The operation rates on the filter sare shown on Table 1.
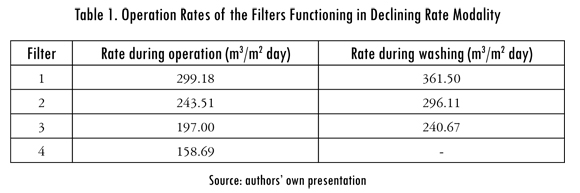
The start of operation in the declining rate modality of the four filters of the pilot plant was performed in a simultaneous manner and the washing of each filter was carried out every six hour during the first 24 h in agreement with the recommendations from Di Bernardo and Sabogal (2009) for the start of the system in a decreasing modality.
After these escalated washings were finished, the system was operated until the level of water in the common intake channel reached N2, and then the filter with more operating hourswas washed. Every time that N2 was reached in any filter, the same procedure was performed and this period was denominated as cycle, the assays took place until 8 functioning cycles were completed.
1.4. Definition of Operating and Hydraulic Control Variables
It was defined for the assays that each career of filtration would finish whenever the turbidity of the filtered water became superior to 0.7 UNT (USEPA, 2004), or the reached load loss (LL) became greater to 1.5 m, or the time of the filtration operation reached 72 h in agreement with the recommendations of AWWA (2011) and Arboleda (2000). The washing of each filter took place generating a 30% expansion of the media during the required time to reach turbidity values in the washing water below 5.0 UNT (Cruz, 1993), this was guaranteed through taking measurements of turbidity in water samples coming from the wash.
The response variable used was the turbidity of the filtered water that was measured every 11.6 min in the filtered water and every 10 s in the clarified water determined as control parameter. Additionally, the measurement of the LL was made every 3 h during the maximum efficiency stage and a measurement of the water level in the common pipe every 10 min was carried out as well.
1.5. Evaluation of the Influence of the Flow Control on the Performance of Filtration
A comparative analysis of the two flow control modalities (Declining Rate and Constant Rate) was made taking into account that the pilot plant was previously operated in the constant rate modality and with the same configuration of the filtering media (Perea et al., 2013). The comparative analysis was based on the results of turbidity in the filtered water during the maximum efficiency periods of the filters, which was defined as the immediate following period after the maturity period (AWWA, 2011) when turbidities below 0.3 UNT were reached until attaining 72 h of filtration process (AWWA, 2011; Arboleda, 2000) or until the turbidity of the filtered water reached again values of 0.3 UNT.
2. Results and Analysis
2.1. Relationship between Raw and Clarified Water
Table 2 shows the behavior of the turbidity in the raw water that accessed the plant PM during the study and the clarified water produced by the same. The table shows that the clarification process of the plant is very efficient in terms of removal of particulate material because a significative reduction of the turbidity is reached with values in the clarified water below 5 NTU during 93% of the time in spite of the high variation of the turbidity in raw water. These values are considered adequate by Renner and Hegg (1997) that establishes 1 NTU as the objective average value and a maximum of 5 NTU, and they are comparable with the results reported by Perea et al. (2013) in the operation of the pilot plant in the modality of constant rate.
2.2. Operation in Declining Rate
The start-up of the system had an approximate duration of 72 h, allowing to reach a N2 level where the operation in a declining rate was begun. Figure 2 shows the behavior of the water level (hydraulic load) in the common intake channel, the rate of filtration, and the turbidity of the filtered water during the operation of the system in stable conditions.
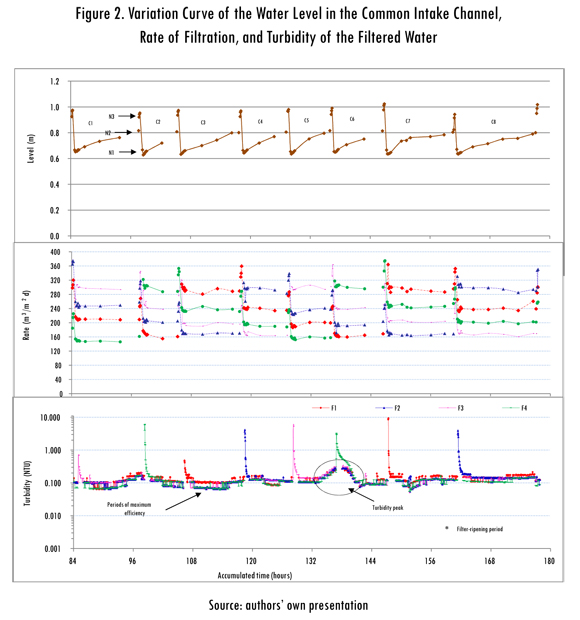
Figure 2 shows that at the time that the assays ended, some filters had not finished the career of filtration. This is related to the operation in a declining rate condition, because all the filters work with a difference in the time of operation that allows one filter to finish the career of filtration while the others continue to operate (AWWA, 2011).
With relations of the levels of operation of the system, experimental similar values were obtained to the theoretical ones calculated under the model of Di Bernardo (1983) mentioned by Di Bernardo and Sabogal (2009), where the major differences founded were in the levels N3 (not greater than 6%) that can be related to slight variations in the operation parameters such as the average rate of intake or the uncertainty in the measuring scale on the measurements taken on the water level.
On the filtration rate is observed that the filtration rate varies from one filter to another according to the level of filter clogging, becoming lower for the dirtiest one as presented by Di Bernardo and Cleasby (1980); de Souza (1990) and Teixeira (1991) mentioned by Escobar (1992). An experimental comparison of the average filtration rates in each filter (approximately 160, 200, 240 and 290 m3/m2 day) found them to coincide with the theoretical rates shown on Table 1.
Table 3 shows the behavior summary of the filtered water turbidity during the maturity stage on each filter and the water as a result of the mixture of the four filters, the data was obtained during the 8 cycles of operation. On this table is found that as stated by the different authors (Hilmoe and Cleasby, 1986; de Souza, 1990; Teixeira, 1991, mentioned by Escobar (1992), the quality of the water during this period presents a significative decay for the filter that was washed if compared with the other filters that continue in operation as shown in Figure 2.
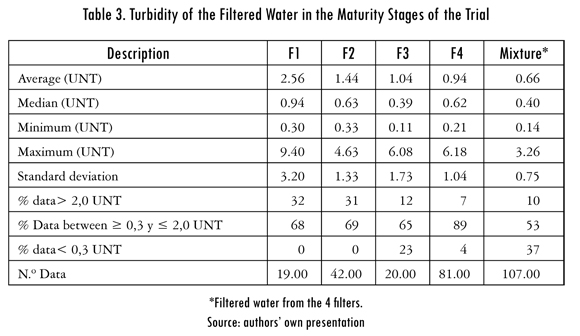
It was found that during the maturity period in some moments the turbidity of the filtered water is greater than the turbidity of the clarified water. This may be due to the retained water in the filter and in the lines that is composed of clean water that was left in the draining system, to the remaining water from the washing that was left inside the media, and to the remaining water on the filtering system (Amirtharajah and Wetstein, 1980 mentioned by Colton et al., 1996).
The analysis of the behavior of the turbidity from the resulting water of the mixture of the 4 filters show lower values than those of the individual filters because in this flow modality, while one filter is in the maturity stage the others are in the stage of maximum efficiency, helping to reduce the turbidity values registered for the mixture. The fact that the mixed water from the 4 filters shows a 9% superior turbidity value over 2.0 NTU, a value set by MPS and MAVDT (2007) for drinking water, may indicate that for this type of raw and clarified water is not enough to consider a battery of only 4 filters. About this, Crittenden et al. (2012) indicates that the plants with wide treatment capacity must have at least 4 filters, but Kawamura (2000) mentions than very big plants (9 m3/s) may easily exceed 30 filters; however, the total number of filters may be limited according to the size (to a practical limit of say a 100 m2) and/or by high rates of filtration (20 m/h). In the case of the PM-WTP 24 filtration units are available to guarantee an adequate filtration process.
A greater number of filters afford strength to the process because they allow a reduction in the magnitude of changes in the quality of the water through the different stages of the filtering process when compared to a single filter operation. This is a similar concept to the multiple barrier one where the failure in one barrier can be mitigated or suppressed by the other barriers in order to guarantee and insure the production of adequate water from the public health point of view (Fournier, 2006; Moreno, 2009; Plummer et al., 2010).
Table 4 shows the data gathered on the turbidity during the periods of maximum efficiency through the 8 cycles of operation of the pilot plant. It is observed on this table that the turbidity of the water greatly improves with respect to the maturity stage with lesser turbidity values up to 0.3 NTU (maximum turbidity value recommended by USEPA (2006) for the control of the microbiological risk by Cryptosporidium in two samples taken during a time not greater to 15 min).

The turbidity of the filtered water was generally constant during all the operation of the system; however, between cycles 5 and 6 a turbidity peak was present that is characteristic in the filtering process and could be due to problems in the coagulation as reported by USEPA (2004) and AWWA (2011). It is additionally observed that with the exception of the stage that reported a turbidity peak during the washing, the turbidity in the effluent of the filters that were not being washed, was not affected by the increase on the rate of filtration (see Figure 2).
Table 5 shows the duration of the career of filtration that was obtained during the 8 cycles of operation and the maturity times on each process. It is observed that the average duration was 40.8 h, with a maximum of 49.2 h and a minimum of 33.9 h. The maturity periods present varied from 2.7 min to 26.1 min with an average of 15.5 min that is greater than the 15 min time recommended by AWWA (1997). The handling of the maturity period of F4 in cycle 6 is a particular case where the registered time was 165.6 min. It was not registered on the statistics because it was considered and odd value related to a turbidity peak present in the filtered water not only in this filter but in all the system (see Figure 2).
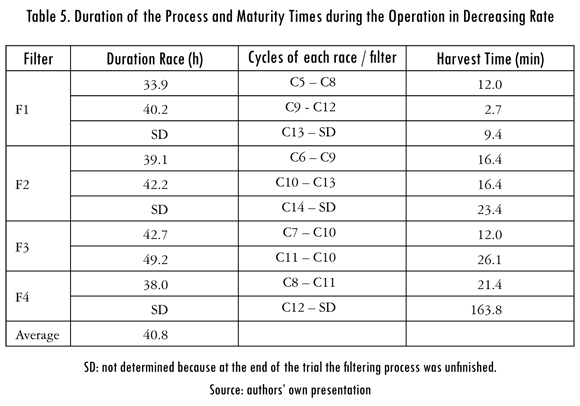
Figure 3 shows the behavior of the registered load loss during the 8 cycles of the assay. It is observed that on each cycle the load loss increases in the anthracite while in the sand is generally constant because the grater decrease in porosity is present in the anthracite making it prone to a greater retention of solids. During cycles 5 and 6 the load loss observed in the sand presented an increase to coincide with the turbidity peak that appeared during these cycles, this made evident that during this period an operational problem was present that allowed the particles to go through the anthracite and sand beds and allowed some others to clogging the filter.
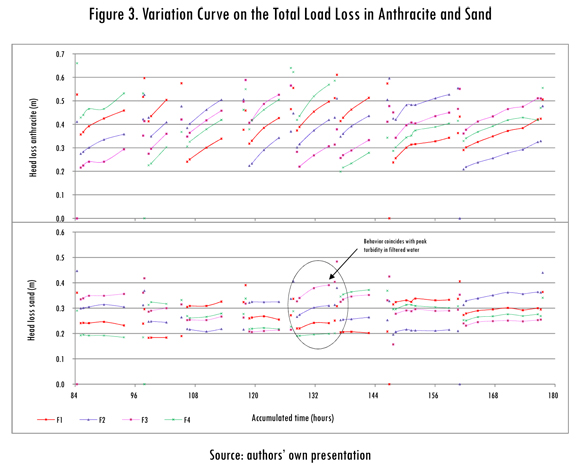
It is also observed that in Figure 3 for a clean filter the greater load loss is present in the sand layer while the lower one is in the anthracite. This situation impacts the behavior of the turbidity because the quality of the filtered water is lower, as showcased during the maturity stage, because during these stages the particles are principally retained by the last filtration layer that allows the particles to go through.
2.3. Evaluation of the Influence of the Flow Control on the Filtration Performance
There is an aspect that allows a valid comparison of the behavior of the pilot filtration plant in the two modalities of flow control. This is that the quality of the clarified water that fed the plant in the two conditions was similar because in both cases over 90% of the gathered data on the turbidity of the clarified water was less than 5.0 NTU and the variation coefficients varied 5%.
The operation on declining rate (DR) presented a better performance than the constant rate (CR) one in relation to the quality of the filtered water. The declining rate operation presented lower to 0.15 NTU turbidity registrations for more than 70% when compared to approximately 52% in the constant rate operation (Perea et al., 2013). It was also found that the load loss was 0.80 m and 1.10 m in DR and CR respectively for a career of filtration process of 40 h. These results coincide with the ones found by some authors (Di Bernardo and Cleasby, 1980; Hilmoe and Cleasby, 1986, mentioned by Di Bernardo and Sabogal, 2009; Makie et al., 2003) who point out that the operation of the filters in declining rate modality present a lower pressure on the filtrating media because it guarantees a lesser load loss thus favoring the process.
A detailed analysis of the behavior obtained from the LL shows that on the decreasing rate operation the LL in the sand diminishes in each cycle during all the process while it increases in the anthracite. This is the different for the results on a constant rate operation where the LL in the sand increases until the moment when the anthracite LL surpasses it. This situation may show that the declining rate operation allows a better distribution of solids in the anthracite layer, generating a decrease in the porosity of this media and favoring the retention of particles by the sand to positively affect the quality of the filtered water.
Conclusions
The behavior of the quality of the filtered water for the evaluated clarified water from the filtration pilot plan indicates that between the two modalities of flow control evaluated, the declining rate presents the best levels of turbidity when compared to the constant rate.
The declining rate operation also reported a better load loss for the same time of operation when compared to the constant rate. On the declining rate, additionally, the load loss in the sand does not surpass that of the anthracite and this may indicate that this flow modality favors a better distribution of solids on a filtering media to generate a lower risk of particles going through the filter.
Acknowledgements
This research was carried out with the technical and financial support of COLCIENCIAS, EMCALI EICE ESP and the Universidad del Valle in the framework of the project "Identification, evaluation and management of risk in the drinking water supply system of the low network of the city of Cali, framed in a Water Safety Plan - WSP".
References
AKGIRAY O. and SAATÇI, A. A critical look at declining rate filtration design. Water Science and Technology. 1998, no. 38, pp. 89-96. [ Links ]
ARBOLEDA, V Teoría y práctica de la purificación del agua. 3a ed., tomo 2. Bogotá: McGraw-Hill, 2000. [ Links ]
AMERICAN WATER WORKS ASSOCIATION (AWWA). Water quality y treatment: a handbook on drinking water. 6th ed. New York: McGraw Hill Professional, 2011. [ Links ]
BOLLER, M. and KAVANAUGH, M. Particle characterics and head loss increase in granular media filtration. Water Research. 1995, vol. 29, no. 4, pp. 1139-1149. [ Links ]
CLEASBY J. Declining rate filtration. Water Science & Technology. 1993a, vol. 27, no. 7-8, pp. 11-18. [ Links ]
CLEASBY J. Status of declining rate filtration design. Water Science & Technology. 1993b, vol. 27, no. 10, pp. 151-164. [ Links ]
COLTON, J.; HILLS, P., and FITZPATRICK, C. Research note: Filter backwash and start-up strategies for enhanced particuale removal. Water Research. 1996, vol. 30, no. 10, pp. 2502-2507. [ Links ]
CORNWELL, D.; MACPHEE, M.; BROWN, R., and VIA, S. Demonstrating Cryptosporidium removal using spore monitoring at lime-softening plants. Journal of American Water Works Association. 2003, pp. 124-133. [ Links ]
CRITTENDEN, J., TRUSSELL, R., HAND, D., HOWE, K. Y TCHOBANOGLOUS, G. MWH's Water Treatment: Principles and Design. John Wiley & Sons, 2012. [ Links ]
CRUZ, C. Filtração direta ascendente com alta taxa. Dissertação para Obtenção do título de Mestre em Hidráulica e Saneamento, Escola de Engenharia de São Carlos, Universidade de São Paulo, Brasil, 1993. [ Links ]
DABROWSKI, W. The progression of flow rates in variable declining rate filter systems. Acta Hydrochimica et Hydrobiológica. 2006, no. 34, pp. 442-452. [ Links ]
DI BERNARDO, L. Características hidráulicas dos métodos de operação dos filtros rápidos de gravidade. Revista DAE. 1983, no. 135, pp. 30-36. [ Links ]
DI BERNARDO, L. and SABOGAL PAZ, L.P. Seleção de tecnologias de tratamento de água. São Paulo: LDiBe, 2009. [ Links ]
ESCOBAR, J. Influência da capacidade de armazenamento de água a montante dos filtros no funcionamento de sistemas de filtração com taxa declinante. Dissertação para Obtenção do titulo de Mestre em Hidráulica e Saneamento, Escola de Engenharia de São Carlos, Universidade de São Paulo, Brasil, 1992. [ Links ]
FOURNIER, B. Gestión del riesgo sanitario en la regeneración del agua. Tesina de Especialización, Universidad Politécnica de Cataluña, Barcelona, 2006. [ Links ]
GAO, P. ; XUE, G. ; SONG, X.-S., and LIU, Z.-H. Depth filtration using novel fiber-ball filter media for the treatment of high-turbidity surface water. Journal Separation and Purification Technology. 2012, no. 95, 32-38. [ Links ]
JEGATHEESAN, V. and VIGNESWARAN, S. Deep bed filtration: mathematical models an observations. Environmental Science and Technology. 2005, vol. 35, no. 3, pp. 515-569. [ Links ]
KAWAMURA, S. Integrated design of water treatment facilities. 2nd ed. New York: John Wiley & Sons. [ Links ]
MACKIE, R.; ZIELINA, M., and DABROWSKI, W Filtrate quality from different filter operations. Acta Hydrochimica et Hydrobiologica. 2003, no. 31, pp. 25-35. [ Links ]
MINISTERIO DE LA PROTECCIÓN SOCIAL-MINISTERIO DE AMBIENTE, VIVIENDA Y DESARROLLO TERRITORIAL (MPS-MAVDT). Resolución 2115, por medio de la cual se señalan características, instrumentos básicos y frecuencias del sistema de control y vigilancia para la calidad del agua para consumo humano. 2007. [ Links ]
MONTOYA, C.; LOAIZA, D.; TORRES, P; CRUZ, C., and ESCOBAR, J. Efecto del incremento en la turbiedad del agua cruda sobre la eficiencia de procesos convencionales de potabilización. Revista EIA. 2011, no. 16, pp. 1794-1237. [ Links ]
MORENO, J. Avaliação e gestão de riscos no controle da qualidade da água em redes de distribuição: estudo de caso. Tese de doutorado, Escola de Engenharia de São Carlos Universidade de São Paulo, Brasil, 2009. [ Links ]
OKUN, D. Drinking water and public health protection. In: Pontius, F.W. Drinking water regulation and health. New York: John Wiley & Sons, 2003, pp. 13-14. [ Links ]
PEREA-TORRES, L.; TORRES-LOZADA, P; CRUZ-VÉLEZ, C., and ESCOBAR-RIVERA, J. Influencia de la configuración del medio filtrante sobre el proceso de filtración del agua clarificada del río Cauca. Revista de Ingeniería. 2013, no. 38, pp. 38-44. [ Links ]
PÉREZ, A.; AMEZQUITA, C., and TORRES, P Identificación y priorización de peligros como herramientas de la gestión del riesgo en sistemas de distribución de agua potable. Revista Ingeniería y Universidad. Bogotá. 2012, vol. 16, no. 2, pp. 449-469. [ Links ]
PLUMMER, R.; VELANISKIS, J.; GROSBOIS, D.; KREUTZWISER, R., and DE LOE, R. The development of new environmental policies and processes in response to a crisis: the case of the multiple barrier approach for safe drinking water. Environmental Science & Policy. 2010, vol. 13, no. 6, pp. 535-548. [ Links ]
RENNER, R.C. and HEGG, B.A. Self-assessment guide for surface water treatment plant optimization. n.l.: American Water Works Association (AWWA), 1997. [ Links ]
SPELLMAN, F. Handbook of water and wastewater treatment plant operations. 2nd. ed. Boca Raton: Taylor & Francis, 2009. [ Links ]
UNITED STATES ENVIRONMENTAL PROTECTION AGENCY (USEPA). Long term 1: enhanced surface water treatment rule turbidity provisions, technical guidance manual [document on line]. 2004. <http://water.epa.gov/lawsregs/rulesregs/sdwa/mdbp/ upload/20041122mdbp_lt1eswtr_guidancelt1 turb.pdf> [ Links ].
UNITED STATES ENVIRONMENTAL PROTECTION AGENCY (USEPA). National primary drinking water regulations: long term 2 enhanced surface water treatment rule - Part II. n. l.: USEPA, 2006. [ Links ]
ZIELINA, M. and DAJBROWSKI, W. Impact of raw water quality on operation of variable declining rate filter plants. Environment Protection Engineering. 2011, no. 37, pp. 133-140. [ Links ]
