


Servicios Personalizados
Revista
Articulo
 Inglés (pdf)
 Articulo en XML
 Referencias del artículo
 Enviar articulo por email
Indicadores
-
 Citado por SciELO
 -
 Accesos
Links relacionados
-
 Citado por Google
 -
 Similares en
SciELO
Similares en
SciELO -
 Similares en Google
Compartir

 Permalink
Ingeniería y Universidad
versión impresa ISSN 0123-2126
Ing. Univ. vol.18 no.2 Bogotá jul./dic. 2014
https://doi.org/10.11144/Javeriana.IYU18-2.hahb
Hydrologie Attenuation and the Hydrologie Benefits of Implementing Eco-Productive Green Roofs in Marginal Urban Areas1
Atenuación hídrica y beneficios hidrológicos debido a la implementación de techos verdes ecoproductivos en zonas urbanas marginadas2
Nicolás Oviedo3
Andrés Torres4
1Reception date: May 5th, 2013. Acceptance date: July 31st, 2014. This article is derived from the research project 4656: Proyecto piloto techos verdes como alternativa de preservación del medio ambiente, seguridad alimentaria y fortalecimiento comunitario en Usme, developed by the research group Ciencia e Ingeniería del Agua y el Ambiente, Pontificia Universidad Javeriana, Bogotá, Colombia
2Fecha de recepción: 5 de mayo de 2013. Fecha de aceptación: 31 de julio de 2014. Este artículo se deriva del proyecto de investigación 4656: Proyecto piloto techos verdes como alternativa de preservación del medio ambiente, seguridad alimentaria y fortalecimiento comunitario en Usme, desarrollado por el grupo de investigación Ciencia e Ingeniería del Agua y el Ambiente de la Pontificia Universidad Javeriana, Bogotá, Colombia.
3Ingeniero civil, Pontificia Universidad Javeriana, Bogotá, Colombia. E-mail: d.oviedo@javeriana.edu.co.
4Ingeniero civil y especialista en Sistemas Gerenciales de Ingeniería, Pontificia Universidad Javeriana, Bogotá, Colombia. MSc. en Ingeniería Civil y PhD en Hidrología Urbana, Institut National des Sciences Appliquées de Lyon, INSA-Lyon, Université de Lyon, Lyon, Francia. Profesor asociado, Facultad de Ingeniería, Pontificia Universidad Javeriana, Bogotá, Colombia. E-mail: andres.torres@javeriana.edu.co.
How to cite this article
OVI EDO, N. and TORRES, A. Attenuation and the Hydrologic Benefits of Implementing Eco-productive Green Roofs in Marginal Urban Are. Ingeniería y Universidad. 2014, vol. 18, no. 2, pp. 291-308. http://dx.doi.org/10.11144/Javeriana.IYU18-2.hahb
Abstract
In the present study, the hydrologie attenuation of an eco-productive green roof is assessed using three indicators: lag-time, runoff coefficient and water volume retention. Two types of plants—an herbaceous (Lactuca sativa) and a Cruciferae (Raphanus sativus)—were utilized in this analysis of eight rain events monitored on four houses in the La Isla neighborhood of Soacha, Colombia (4° 34' 22.3", 74° 10' 53.5"; 2,701 meters above sea level). Maximum lag-times, volumetric retention percentage and minimum equivalent runoff coefficients of 32 minutes, 80% and 0.1, respectively, were obtained. The hydrologic benefits of implementing such green roofs is determined by comparing the drainage infrastructure required with and without green roofs and by assessing the probability of flooding at the study site with or without green roofs. In order to analyze these benefits, the Monte Carlo simulation method allows observation of the hydraulic behavior of sewers in drainage areas where green roofs are implemented. When the green roofs are installed, a maximum savings (in economic terms) of approximately 22% and a reduction in flooding probability of approximately 35% are observed.
Keywords: runoff coefficient; productive green roof; Kernel estimators; flooding probabilities
Resumen
Este trabajo evalúa la atenuación hídrica de un techo verde productivo mediante tres indicadores: lag-time, coeficiente de escorrentía y porcentaje de retención volumétrica. Se utilizaron dos especies de plantas: una herbácea (Lactuca sativa) y una crucifera (Raphanus sativus). Se registraron ocho eventos de lluvia en cuatro casas del barrio La Isla, en Soacha, Colombia (4° 34' 22.3", 74° 10' 53.5", 2701 msnm). Se observaron retardos de la escorrentía hasta de 32 minutos, coeficientes equivalentes de escorrentía mínimos hasta de 0,1 y porcentajes de retención volumétrica máximos cercanos al 80 %. Se evaluaron los beneficios hidrológicos de implementar techos verdes comparando la infraestructura de drenaje requerida con techos verdes y sin estos, y calculando sus respectivas probabilidades de inundación en el área de estudio (barrio La Isla, Soacha, Colombia). Se simuló la respuesta del alcantarillado propuesto mediante la metodología de Monte Carlo, y al implementar techos verdes en toda el área de estudio: el coeficiente de escorrentía se distribuyó aleatoriamente, siguiendo una distribución de Kernel correspondiente a los datos registrados en campo. Los resultados obtenidos evidenciaron ahorros cercanos al 22 % y una reducción del 35 % de las probabilidades de inundación.
Palabras clave: coeficiente de escorrentía; techo verde productivo; estimadores de Kernel; probabilidad de inundación
Introduction
Hydrologic cycle fluxes are one of the most relevant problems associated with rainfall in urbanized areas. The changes of these fluxes can be primarily attributed to the construction of impervious areas that decrease the percentages of infiltration and evaporation. In turn, such decreases modify concentration times in urban catchments; and, when a concentration time decreases, runoff flow exhibits a significant jump as result of new forms of land-use and sewer system implementation (Chen, Hill, and Urbano, 2009; Jacobson, 2011). Since the late 1970s, Sustainable Urban Drainage Systems (SUDS) have been developed to tackle the problems listed above (Butler and Davies, 2009; Niemczynowicz, 1999), especially as an alternative to manage stormwater and thereby reduce the risk of flooding (Ballard and Kellagher, 2007a).
Generally, SUDS require the construction of large spaces, a possible hindrance to their implementation in urban areas. Unlike SUDS, green roofs enjoy the benefit of not demanding new spaces, for they can be installed on existing roofs (Castleton et al., 2010; Ballard and Kellagher, 2007b; CSQ, 2003).
Green roofs attenuate flow peaks and their performance depends on three main factors: Antecedent Dry Weather Period (ADWP), type of vegetation used and type of soil used (Getter and Rowe, 2006; Mentens, Raes, and Hermy, 2006). Additionally, soil composition and layer depth also significantly influence the mitigation of stormwater runoff (CSQ, 2003; Kasmin et al., 2010; Peck and Callaghan, 2005). In fact, according to Dunnett et al. (2008), the layer depth and weight of soil result in a significant negative correlation (p-value < 0.05) with the peak rates of runoff from green roofs. The conclusion to be drawn is that plants with deeper soil layers translate into lower runoff volumes. Other potential benefits of deeper soil layers include enhancement of rainwater quality by virtue of absorption and contaminant filtration (e.g. heavy metals such as Cu, Cd, Pb, Zn), reduction of urban heat-island effects, increased urban wildlife population and density and improved air quality (Li et al., 2008; Marsalek, 2007).
Green roofs can be classified according to the height of the soil layer (Bal-lard and Kellagher, 2007b; Mentens et al., 2006; New Jersey Department of Environmental Protection, 2004; Oberndorfer et al., 2007; Peck and Callaghan, 2005; Werthmann, 2007): (i) "Extensive" green roofs have heights between 25 mm and 125 mm and usually require daily maintenance depending on the function of vegetation type; (ii) "Intensive" green roofs are more than 125 mm high and demand less upkeep; (iii) "Simple" green roofs serve mainly as ways to add to the aesthetic value of urban landscapes and are commonly constructed with synthetic materials.
Little research in Colombia has focused on assessing green roofs' potential for the reduction of runoff peaks or their effect on water quality. This article evaluates the hydrologic attenuation brought about by the implementation of green roofs in real weather conditions in an Andean tropical region.
1. Methods
The neighborhood known as La Isla served as the study site for this research. La Isla is located in the Altos de Cazucá in Soacha, Colombia, just south of the capital, Bogotá. Altos de Cazucá includes 33 neighborhoods (IPO, 2004) lacking access to sewer systems. The drainage area of La Isla drainage is 9.5 ha. Rainfall data from the Casablanca rain gauge station, located 1.6 km from the study site and operated by Bogota's Water and Sewer Company (EAAB), were used.
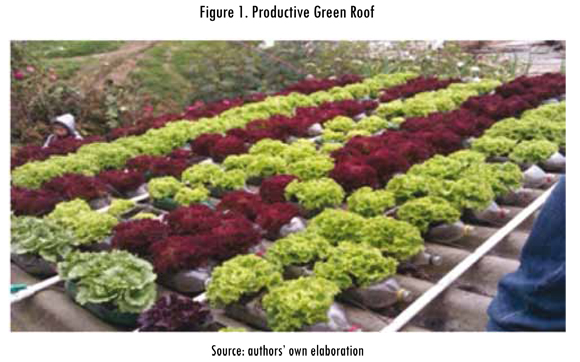
We constructed productive green roofs (see Figure 1) on the top of four houses, following the method presented by Forero-Cortes et al. (2012). We refer to these green roofs as productive in that they can support the growing of edible plants. Each productive green roof contains two plant species: an herbaceous (Lactuca sativa) and a Cruciferae (Raphanus sativus). These species were chosen due to their low reticular depth (Casseres, 1980), fast growth (around two months) and edibility (suitability for human consumption). Each green roof consists of 140 plastic bottles, where a single bottle has a capacity of 2.5 L. These bottles were used as containers for planting three seedlings (two Lactuca sativa and one Raphanus sativus). The average soil depth is 8 cm: 60% black dirt and 40% rice husk. Furthermore, we installed an irrigation system in order to guarantee the minimum water content necessary for plant growth and survival (see Figure 1).
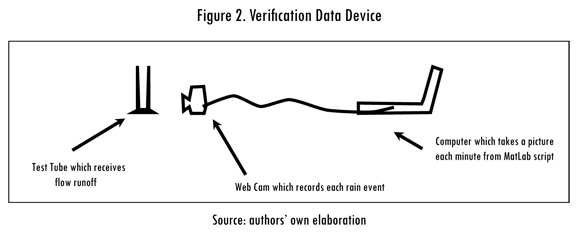
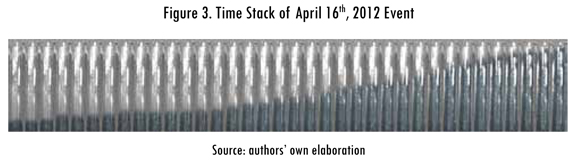
The experimental procedure consists of measuring rainfall with a Verification Data Device (VDD) and runoff flow with a Manual Volumetric Device (MVD) for each green roof. Figure 2 displays the VDD, which is composed of a computer, a high definition webcam and a 500 cm3 test tube. The VDD snaps a picture every minute during a rainfall event. With these images, a time stack was obtained for each rainfall event (see Figure 3) using a MatLab script developed specifically for this purpose. As for the hydrologic response of each green roof, a flow rate volumetric measurement was made by each family living in a house equipped with a green roof: the water level in a tank with a capacity of 250 L was recorded every 5 min during every rainfall event.
Multiple Correspondence Analyses (MCA) (Abdi and Valentin, 2007) and Principal Component Analysis (PCA) (Abdi and Wiliams, 2010) were applied with R (R Core Team, 2013) to identify relations among the variables measured; these variables include: event date, maximum and mean intensity, event duration, total rainfall depth, family measuring the event, roof area, green roof drainage level, green roof drainage volume and three hydrological attenuation variables (lag-time K, runoff coefficient C and water volume retained by the green roof Vp).
For each dependent variable (K, C and Vp), a variance analysis (Anova and Kruskal-Wallis) (Larson, 2008) was carried out with R (R Core Team, 2013) in order to establish the significance level of each independent variable on the hydrologic attenuation of the green roofs studied.
To evaluate the benefit of implementing the proposed green roof with real rainfall data series measured at the Casablanca rain gauge station (from 01/07/2009 to 02/07/2012, 1,126 days with temporal resolution = 15 min), two simulation scenarios were computed. The first scenario entails two stormwater sewer systems sized for the study area, with (C = 0.1) and without (C = 1) green roofs; C values were estimated according to fieldwork results and then compared in terms of construction costs and flooding probabilities. Pipe-related flooding occurs when it works under pressure, whereas the flooding probability of a pipe is calculated as the number of simulations where flooding occurs divided by the total number of Monte Carlo simulations. Each simulation was run with different C values, per the kernel distribution (Tsybakov, 2008) using kernel density estimations (Duong, 2007) fitted with C values obtained in field. For parametric estimators, the estimator has a fixed functional form and the parameters of this function are the only information we need to store. However in real-world problems, this information is not available and therefore non-parametric estimators, with no fixed structure and depending upon all the data points to reach an estimate, as the kernel density estimator, have to be used (Hwang, Lay, and Lippman, 1994; Guidoum, 2013). With regard to the second simulation scenario, the hydrologic response was modeled using EPASWMM 5.0 software—with the non-linear reservoir functioning as a runoff model (Rossman, 2010)—and the dynamic wave method. The response of the sewer system (sized without considering green roofs) is based on further green roof implementation in all drainage areas and takes into account the distribution of runoff coefficients C obtained in the field, but without changing the pipes sized without considering green roofs. In other words, green roofs were exclusively modeled via coefficient runoffs C measured in the field, and their variations have been taken into account by considering not only a single value (as for example the mean or median) but all the data observed by means of the corresponding density function. Also, we calculated probability density function using kernel density estimation (Tsybakov, 2008) via a Monte Carlo procedure (1,000 runs).
3. Results
3.1. Multivariate Analysis Results
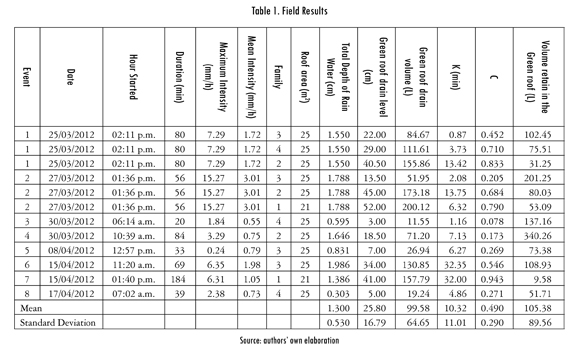
Table 1 shows the main characteristics of each recorded event: five hydrological variables (Event date, Maximum intensity, Mean intensity, Event duration and Total depth of rain water), four green roof variables (Family/green roof owner, Roof area, Green roof drainage level and Green roof drainage volume) and three hydrologic attenuation variables (K, C and Vp). We observed a maximum lag-time of 33 minutes, a minimum equivalent runoff coefficient of 0.078 and a mean percentage of retention volume of 85%.
A scatter-chart (Figure 4) allows us to observe that the variation of some hydrologic variables such as total volume of rain water (labeled as Vol_total), drainage volume (labeled as Vol_drainage) and maximum and mean intensity (labeled as I_max and I_mean, respectively) are principally explained by the first component, yet the date (labeled as EVENT) and duration of rainfall events are better explained by the second component. In this Figure (Figure 4), we also see that roof area and family are important for both the first and second components. When hydrologic attenuation variables are used as cluster variables in the PCA results (Figure 5), K and C separate the data into two groups following the second component. This separation indicates that K and C could be linked to hydrologic characteristics like rainfall date and duration in addition to roof area and family. Nevertheless, this analysis does not show a clear separation among groups for Vp. The results above could be interpreted such that they push us to recognize the fact that the methodology used to categorize Vp (low, middle and high labeled according to quartiles) should be improved.
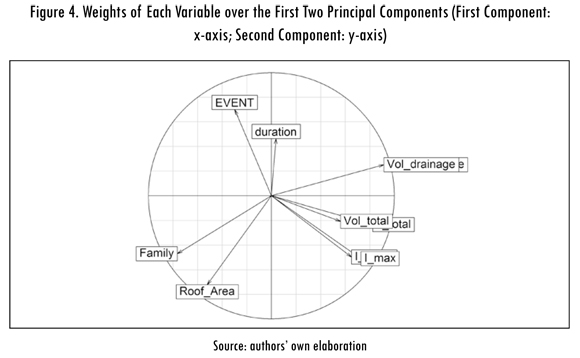
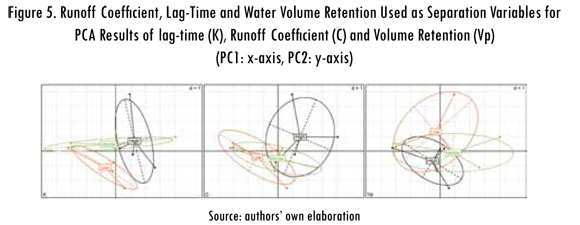
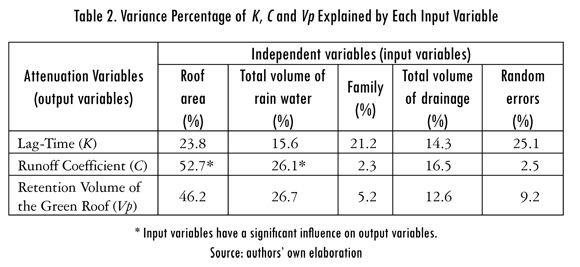
Table 2 summarizes the results obtained from the variance analysis undertaken for the three output variables K, C and Vp. For K and Vp analysis, the Kruskal-Wallis test was used on account of the fact that neither homogeneity of variance nor normality was verified with the Bartlett (Arsham and Lovric, 2011) and Shapiro-Wilk (1965) tests, respectively. For C analysis, the Anova test was used. In Table 2, we see that for K and Vp there are no significant input variables that explain the variability of phenomena (p-value > 0.05). In fact, for K the most important factor turned out to be random errors, which explain 25.1% of the variability observed. However, for Vp analysis, random errors only explain 9.2% of variability, though the variability of other factors considered do not present a significant influence on the variability of Vp. Therefore, there are likely other factors better suited to explain Vp variability. Concerning C analysis, roof area and total rain water volume proved to be significant factors (labeled * in Table 2), which together explain almost all C variance (roof area: 52.7%; rain water total volume: 26.1%). We can state that the variable referred to as "family", the family in charge of the green roof, is the least important factor in the variability of hydrologic attenuation. In sum: (i) the variability of C does not significantly depend on the person responsible for taking flow rate volumetric measurements, a fact which supports the reliability of the results obtained; (ii) other variables may exist to better explain the variability of the phenomena, such as the number of plants, age of the green roof, maintenance state and weather variation.
3.2. Hydrological Green Roof Benefits (First Scenario)
For the first scenario, we initially relied on a simulation run with a sewer with C = 1 (the critical case) and a return period of 3 years, 244 manholes, 4.2 km of pipe (length) and 16839 m3 of excavation and filling (calculated according ASTM-D 2321 [2000]). A sewer design with C = 0.1 (an optimal value for green roofs, close to the minimum obtained in the field—see Table 1) and a return period of 3 years, 201 manholes, 3.7 km of pipe lengths and 14863 m3 of excavation and filling was also obtained. Overall, this represents a financial savings of 22% when green roofs are constructed compared to sewers designed without green roofs.
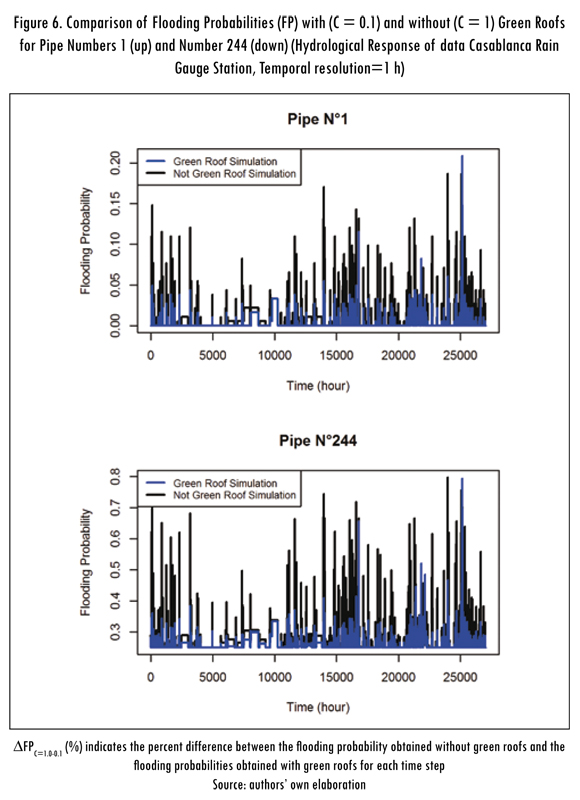
Flooding probabilities were assessed using a simulation procedure (EP-ASWMM 5.0) with real rainfall time series (gathered at the aforementioned Casablanca rain gauge station). Figure 6 demonstrates the difference in flood-ing probabilities (calculated as the probability of exceeding a pipe's hydraulic capacity) between simulation results obtained with (C=0.1, Figure 6 in blue) and without green roofs (C=1, Figure 6 in black) for two of the 244 sized pipes. Similarly, Figure 6 allows us to observe that the differences between flooding probabilities for simulations without and with green roofs reach 100% for pipe 1 and 50% for pipe 244. On one hand, these differences were greater than 20% for pipe 1 in 90% of the simulations. On the other hand, for pipe 244, only 50% of the simulations exhibited differences greater than 0%. Moreover, in Figure 6, flooding probabilities are occasionally higher for green roof simulations than those with conventional roofs. In this case, we can establish the role of ADWP: when ADWP is less than one day, the green roof retains a certain amount of water from the last storm event, a holdover which leads to greater flooding probability. In spite of this fact, Figure 6 shows that, generally speaking, the probability of flooding goes down for green roof simulations as opposed to the probabilities obtained for conventional roof simulations.
MCA was done to determine the relationships between statistical modes of flooding probabilities (Mprob C=1 and Mporb C=1) for conventional-roof (C= 1) and green-roof simulations (C = 0.1) and to identify minimum and maximum differences in flooding probabilities with and without green roofs (ΔPmin and ΔPmax ); sewer characteristics pertinent to such analysis include pipe slope (So), pipe diameter (Dpipe), pipe length (Lpipe), drainage area (Adrainage) and pipe altitude (Altitudepipe).
We kept the first two principal components explaining 75.8% of phenomena variance. In Figure 7, the five input variables (So, Dpipe, Lpipe, Adrainage, and Altitudepipe ) and four output variables (ΔPmax , ΔPmin, Mprob C=1, Mprob C=0.1) are visually represented.
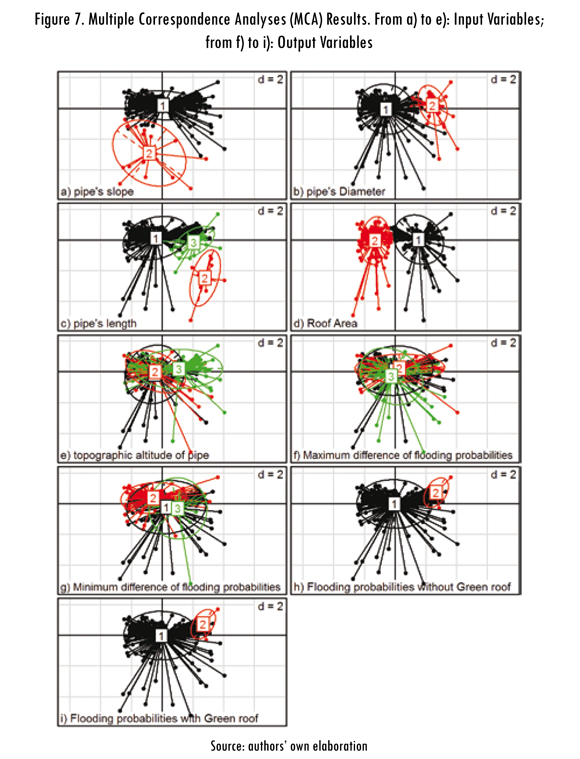
So separates the data in two groups according to distance from the second component (first group: low slopes; second group: high slopes). The pipe slopes of the second group are greater than 7%. As for Dtube and Adrainage, the two groupswere separated based on the first component. Likewise, we observed that all data are classified into three groups when Lpipe is used as a separation variable along with distance for the first (groups 1 and 2) and second (group 3) components. However, when Altitudepipe is used, no evident separation is observed, which means that Altitudepipe has the least importance of the principal components. In the same vein, output variables ΔPmax and ΔPmin do not present any differences between groups, showing that these variables are not pertinent when considering the variability of phenomena. The tendency to separate the data into two groups is continued when we turn our attention to Mprob C=1 and Mprob C=0.1 , as these classify the data with respect to their distances from the first component (first group: low diameters; second group: high diameters). This allows us to trace a relationship between Mprob C=1 and Mprob C=0.1 and diameters and drainage areas.
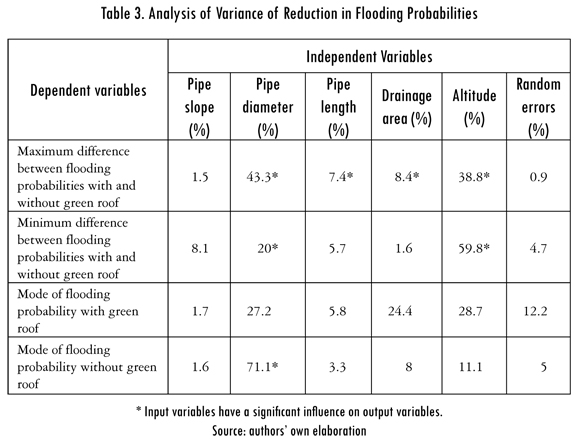
With regard to the data discussed in the previous paragraph, we employed Anova (for ΔPmax , ΔPmin , Mprob C=1, Mprob C=0.1) in order to figure out the input variables most heavily affecting the variability of output variables. Table 3 summarizes the Anova results obtained. For ΔPmax, we observe that there are five factors which carry significant weight: Dpipe (43.3%), Altitudepipe (38.5%), Adrainags (8.4%), Lpipe (7.4%) and random errors (0.9%). For ΔPmin , we see that Altitudepipe is the most important factor, as it explains 59.8% of variance; this is followed by Dpipe (accounts for 20% of variance). While for Mprob C=1 , Dpipe is the only significant factor (p-value < 0.05), which explains the majority of variance (71.1%), there are no significant factors for Mprob C=0.1 . Lpipe and So do not meaningfully explain the variability of MprbC=1 and Mprb C=0.1 given that random errors engender a higher percentage of variance than the variability of either Mprob C=1 or Mprpb C=0.1 consequently, we could posit the existence of other variables that more accurately account for the variance of phenomena, variables such as peak flows, concentration times, etc.
3.3. Hydrological Green Roof Benefits (Second Scenario)
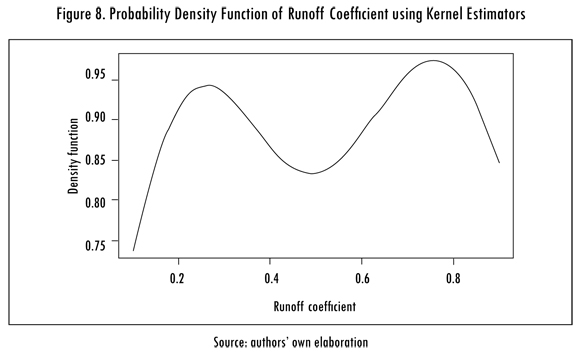
The Monte Carlo technique was applied in order to obtain the expected value of decreasing flooding probabilities, with which we could compare the results obtained in the field after installing the green roofs proposed in all drainage areas of La Isla. The application of this technique helps answer questions as to the levels of hydrologic attenuation observed for green roofs in the field. Achieving this result meant assigning different C values to each house (300 houses in total). Although we did not follow any specific criteria for such assignments, we can nevertheless guarantee a random distribution according to a probability density function (see Figure 8), which matches the data recorded in the field. Bimodal behavior shows two peaks close to C = 0.1 and C=1, a fact attributable to the recorded rainfall. The largest value appears when ADWP is less than two days (events 1, 6 and 7 recorded on 25/03/2012, 27/03/2012 and 15/04/2012, respectively); as previously discussed, this stems from the fact that green roofs retain water from rainfall events. The flip side, i.e. smallest values, is observed when ADWP is three days or greater and exhibits low intensity (see Table 3). The probability density function was calculated in terms of a kernel function with a bandwidth of 0.17 (R Core Team, 2013). The hydraulic response, measured with rainfall time series data from the Casablanca gauge, of the sewer pipes was simulated 1,000 times (with different C values each time for 300 houses). Monte Carlo simulations led us to recognize that a significant reduction in flooding probabilities was calculated at around only 4%, with a 95% confidence interval, because most of the simulations assigned 80% of the roofs a high C value (C > 0.75) on account of the runoff coefficient's density function.
Conclusions
For the eight events recorded during March and April of 2012, we observe significant water losses nearing 70% for the green roofs monitored. Similarly, we observed maximum lag-time values of 32 minutes and minimum runoff coefficient values of about 0.1. These results provide evidence that the productive green roofs we propose play an important role in hydrologic attenuation, which could help re-establish rainfall event concentration times in urban catchments. These results depict a strong relationship between plant type used and the green roof's hydrologic response to weather events. Placing these results in context, we see that Dunnett et al. (2008) and Kasmin et al. (2010) reported maximum retention volumes of 60% and 50%, respectively, using Sedum in subtropical conditions; Oberndorfer et al. (2007) obtained percentage of 68% with Sedum and Moss in dry weather. Oberndorfer et al. (2007) also reported that retention volumes depend on soil layer depth. For the purposes of the present study, a constant layer depth of 5cm was chosen. Other relevant studies, such Forero-Cortes et al. (2012) and Niemczynowicz (1999), show Vp to be around 90% in tropical climates. We established a correlation between hydrologic attenuation and hydrologic variables by means of a qualitative analysis (PCA). C and K values are affected by variables such as total rainfall volume, maximum intensity, total drainage volume and roof area. Applying Anova shows that the roof area and total volume of rainfall are the only factors exercising significant (p-value < 0.05) influence on the variability of C. Additonally, we observed that the family in charge of volumetric measurements proves to be the least important factor as pertains to K, C and Vp variance, perhaps an indication that other variables not measured in this study (e.g. number of plants used, green roof age, plant maintenance, etc) affect the output variables measured.
When looking at the green roofs with maximum retention capacity in urban catchments, we see a savings on initial sewer system costs of about 22%, with the added bonus of a reduction in flooding probabilities found to be between 15% and 35%. The single most influential factor when considering the variability of benefits related to flooding probabilities (ΔPmax , ΔPmin , Mprob C=1, Mprob C=0.1) was observed to be the diameter of the pipe.
Monte Carlo simulations led us to recognize that a significant reduction in flooding probabilities was calculated at around only 4% because most of the simulations assigned 80% of the roofs a high C value (C > 0.75) on account of the runoff coefficient's density function. This implies a strong trend among the green roofs proposed to reach high C-values of roughly 0.75 after each rainfall event, possibly the result of low ADWP (less than one week) in the data series. Furthermore, retention capacity may decrease and C-values may increase if successive rainfall events are close in time (low ADWP). Future work in this area should analyze a larger number of events so that the results may more accurately represent the behavior of productive green roofs undergoing both high and low rainfall intensities and different ADWPs.
References
ABDI, H. and VALENTIN, D. Multiple correspondence analysis. In: SALKIND, N.J. (Ed.). Encyclopedia of measurement and statistics. Thousand Oaks (CA): Sage, 2007, pp. 651-657. [ Links ]
ABDI, H. and WILLIAMS, L.J. Principal component analysis. Wiley Interdisciplinary Reviews: Computational Statistics. 2010, no. 2, pp. 433-459. [ Links ]
ARSHAM, H. and LOVRIC, M. Bartlett's test. International Encyclopedia of Statistical Science. 2011, pp. 87-88. [ Links ]
ASTM-D 2321. Standard practice for underground installation of thermoplastic pipe for sewer and other gravity-flow applications. (STANDARD), 2000. [ Links ]
BALLARD, B.W and KELLAGHER, R. The SUDS Manual. n. p.: Construction Industry Research & Information Association (CIRIA), 2007a. [ Links ]
BALLARD, B.W and KELLAGHER, R. The SUDS Manual. n. p.: Construction Industry Research & Information Association (CIRIA), 2007b. [ Links ]
BUTLER, D. and DAVIES, J.W Urban drainage. New York: Taylor & Francis, 2009. [ Links ]
CASSERES, E. Producción de hortalizas. n. p.: Bib. Orton IICA/CATIE, 1980. [ Links ]
CASTLETON, H.F.; STOVIN, V; BECK, S.B.M. and DAVISON, J.B. Green roofs; building energy savings and the potential for retrofit. Energy and Buildings. 2010, no. 42, pp. 1582-1591. [ Links ]
CHEN, J.; HILL, A.A. and URBANO, L.D. A GIS-based model for urban flood inundation. Journal of Hydrology. 2009, no. 373, pp. 184-192. DOI: 10.1016/j.jhydrol.2009.04.021. [ Links ]
CSQ. Stormwater best management practice handbook. Los Angeles: California Stormwater Quality Association, 2003. [ Links ]
DUNNETT, N.; NAGASE, A.; BOOTH, R. and GRIME, P Influence of vegetation composition on runoff in two simulated green roof experiments. Urban Ecosyst. 2008, no. 11, pp. 385-398. DOI: 10.1007/s11252-008-0064-9. [ Links ]
DUONG, T. ks: Kernel density estimation and Kernel discriminant analysis for multivariate data in R. Journal of Statistical Software. 2007, vol. 21, no. 7, pp. 1-16. [ Links ]
FORERO-CORTES, C.; DEVIA-CASTILLO, C.; TORRES, A. and MENDEZ-FAJARDO, S. Diseño de ecotechos productivos para poblaciones vulnerables. n. p.: Acodal, 2012. [ Links ]
GETTER, K.L. and ROWE, D.B. The role of extensive green roofs in sustainable development. HortScience. 2006, no. 41, pp. 1276-1285. [ Links ]
GUIDOUM, A.C. kedd: Kernel estimator and bandwidth selection for density and its derivatives [document on line]. R package version 1.0.0, 2013. <http://CRAN.R-project.org/ package = kedd> [ Links ].
HWANG, J.; LAY, S. and LIPPMAN, A. Nonparametric multivariate density estimation: A comparative study. IEEE Transactions on SignalProcessing. 1994, vol. 42, no. 10, pp. 2795-2810. IPO. Contexto Alto de Cazucá (publico). Bogota: IPO, 2004. [ Links ]
JACOBSON, C.R.. Identification and quantification of the hydrological impacts of impervious-ness in urban catchments: A review. Journal of Environmental Management. 2011, no. 92, pp. 1438-1448. DOI: 10.1016/j.jenvman.2011.01.018. [ Links ]
KASMIN, H.; STOVIN, VR. and HATHWAY E.A. Towards a generic rainfall-runoff model for green roofs. Water Science Technology. 2010, no. 62, pp. 898-905. DOI: 10.2166/wst.2010.352. [ Links ]
LARSON, M.G. Analysis of variance. Circulation. 2008, no. 117, pp. 115-121. DOI: 10.1161/CIRCULATIONAHA.107.654335. [ Links ]
LI, S.; GONG, H.; ZHAO, W and LIU, J. Research on Beijing urban heat island and PM10 in the air. Education Technology and Training, 2008. and 2008 International Workshop on Geoscience and Remote Sensing. ETT and GRS 2008. International Workshop on. 2008, vol. 2, pp. 133-136. DOI: 10.1109/ETTandGRS.2008.277. [ Links ]
MARSALEK, J. Urban water cycle processes and interactions. New York: Taylor & Francis, 2007. [ Links ]
MENTENS, J., RAES, D. and HERMY, M. Green roofs as a tool for solving the rainwater runoff problem in the urbanized 21st century? Landscape and Urban Planning. 2006, vol. 77, pp. 217-226. DOI: 10.1016/j.landurbplan.2005.02.010. [ Links ]
NEW JERSEY DEPARTMENT OF ENVIRONMENTAL PROTECTION. NewJersey Stormwater Best Management Practices Manual. Trenton, NJ, 2004. [ Links ]
NIEMCZYNOWICZ, J. Urban hydrology and water management - present and future challenges. Urban Water. 1999, vol. 1, pp. 1-14. DOI: 10.1016/S1462-0758(99)00009-6. [ Links ]
OBERNDORFER, E.; LUNDHOLM, J.; BASS, B.; COFFMAN, R.R.; DOSHI, H.; DUNNETT, N.; GAFFIN, S.; KOHLER, M.; LIU, K.K.Y and ROWE, B. Green roofs as urban ecosystems: ecological structures, functions, and services. BioScience. 2007, vol. 57, p. 823. DOI: 10.1641/B571005. [ Links ]
PECK, S.W. and CALLAGHAN, C. Green roofs: ecological design and construction. n. p.: Schiffer Pub, 2005. [ Links ]
R DEVELOPMENT CORE TEAM. R: A Language and Environment for Statistical Computing. Vienna, Austria, 2012. [ Links ]
ROSSMAN, L.A. Storm water management model user's manual. Version 5.0. Cincinnati: n. e., 2010. [ Links ]
SHAPIRO, S.S. and WILK, M.B. An analysis of variance test for normality (complete samples). Biometrika. 1965, vol. 52, no. 3/4, pp. 591-611. [ Links ]
TSYBAKOV, A.B. Introduction to nonparametric estimation. Philadelphia: Springer, 2008. [ Links ]
WERTHMANN, C. Green roof: a case study. New York: Princeton Architectural Press, 2007. [ Links ]
