


Servicios Personalizados
Revista
Articulo
 Español (pdf)
 Articulo en XML
 Referencias del artículo
 Enviar articulo por email
Indicadores
-
 Citado por SciELO
 -
 Accesos
Links relacionados
-
 Citado por Google
 -
 Similares en
SciELO
Similares en
SciELO -
 Similares en Google
Compartir

 Permalink
Ingeniería y Universidad
versión impresa ISSN 0123-2126
Ing. Univ. vol.18 no.2 Bogotá jul./dic. 2014
https://doi.org/10.11144/Javeriana.IYU18-2.csmw
Combustion System Model of a Wet Process Clinker Kiln1
Modelo del sistema de combustión de un horno de Clinker de proceso húmedo2
Ómar Darío Hernández3
John Antonio Quiroz4
Paula Andrea Ortiz Valencia5
1Reception date: October 12,h, 2012. Acceptance date: July 31st, 2014. This article is the result of the Methodology for Modeling and Control of Combustion Systems using Fractional Calculus, research project. Code: PM12104. Developed by the research group Automatización de Procesos Industriales (Automatización y Electrónica), from the Instituto Tecnológico Metropolitano, Medellín, Colombia.
2Fecha de recepción: 12 de octubre de 2012. Fecha de aceptación: 31 de julio de 2014. Este artículo se deriva de un proyecto de investigación denominado Methodology for Modeling and Control of Combustion Systems using Fractional Calculus, desarrollado por el grupo de investigación Automatización de Procesos Industriales (Automatización y Electrónica), del Instituto Tecnológico Metropolitano, Medellín, Colombia.
3Electronics Engineer, Universidad de Antioquia, Medellín, Colombia. Specialist in Evaluation and Preparation of Private Projects, Universidad de Antioquia. Graduate student in Industrial Automation and Control, Instituto Tecnológico Metropolitano, Medellín, Colombia. Employee, Cementos Argos S.A., Medellín, Colombia. E-mail: ohernandez@argos.com.co
4Chemical Engineer, Universidad de Antioquia, Medellín, Colombia. Icontec Standards Reviewer for White Cement. Employee, Cementos Argos S.A., Medellín, Colombia. E-mail: jquiroz@argos.com.co
5Instrumentation and Control Engineer, Politécnico Colombiano Jaime Isaza Cadavid. Enginnering Graduate in Automation Area, Universidad Pontificia Bolivariana, Medellín, Colombia. Teaching assistant, Instituto Tecnológico Metropolitano, Medellín, Colombia. E-mail: paulaortiz@itm.edu.co
How to cite this article
HERNÁNDEZ, O. D.; QUIROZ, J.A., and ORTIZ VALENCIA, P. A. Combustion System Model of a Wet Process Clinker Kiln. Ingeniería y Universidad. 2014, vol. 18, no. 2, pp. 329-353. http://dx.doi.org/10.11144/Javeriana.IYU18-2.csmw
Abstract
This paper presents the model of the combustion process of a clinker kiln, which is obtained from an energy balance represented in the heat generated by burning coal and how this is distributed across the process. Data comes from the actual process variables, obtained from the control system using OLE for Process Control, which operates using experimental data and variables that are assumed to be constant. The resulting model is fitted with two tools: least squares and Infinite Impulse Response filter of first order. It validates and verifies the model and its settings using two statistical tools: box and whisker diagram and method of eight statistical metrics related by a fuzzy function. The use of these tools evidence satisfactory performance of the proposed model.
Keywords: kiln; energy balance; least squares; IIR filters; clinker
Resumen
En este trabajo se presenta el modelo del proceso de combustión de un horno rotatorio de Clinker, el cual se obtiene a partir de un balance de energía representado en el calor que se genera por la combustión de carbón y la forma como se distribuye aquel en todo el proceso. Se utilizan datos de las variables reales del proceso, obtenidas del sistema de control mediante OLE for Process Control, las cuales se operan con datos experimentales y variables que se asumen como constantes. El modelo obtenido se ajusta con dos herramientas: mínimos cuadrados y filtro Infinite Impulse Response de primer orden. Se valida y comprueba el modelo y sus ajustes utilizando dos herramientas estadísticas: diagrama de cajas y bigotes y un método de ocho métricas estadísticas relacionadas por una función difusa. La utilización de estas herramientas evidencia un desempeño satisfactorio del modelo planteado.
Palabras clave: horno rotatorio; balance de energía; mínimos cuadrados; filtros IIR; clinker
Introduction
To model or identify the combustion process of a kiln is not easy because this is described as a non-lineal system of parameters distributed and varying in time (Shahriari and Tarasiewicz, 2009; Ortiz, Suárez, and Nelson, 2005). Although some have tried to represent it as a lineal process of distributed parameters (Min-tus, Hamel, and Krumm, 2006), the most used techniques in the past decade are those derived from advanced control such as neuronal networks (Ziatabari, Fatehi, and Beheshti, 2008; Stadler, Poland, and Gallestey, 2011; Li, 2010; Liu, 2009), diffuse control (Feng et al., 2010; Xue and Li, 2010; Holmblad and 0stergaard, 1995; Wang and Kwok, 1992), expert systems (Wang, Dong, and Yuan, 2010; Wang et al., 2007; King, 1992) or the combination of several of these methods (Wang and Kwok, 1992). The model developed in Patisson, Lebas, and Hanrot (2000) calculates temperature profiles in the charge, gas and walls of the kiln, as well as the composition of the gas and the elimination of volatile elements. In this study a model is presented that is based on a balance of mass and energy in which variables are involved, such as required energy for chemical and physical transformations needed to obtain the desired product (clinker). The chemical transformations involved are related to the oxidation process of the elemental components of fuel and oxides obtained in the clinker. Physical transformations are changes in the state of water in the cooling system and water in the paste that feeds the kiln; thermodynamic variations such as air and fuel enthalpies. The model is obtained from variables that are measured and monitored by means of a centralized control system in the plant, laboratory data and identified counters in the process. Additionally, two statistical tools were presented to determine improvements in the adjustment methods used and the performance index of the model. This document is organized as follows: In 1 the description of the clinkerization process and its model. In 2 the validation of the model obtained is shown. In 3 the model is checked with real data, and at final, the conclusions are presented.
1. Materials and Methods
1.1. Description of the Process
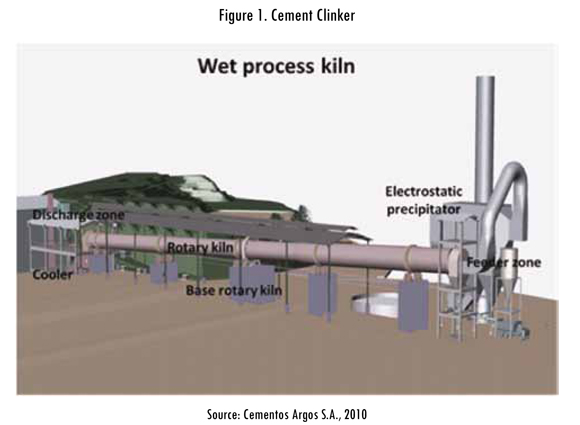
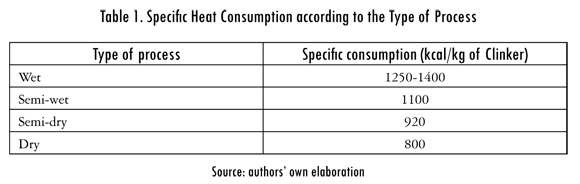
Cement is a product formed by three principal materials, setting regulator (plaster or anhydrate), additives (limestone, pozzolana and slag) and clinker. Clinker is a product formed by calcium silicates obtained from a partial fusion of a homogenous mix of materials that contain calcium oxide (CaO), silicate oxide (SiO2), aluminum oxide (Al2O3) and iron oxide (Fe2O3). The clinkerization process is performed in a clinker kiln, which has an inclination of 5%; the previously homogenized material (paste or flour, depending on a dry or wet process) is introduced in the higher end or feeding area and a fuel burner in the lower end or unloading area, as shown in Figure 1. The material is distributed in the interior of the kiln, and as it gets closer to the burner the temperature increases which allows the physical and chemical reactions required to obtain clinker in the extreme inferior part of the kiln. In the cement industry four types of productive processes are recognized according to the characteristics of the material that is fed into the kiln: in the wet process the material is fed into the kiln with a humidity of 30 to 40%; in the semi-wet process humidity is 20%; in the semi-dry process humidity is between 10 and 15% and in the dry process humidity is less than 1%. Specific heat consumption for each of the processes varies according to the process. See Table 1.
The color of the cement is another parameter that determines the type of process. The clinker for each one of these processes has particular characteristics that differentiate it from production methods and specific heat consumption; data in Table 1 correspond to clinkers for producing grey cement. For white cement the specific consumption is between 1800 and 2200 kcal/kg of clinker with the wet method. Another important difference in the production of white and grey cement is the way the clinker is cooled. The clinker for grey cement is cooled with air and it is allowed to recover heat to improve the enthalpy of air combustion, while the clinker for white cement is cooled with water, making it more difficult to recover heat to be incorporated into the process. The clinker is the primary equipment in the production of cement and is the equipment that consumes the most energy in the whole process. For that reason this equipment is installed with a large number of instruments and controls to automate its operation and make the operator's control decisions easier. Advances in industrial control systems such as Programmable Logic Controllers (PLC) or Distributed Control Systems (DCS), developments in communication networks and the increase in the capacity of data storage have made it easier to collect and store in data bases the variables of the clinkerization process. Data used in this study comes from a white cement plant using the wet process, and this data is collected using an Ole for Process Control (OPC) system, which is configured as a client-server system in an Ethernet network.
1.2. Model
To model the combustion process the principle of adiabatic flame temperature and heat use factor is used as set out in (Marquez Martinez, 1989). Equation (1) describes heat generated by combustion in terms of caloric power of the combustion; the enthalpies of fuel and air combustion; energy for clinker formation; loss due to radiation and convection; and energy to evaporate water.
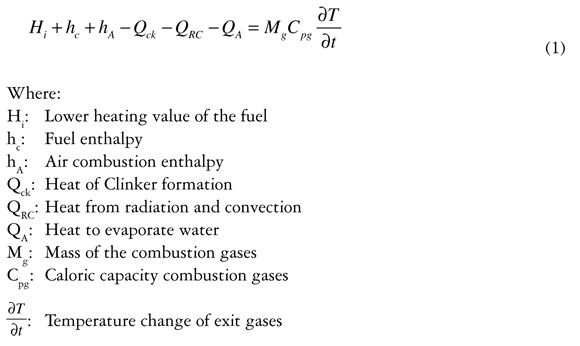
The enthalpy terms in Equation (1) are expressed in heat to homogenize the units. See Equation (2). Replacing Equation (2) in Equation (1), Equation (3) is obtained.
Heat produced by fuel is a direct relationship between the lower heating value and its mass as shown in Equation (4).

Where:
Qc: Combustion or flame temperature
Mc : Fuel mass
Hc: Lower heating value of fuel
The temperature or energy of fuel expressed initially as enthalpy is given in Equation (5).

Where:
Qec: Heat produced by fuel
Mc : Fuel mass
Cpc: Caloric capacity of fuel
Tfc: Final fuel temperature
Tic: Initial fuel temperature
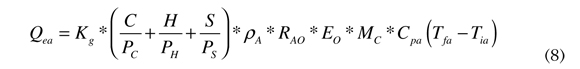
Heat produced by combustion air is given in Equation (6); this energy is due to previous heating of air that is used in combustion.

Where:
Qea: Heat producted by air combustion
Ma : Air combustion mass
Cpa: Caloric capacity of air combustion
Tfa: Final temperature of air combustion
Tia: Initial temperature of air combustion
Air mass, (Ma) is obtained from the mole balance of the stoichiometric reaction of the fuel; this is calculated from the amount of oxygen needed to oxidize the elemental compounds of the fuel, such as: hydrogen, carbon and sulphur. This reaction is volumetric and mass is reached by multiplying density, the air-oxygen relationship, excess oxygen and fuel mass. Air mass is calculated according to Equation (7).
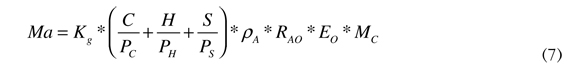
Where:
MA : Air mass
Kg : Gas constant
C: Carbon content of the fuel
H: Hydrogen content of the fuel
S: Sulphur content of the fuel
PC , PH , PS : Atomic weight of carbon, hydrogen and sulphur
PA: Air density
RAO: Air-oxygen relationship
EO: Excess oxygen
MC: Fuel mass
By replacing Equation (7) in Equation (6), heat produced by air combustion in function to the fuel mass is obtained, as seen in Equation (8).
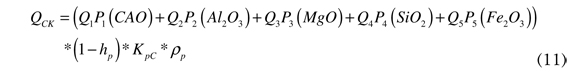
Heat required to form clinker is calculated based on a chemical balance of previously prepared raw materials, based on the formation energy of the min-eralogical compounds present in the clinker. See Equation (9).

Where:
CaO: Calcium oxide
Al2O3: Aluminum oxide
MgO: Magnesium oxide
SiO2: Silicon oxide
Fe2O3: Iron oxide
Pi: Component content
Qj: Heat of formation of the component
MP: Mass of the kiln feeding paste
The values of Pi and Qj are experimentally obtained with laboratory tests. These values are already calculated according to the type of clinker you wish to make. The chemical composition of raw materials should have the components in the required percentages for clinker formation. The paste mass (Mp), or mix that the kiln is fed with, is mud, which is made up of solid materials and water; therefore the principal parameters of this material are: humidity, density and the relationship factor between paste in a dry base and the clinker; these are used to determine the amount of solid material in a dry base and the amount of water fed into the kiln, based on Equation (10).

Where:
Fp: Volumetric flow of paste
hP: Humidity of the paste
KPC: Paste-clinker factor
Pp: Density of the paste
Replacing equation (10) in Equation (9) results in Equation (11), which expresses the amount of heat necessary to produce a unit amount of clinker depending on the flow and humidity of the feed paste to the kiln.
These kiln are not thermically isolated, and therefore there is heat radiation towards the exterior, which means a loss of energy in the process. The term QRC in equations (1) and (3) represent loss due to radiation; in this case they are considered losses due to radiation and convection. Equations (12) and (13) represent both types of losses.
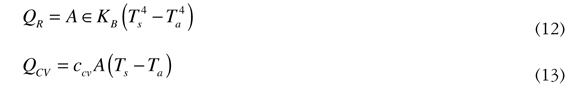
Where:
QR: Heat by radiation
A: Area of the kiln wall
∈: Emissivity
Kb : Boltzmann constant
Ts: Temperature of the shell wall
Ta: Room temperature
Qcv : Convection heat
hcv : Connective constant
Total heat lost through radiation and convection is the sum of the equations (12) and (13) and is represented by the equation (14).

In the process of clinkerization for white cement water appears in two instances; the first is in the feeding paste, and for that reason the amount of water in this part of the process is calculated from the humidity and density of the paste. The expressed used to find the mass of the water in the paste to feed the kiln is represented in Equation (15). The second instance is during the cooling of the clinker in the unloading phase, which is done in the interior of the kiln, and steam generated there travels along it. This water is measured in volumetric flow, and using density it is converted into mass, as shown in Equation (16).
Heat used to evaporate water and overheat steam is represented by the term Q. Equation (17) shows how energy used to evaporate water and overheat steam is calculated.

Where:
QA: Heat to evaporate water and overheat steam
q1: Temperature to heat water from room temperature to boiling point (heat sensitive)
q2: Heat to maintain boiling temperature (latent heat)
q3: Heat to steam, from boiling point to overheating temperature (overheating heat)
The values of q1, q2 and correspond to the state equation, which does not depend on the trajectory but on the state of each one of the intervals of the process. Each one of the q. components is represented in Equations (18), (19) and (20)
Where:
q1: Temperature to heat water to boiling point
q2: Temperature to maintain boiling point
q3: Temperature to overheat steam to maximum temperature
kc: Caloric capacity of water
ke: Caloric capacity of steam
MA : Mass of water to heat
TE: Boiling temperature
TA: Room temperature
TV: Overheated steam temperature
Replacing Equations (18), (19) and (20) in Equation (15) we obtain the expression to calculate the amount of heat needed to evaporate water and to overheat steam to temperatures above one hundred degrees. See Equation (21).

In Equation (21) the term MA is the sum of the amounts of water that are introduced in the kiln to feed the paste, Equation (15), and for the cooling system, Equation (16). The right side of the Equation (1) is the caloric energy that the exit gases take after having used all the caloric energy of the fuel in the clinker production process; these gases are the result of combustion and their mass directly depends on the amount of combustible that was transformed in the process. For that reason the mass of those gases is calculated by the mole type chemical balance, similar to that used for Equation (7). The expression to calculate the mass of the exit gases is presented in Equation (22).
Where:
Mg : Mass of the gases
Kg : Constant of the gases
C: Carbon content of the fuel
H: Hydrogen content of the fuel
S: Sulphur content of the fuel
PC, PH, PS : Atomic weight of carbón, hydrogen and sulphur
PG: Density of gases
RAO: Air-oxygen relationship
EO: Excess oxygen
MC: Mass of fuel
Equations (4), (5), (8), (11), (14), (21) and (22) are replaced in Equation (3) resulting in an expression according to mass and volumetric flows, temperatures and excess oxygen; these are the variables that are measured in the process. The model implemented in MATLAB/SIMULINK contemplates the flow entering as a derivative and therefore, is integrated to find instant values.
2. Results
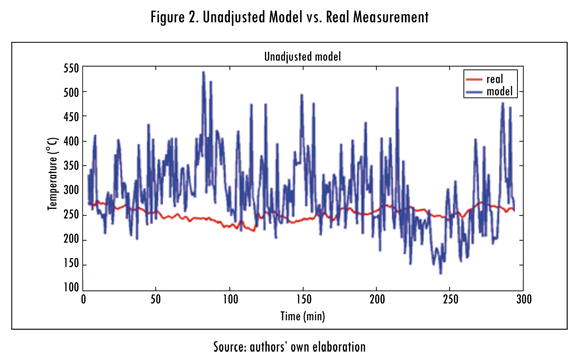
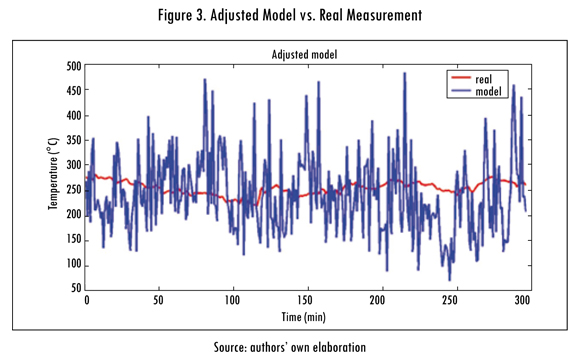
The unadjusted model (SA) is produced with data measured in real entrance variables and the results are presented in Figure 2. Later model (A) is adjusted using least squares (Ortiz-Valencia, Ramírez-Echavarría, and Cardona Rendón, 2011) and the results obtained are observed in Figure 3.
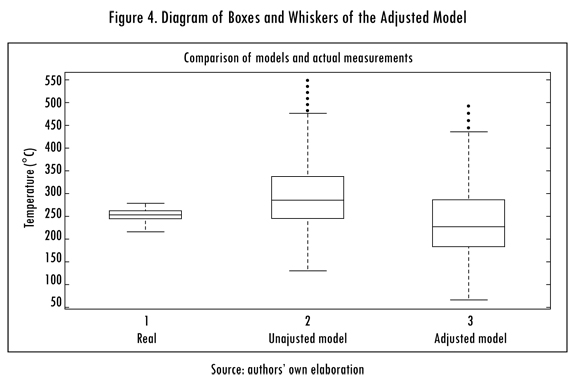
A statistical diagram measurement such as a boxes and whiskers diagram is used to determine the quality of the obtained results, both for the unadjusted model as well as the adjusted model for least squares. The results are shown in Figure 4; in these it can be seen that the medium ones and the end of the boxes diminished for the adjusted model as compared to the unadjusted model. The other important observation is how close the medium ones and the whiskers of the adjusted model were in relation to the real measurement, but the adjusted model presents many values outside of the whiskers, indicating that these values can be affected by noise in some of the entrance variables. The analysis of the results of the diagram statistical methods gives an idea of how model data behaves compared with real measurement data, but a performance measurement is not given that determines the validity of the model.
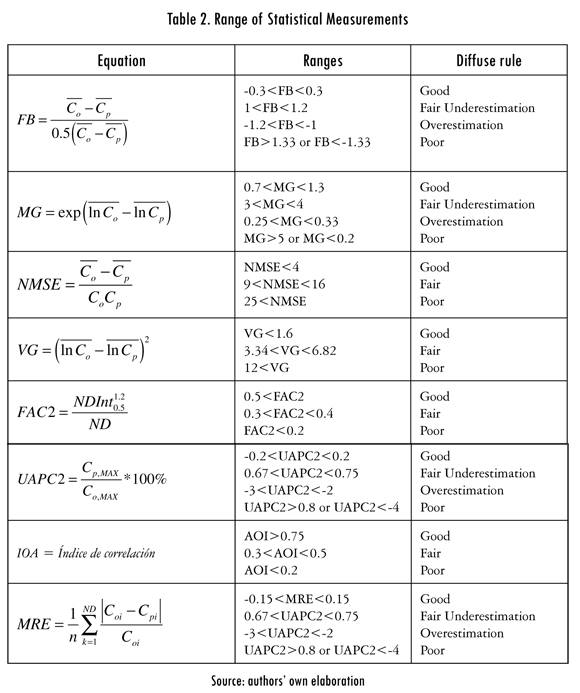
To measure the performance of the model before adjustment, after adjustment and during the validation, the method cited in (Park and Seok, 2007) was used, which consists of measuring eight statistical metrics, which are interrelated by a fuzzy type of function. The metrics used are Fractional Bias (FB), Normalized Mean Square Error (NMSE), Geometric Mean (MG), Geometric Variance (VG), FAC2, Index of Agreement (IOA), Unpaired Accuracy of Peak (UPAC2), Mean Relative Error (MRE). The way they are calculated and the intervals for the diffuse functions are determined is shown in Table 2.
To calculate the performance index, Equation (23) is applied in which a weight is given to each one of the fuzzy rules in each one of the aforementioned metrics.

Where:
ID: performance index of the model against measured data
NG: Number of metrics with Good quality
NF: Number of metrics with Fair quality
NOF: Number of metrics with Over Fair quality
NUF: Number of metrics with Under Fair quality
NP: Number of metrics with Poor quality
The observed or real data Co is in Table 2, Cp is the prognostic data for the model and ND is the number of total data. The method is consistent for the performance due to the probabilistic nature of the metrics used.
In Table 3 the results obtained by this method for the model in question can be seen.
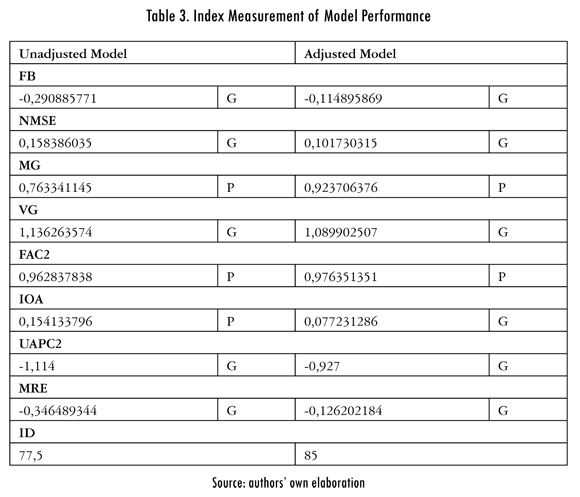
As can be seen, the performance index (PI) changes by adjusting the model, since it went from 77.5 to 85. This validates what is observed in the box and whiskers diagram. Additionally, it is observed that the IOA metric (index of agreement) goes from poor (P) to good (G) when the model is adjusted for least squares, the MG and FAC2 metrics continue poor (P) and only a slight improvement is found in its values.
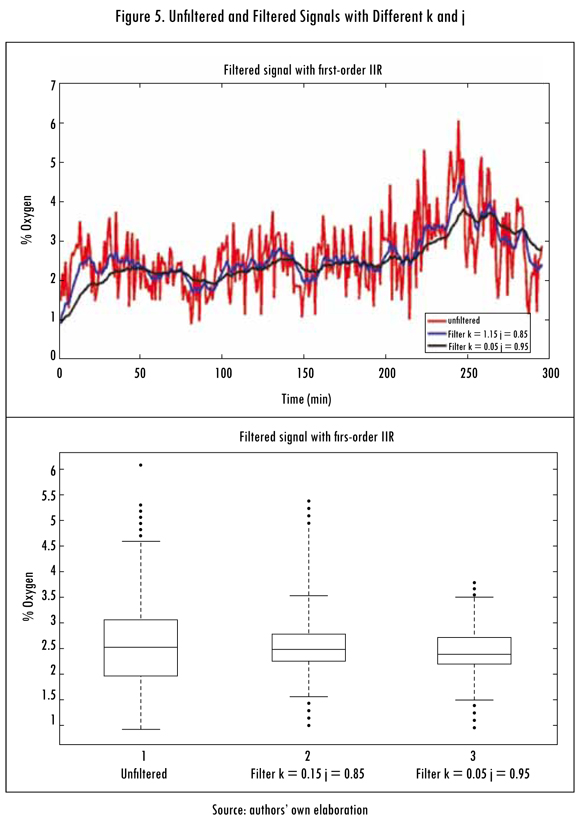
In Figures 3 and 4 the behavior of signals generated by the unadjusted and adjusted models, respectively, are shown. These signals have a high noise content proceeding from entrance variables measured in the field, noise from the process sensors themselves. To filter that noise there are many alternatives; the most used filters are Kalman filters (Kalman, 1960), Wiener filters (Zakai, 1959), the Infinite Impulse Response (IIR) (Cheng, Izadi, and Chen, 1995) digital filters and the Finite Impulse Response (FIR) (Evans, 1993) digital filters. In this study a first order IIR digital filter was used and its transference function was shown in Equation (24). The k+j=1 condition guarantees the stability of the filter, since it forces the pole to be within the unit circle of the geometric place in the z domain.
To see the performance of this filter, a rather noisy and unstable signal was used in the clinkerization process, such as oxygen. Figure 5 shows signals obtained with and without filters and their respective box and whisker diagrams, with different j and k values.
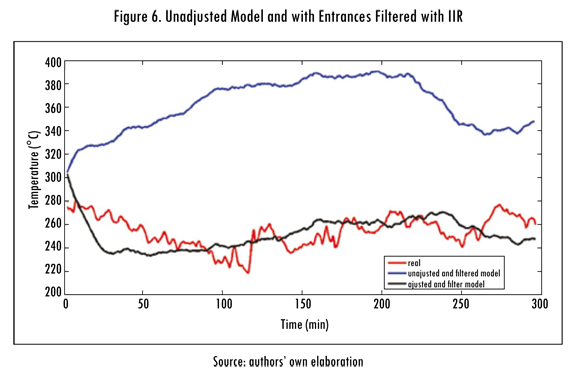
In Figure 6 the exit temperature signals of the adjusted (A) and unadjusted (SA) model are shown after applying the IIR filter on all the entrance signals of the model. To determine the effect of the IIR filters, the same presented statistical methods are used and with unfiltered models.
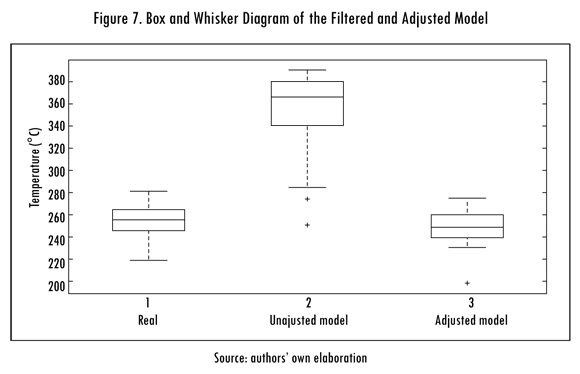
In Figure 7 the boxes and whiskers diagrams are shown for exit signals, obtained with the filtered entrance signals (F) using IIR filters and then, adjusting with least squares, the results obtained with the real signal are compared and an improvement of the obtained data is seen for the model that is filtered with IIR and adjusted with least squares.
The performance indexes of the models are observed in Table 4. These indexes numerically show the improvement of the model each time it is adjusted by least squares and the entrance signals are filtered.
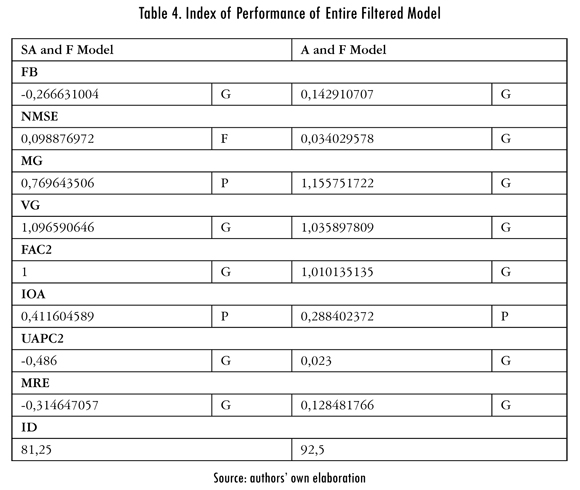
By analyzing the qualities of the statistical metrics used, changes are observed each time the model is adjusted. Comparing tables 3 and 4, it can be seen that the unadjusted model's MG, FAC2 and IOA metrics were poor (P). After making the adjustment for least squares, the metrics that had a poor qualification are MG and FAC2, improving to a qualification of good in the IOA metric. The unadjusted model with filtered entrance variables shows MG and IOA metrics in poor, improving the FAC2 metric. For the model with filtered entrances and adjusted with least squares, the metrics that are improved to good are MG and FAC2; and the only poor metric is IOA. The above shows that each time the model is adjusted, an improvement in the performance is obtained, and if simultaneous improvements or adjustments are made, improvements in the same number of metrics are obtained.
3. Model Verification
To verify the model a series of data corresponding to other operation dates of the kiln were used, different than those used to validate the model; these are applied to the previously found model. The results obtained for data from April 2010 (verification 1) and August 2012 (verification 2) are presented in Table 5 and Figures 8 and 9.
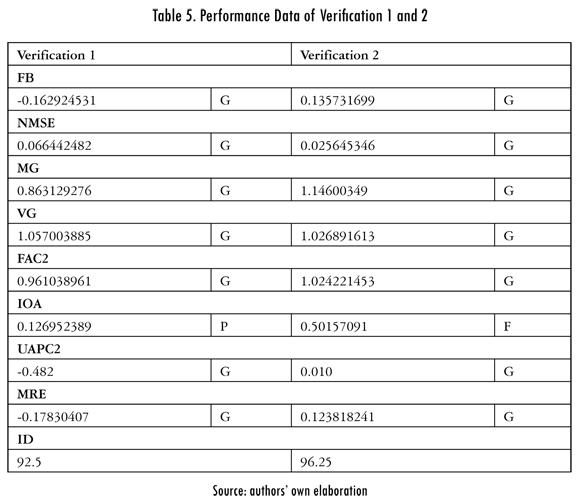
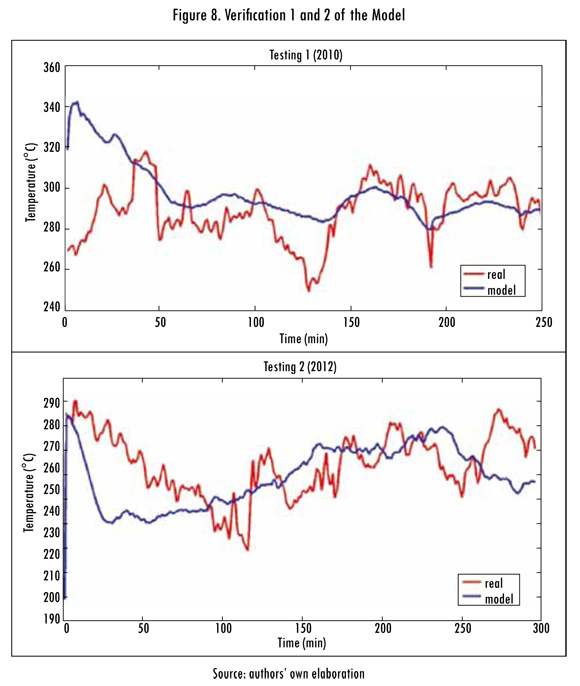
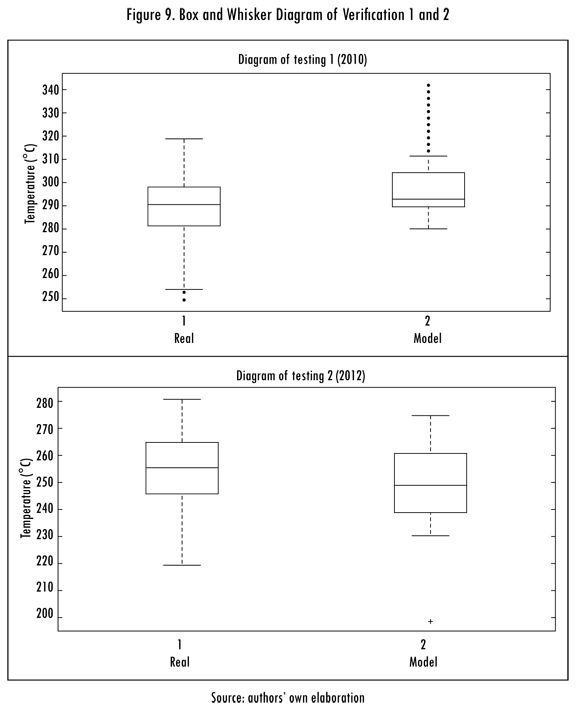
Table 5 confirms that presented above in relation to poor or fair metric quantifications (IOA) for the model and is consistent with the results obtained with the modeling method used in the kiln's combustion process. Upon verifying this, it was reconfirmed that in reference to high noise or instability variables such as oxygen, the calorific power, or temperature in the shell of the kiln.
Performance indexes of the model obtained show that the model satisfactorily represents the kiln's combustion process, which allows the use of this model to design controls to optimize kiln operation and its combustion system.
Conclusion
This work represented a method to model the combustion system of a cement kiln using an energy balance. The model obtained is complete and in the time dominion; it was adjusted using least squares and IIR digital filters whose implementation in the discreet domain is simple. The methods used to measure model performance were box and whisker diagrams and a method of eight related statistical metrics for a fuzzy function. The application of these methods shows improvements were obtained each time adjustments to the model were applied. The poor results in some statistical metrics were due to error introduced in the model when taking variables such as room temperature, the temperature of the kiln shell, the humidity of the paste and the calorific value of the fuel as constants. The kiln model obtained will be used to design a fractional order controller for the combustion process.
References
CHENG, Y; IZADI, I. and CHEN, T. On IIR filter design. n. d., 1995. [ Links ]
EVANS, J.B. An efficient FIR filter architecture [document on line]. 1993. < http://www.ittc.ku.edu/Projects/FPGA/Fast_Filters.pdf> [ Links ]
FENG, G.; BIN, L.; XIAOCHEN, H. and PENG, G. Research on the fuzzy predictive control for calcining temperature of the rotary cement kiln. IEEE 10th International Conference on Signal Processing Proceedings. 2010, pp. 2568-2571. [ Links ]
HOLMBLAD, L.P and 0STERGAARD, J.-J. The FLS application of fuzzy logic. Fuzzy Sets and Systems. 1995, vol. 70, no. 2-3, pp. 135-146. [ Links ]
KALMAN, R.E. A new approach to linear filtering and prediction problems 1. Journal of Basic Engineering. 1960, vol. 82, no. Series D, pp. 35-45. [ Links ]
KING, R.E. Expert supervision and control of a large-scale plant. Journal of Intelligent Robotic Systems. 1992, vol. 5, no. 2, pp. 167-176. [ Links ]
LI, Z. Support Vector machine model based predictive PID control system for cement rotary kiln. System. 2010, pp. 3117-3121. [ Links ]
LIU, J. Temperature control in big-scale rotary kiln by using grey neural network. Network. 2009, pp. 723-728. [ Links ]
MARQUEZ MARTINEZ, M. Combustión y quemadores. Barcelona: Marcombo, 1989. [ Links ]
MINTUS, F.; HAMEL, S. and KRUMM, W Wet process rotary cement kilns: modeling and simulation. Clean Technologies and Environmental Policy. 2006, vol. 8, no. 2, pp. 112-122. [ Links ]
ORTIZ, O.; SUAREZ, G. and NELSON, A. Dynamic simulation of a pilot rotary kiln for charcoal activation. Computers & Chemical Engineering. 2005, vol. 29, no. 8, pp. 1837-1848. [ Links ]
ORTIZ-VALENCIA, P.A.M RAMÍREZ-ECHAVARRÍA, J.L. and CARDONA-RENDÓN, L. Modelo matemático y control de un sistema de fluidos. Medellín: Instituto Tecnológico Metropolitano, 2011. [ Links ]
PARK, O. and SEOK, M. Selection of an appropriate model to predict plume dispersion in coastal areas. Atmospheric Environment. 2007, vol. 41, no. 29, pp. 6095-6101. [ Links ]
PATISSON, F.; LEBAS, E. and HANROT, F. Coal pyrolysis in a rotary kiln: Part II. Overall model of the furnace. ... Materials Transactions B. 2000, vol. 31, no. April. [ Links ]
SHAHRIARI, K. and TARASIEWICZ, P.E.S. A model-based approach for clinker rotary kiln monitoring and instrumentation. 2009 IEEE Cement Industry Technical Conference Record. 2009, pp. 1-11. [ Links ]
STADLER, K.S. ; POLAND, J. and GALLESTEY E. Model predictive control of a rotary cement kiln. Control Engineering Practice. 2011, vol. 19, no. 1, pp. 1-9. [ Links ]
WANG, C.; WANG, S.; YU, G. and LI, X. Application research of a fault diagnosis expert system for cement kiln based on .Net Platform. 2010 Second International Conference on Intelligent Human-Machine Systems and Cybernetics. 2010, no. 8, pp. 208-212. [ Links ]
WANG, IP and KWOK, D.P Analysis and synthesis of an intelligent control system based on fuzzy logic and the PID principle. Intelligent Systems Engineering. 1992, vol. 1, no. 2, p. 157. [ Links ]
WANG, S.; DONG, F. and YUAN, D.F. The design and implementation of a cement kiln expert system. 2007 IEEE International Conference on Automation and Logistics 2007, Jian, China, pp. 2716-2719. [ Links ]
XUE, Z. and LI, Z. Design of fuzzy neural network based control system for cement rotary kiln. 2010 2nd International Asia Conference on Informatics in Control Automation and Robotics CAR 2010, 2010, pp. 290-293. [ Links ]
ZAKAI, M. On a property of Wiener filters. n. d.: 1959. [ Links ]
ZIATABARI, J.; FATEHI, A. and BEHESHTI, M.T.H. Cement rotary kiln control: A supervised adaptive model predictive approach. In: India Conference 2008 INDICON 2008 Annual IEEE 2008, pp. 371-376. [ Links ]
