


Servicios Personalizados
Revista
Articulo
 Inglés (pdf)
 Articulo en XML
 Referencias del artículo
 Enviar articulo por email
Indicadores
-
 Citado por SciELO
 -
 Accesos
Links relacionados
-
 Citado por Google
 -
 Similares en
SciELO
Similares en
SciELO -
 Similares en Google
Compartir

 Permalink
Ingeniería y Universidad
versión impresa ISSN 0123-2126
Ing. Univ. vol.18 no.2 Bogotá jul./dic. 2014
https://doi.org/10.11144/Javeriana.IYU18-2.cvso
Computer Vision System for the Optimization of the Color Generated by the Coffee Roasting Process According to Time, Temperature and Mesh Size1
Sistema de visión computacional para la optimización del color generado por el proceso de tostado del café en función del tiempo, la temperatura y el tamaño de malla2
Jimy Oblitas Cruz3
Wilson Castro Silupu4
1Reception date: June 27th, 2013. Acceptance date: July 31st, 2014. Work carried out by research group in Aplicaciones de Visión Artificial en la Industria.
2Fecha de recepción: 27 de junio de 2013. Fecha de aceptación: 31 de julio de 2014. Trabajo desarrollado por el grupo de investigación en Aplicaciones de Visión Artificial en la Industria.
3Agro-industrial Engineer, postgraduate in Microbiology and Food Technology, Universidad Privada del Norte, Perú. E-mail: jimy.oblitas@upn.edu.pe.
4Agro-industrial engineer, postgraduate in Engineering and Food Technology, Universidad Toribio Rodríguez de Mendoza, Perú. E-mail: ing.wilsoncastro@hotmail.com.
How to cite this article
OBLITAS CRUZ, J. and CASTRO SILUPU, W. Computer Vision System for the Optimization of the Color Generated by the Coffee Roasting Process according to Time, Temperature and Mesh Size. Ingeniería y Universidad. 2014, vol. 18, no. 2, pp. 355-368. http://dx.doi.org/10.11144/Javeriana.IYU18-2.cvso
Abstract
This article describes the implementation of a computer vision system to determine the effect of time and temperature on the color generated by the roasting of coffee, for which a software tool in the mathematical software Matlab, previously parameterized using color data for the roasting process was developed and implemented. The color was measured in CIEL*a*b* space and the data were analyzed using the statistical response surface design. The result of this work is a system that allows for realtime sensory information about color and therefore has an advantage over existing traditional systems. The study shows that computer vision system could distinguish different shades during roasting of coffee depending on process parameters and good capacity for generalization.
Keywords: computer vision system; CIEL*a*b*
Resumen
En este artículo se presenta la implementación de un sistema de visión computacional para determinar el efecto del tiempo y la temperatura en el color generado por el tostado del café, para el cual se desarrolló e implementó una herramienta informática en el sofiware matemático Matlab, previamente parametrizado usando datos del color durante el proceso de tostado, obete. El color se midió en el espacio CIEL*a*b* y los datos se analizaron usando el diseño estadístico de superficie de respuesta. El resultado del trabajo es un sistema que permite obtener información sensorial en tiempo real sobre el color y, por lo tanto, tener una ventaja sobre los sistemas tradicionales existentes. El estudio muestra que el sistema de visión computacional pudo diferenciar tonalidades diferentes durante el tostado de café en función de los parámetros del proceso y buena capacidad para la generalización.
Palabras clave : sistema de visión artificial; CIEL*a*b*
Introduction
In the food industry, the quality of roasted coffee is evaluated off-line using different parameters (mainly aroma, flavor, color, pH, bean pop, mass loss, and volume). However, in such an industrial setting, it is very difficult to estimate these parameters on line, and in most cases the roast master has an essential role to play. The operating conditions are determined by the roast master based on off-line measurements obtained on the previous batch (color, aroma, flavor, etc.), and then adjusts the roasting parameters (air temperature and duration of the process) for the next batch accordingly (Hernández et al., 2008). Therefore, the external quality control and classification system in the pre-process phase is very important and necessary (Teena et al., 2013) to get the expected color.
The color inspection has been used as an indirect measure of some internal quality attributes such as maturity, freshness, variety and convenience, and safety (Pathare et al., 2013; Wu and Sun, 2013). Color is the most basic information that is stored in pixels, and contains the basic visual information in the images corresponding to human vision (Zheng, Sun, and Zheng, 2006), because the cameras in traditional colors mimic human vision. Therefore, the color inspection is performed using a traditional computer vision system.
Computer vision is an engineering technology that combines mechanics, optical instrumentation, electromagnetic sensing, digital video and image processing technology (Patel et al., 2012). And it is the science responsible for the study and application of methods which enable a computer to understand the content of an image, and this interpretation involves the extraction of certain characteristics which are important for a given aim (Gomes and Leta, 2012).
Based on the above and bringing this issue to our reality, this research focused on estimating and analyzed by computer vision changes in the characteristics of roasted coffee when the temperature, time and mesh size is varied.
1. Materials and Methods
For this project, coffee of a variety typical from Rodriguez de Mendoza was used, with 12% moisture, which was beaten, selected, roasted and grounded at the roasting plant in the Agricultural Cooperative Rodríguez de Mendoza.
Also, different equipment and materials were used during each test as coffee peelers, moisture meters, sieves, toaster, mill, sifter, light meter and imaging system. The experimentation development was divided into the following stages:
1.1. Hardware Design and Construction
Based on the specifications, in terms of lighting for the selection/classification process, was designed and built in the food industry (Garcia and Ayuga, 1993) a system capable of providing a total of 2000 lumen in constant flow using halogen lamps. To capture the image by webcam and connected to a desktop.
The method used allowed imaging of samples of uniform and non-uniform food with light and dark colors, averaged in coordinates CIE-L*a*b*.
1.2. Matlab Software Development
For this project the Matlab v7.5 software was used with Toolboxes for image acquisition and processing, which allows applications due to its graphical programming. Also adapts easily to hardware (USB cameras), and has applications designed for image processing, which is the aim of this work.
1.3. Obtaining Samples of Roasted Coffee
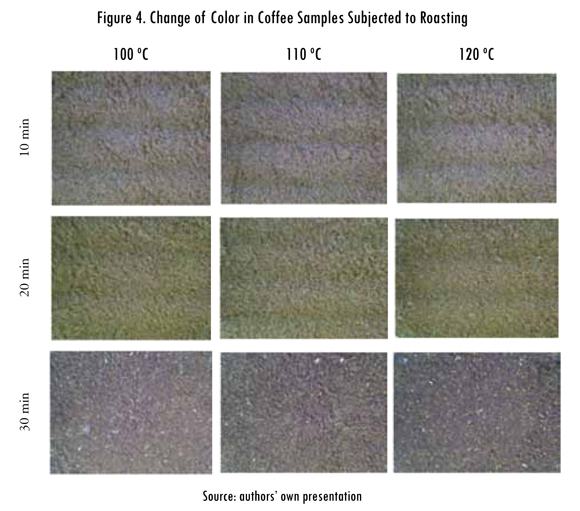
The samples subjected to color evaluation were parchment coffee from the typical variety from the stores of Cooparm, which previously dried approaching 12% humidity to be peeled, was ranked with mesh size #15 and selected by quality 5% default (coffee for export). Then be toasted at 100 °C, 110 °C and 120 °C for 10, 20 and 30 min. Once toasted it was grinded and sieving in mesh # 10, # 50 and # 100. In total 45 samples were obtained.
1.4. Image Acquisition and Processing
Preliminary tests were performed to calibrate the imaging system, tuned, preconditioned and encoded samples in petri plates were placed in the system, homogenizing the sample surface at a distance of 8 cm from the webcam. All samples were placed on high white sheet to create an environment with color and reflectance that would not affect the color appearance of the samples for differences in tone and luminosity, taking into account the color perception can change depending on color distribution in the environment (Escofet et al., 2005).
In geometry conditions, the directions of illumination/observation of 45°/0° were considered, distance of illumination angle of 15 cm, distance of the observation angle of 8 cm, set web camera in auto photography, balancing fluorescent white, 0.3 mega pixels. The imaging acquisition software of the coffee samples was initiated, the samples were stored in JPEG format and for each sample was determinate the sample media of the CIE-L*a*b* coordinates.
1.5. Statistical Analysis
After having obtained the numerical values of the color space CIE-L*a*b* these were tabulated and processed in the statistical software Statgraphics Centurion, in which the influence of the variables of time and temperature on the color components L * b * was assessed. Surface design was used for this response.
2. Results
2.1. Hardware Construction
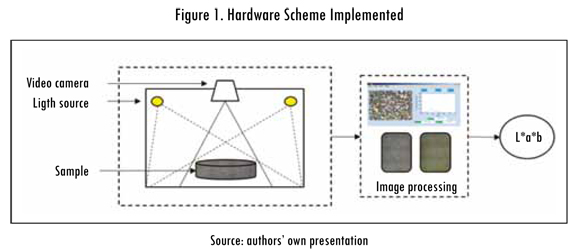
The hardware shown schematically in Figure 1 was designed and built for this research providing the characteristics of the computer vision system. This is powered with alternating current at 220 v for the light and a computer with a USB port for web camera. On that computer the Matlab software was installed to load the application.
2.2. Main Flowchart
Figure 2 shows the main flow chart that explains the sequence of steps that were performed during the execution of the program.
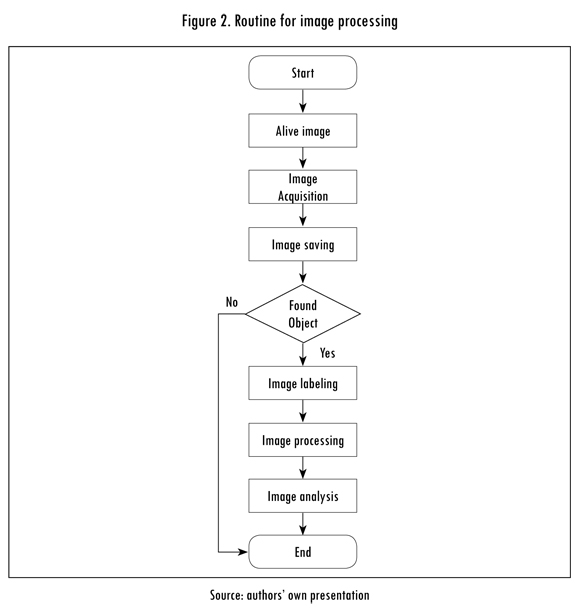
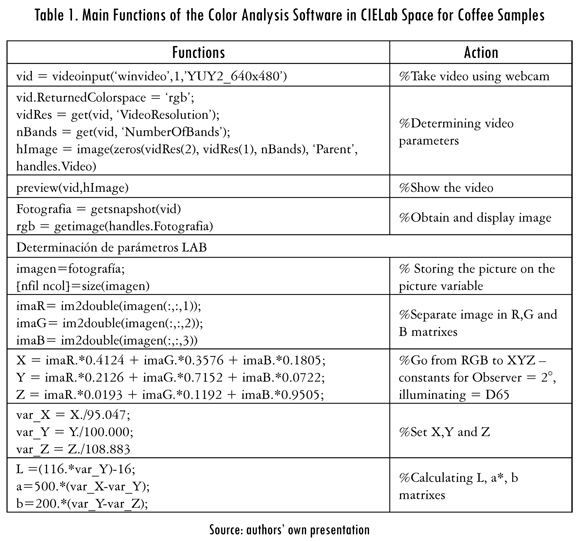
Table 1 shows the main functions used for the image acquisition system programming and translation to CIElab language.
2.3. Image Acquisition and Processing
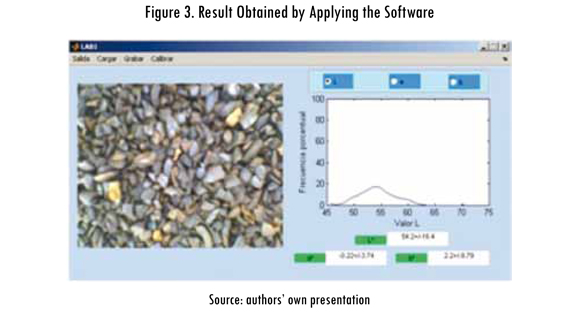
The operating system is implemented and used to develop coffee test samples subjected to treatments according to the experimental design for the response surface. Screen software is shown in Figure 3.
2.4. Process Optimization according to Temperature, Time and Number of Mesh
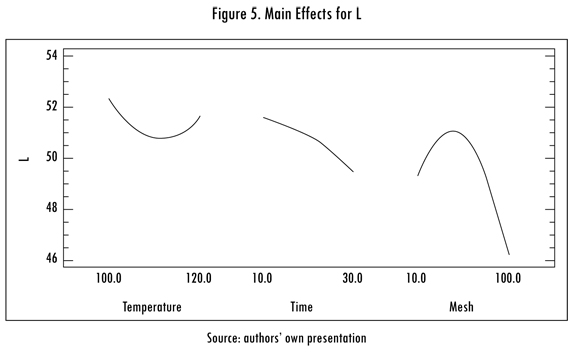
An experiment with an array of Response Surface for temperature (100 - 120 °C), time (10 min - 30 min) and mesh size (# 10 - # 100) was designed and measured in equipment designed above, obtaining results appropriately and analyzed according to the proposed design, the results are shown in Figure 5, where one can appreciate that the values of L decreases with increasing time in the other two variables, has a tendency in U.
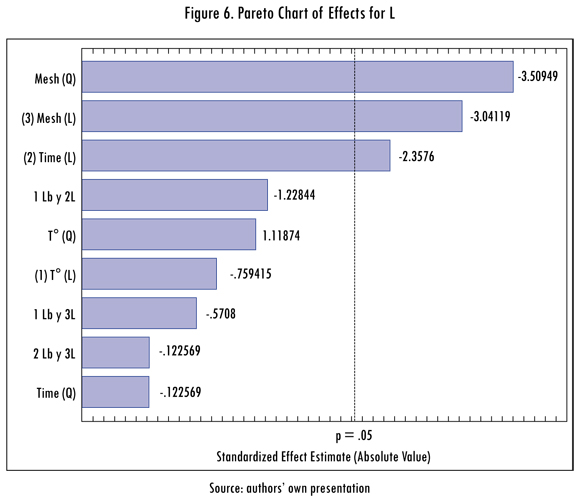
In the ANVA found and shown graphically in Figure 6, we can see that the opening of the mesh and time is having a significant effect on the value L.
According to data obtained from images of coffee samples, the response surface estimation was generated for the elements evaluated of the CIE-L*a*b* space. Figure 7 shows the shape that takes the luminance according to time, temperature and mesh, observing that as these are greater the value of L decreases agreeing with the color change to dark tones.
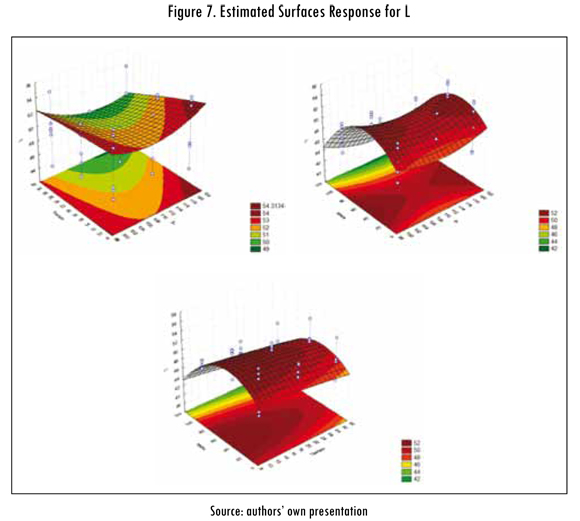
Using the Statgraphic Centurion Software we find the regression equation that has fitted to the data. The equation of the adjusted model is:
L = 168.99200 - 2.37372*T + 1.03663*t + 0.21904*M + 0.01164*T^2 -0.00913*T*t - 0.00072*T*M - 0.00330*tΛ 2 - 0.00017*t*M - 0.00155*MΛ2
By optimizing the response and maximizing variable L we obtained an optimum value of 53.5847, this is obtained with the following combination (Table 2).

3. Discussion
Color is the most used parameter to set the roasted level of coffee, as result of this research work, we found out that this system can be used when evaluating the quality of the final product. For the measurement of color in coffee there is specific instrumentation, commercial colorimeters developed exclusively for this application (Jiménez et al., 2011).
One of the most important changes in coffee beans during roasting is the color, developing a distinctive brown color due to the reactions of non-enzymatic browning that take place during the process, as the Maillard or caramelisation reactions (Sacchetti et al., 2009). Therefore, the color of the coffee beans and the soluble coffee obtained from them varies considerably depending on the degree of toasting to which the green beans are subjected, making it possible to evaluate these changes spectrophotometrically by determining the parameters CIELab (Lopez-Galilea et al., 2006; Summa et al., 2007) and assessing changes in absor-bance at the wavelengths characteristic of the compounds taking place during the reactions taking place in the coffee roasting process (Adams et al., 2005).
The system used shown in Figure 1 preformed adequately under the lighting and distance conditions of the object related to the camera, with this a useful test was performed to measure the color inside the boundaries of the application by reducing the complexity of the system and runtime. The parameters of this design match studies on artificial vision (Escofet et al., 2005). One of the most difficult tasks in the generation of software was the image segmentation but it was properly managed, this corroborates what Brosnan and Sun (2004) reported on the image processing and analysis which relies heavily on the accuracy of the image segmentation.
Brightness is a crucial factor in determining the quality of coffee during the roasting process and the proposed model allows the online calculation of this parameter, based on cooking time and temperature of the grain as is calculated using a semi-empirical dynamic model that takes into account physical laws (Heyd et al., 2007; Hernández et al., 2007).
The values of the CIELab parameters were analyzed with the surface response model and the Pareto diagram is presented in Figure 6 for the L parameter. It was observed that, with increasing the degree of browning of the samples, the value L* decreased (samples were less bright) and a* and b* values increased (samples tended toward more red and yellow in coloring axes). The data obtained were compared with existing literature which discusses the effects of roasting on the coffee color (Sacchetti et al., 2009; Summa et al., 2007; López-Galilea et al., 2006).
All authors agree with the results obtained in terms of loss of light in roasted coffee. If we compare the samples obtained from the same coffee, in all three cases it was observed that there were significant differences between the values obtained for the different samples, behaving in a similar way for the three types of coffee.
Conclusions
The results allow the development of a new tool for measuring the color of roasted coffee and this system allows obtaining real-time sensory information about the color and, therefore, to have an advantage over existing traditional systems. The study shows that the computer vision system could distinguish different shades during roasting of coffee depending on process parameters and shows a good capacity for generalization.
Furthermore it was shown that data provided by the system can be used to estimate the optimum values found for the variable L, so it's utility to show technological parameters depending on the needs of the industry is demonstrated.
Therefore, the system developed can allow the implementation of systems for determining the quality and take technological decisions online on coffee-related industrial plants.
References
ABAD, L. Supply and demand of coffee and its dependence on the international market. Lima: Universidad San Martín de Porres, 2003. [ Links ]
ADAMS, A.; BORRELLI, R.; FOGLIANO, V. and DE KIMPE, N. (2005). Thermal degradation studies of food melanoidins. Journal of Agricultural and Food Chemistry. 2005, vol. 1, no. 10, pp. 4136-4142. [ Links ]
BROSNAN, T. and SUN D.-W Improving quality inspection of food products by computer vision: a review. Journal of Food Engineering. 2004, vol. 61, pp. 3-16. [ Links ]
COMMISSION INTERNATIONALE DE L'ÉCLAIRAGE. Colorimetry (2da ed.). Vienna, Austria: Central Bureau of the CIE, 1986. [ Links ]
ESCOFET, J.; MILLÁN, M.S.; NAVARRO, R. and NESTARES, Ó. Device and computer vision procedures to measure and characterize the distribution of color in a sample [document on line]. Barcelona, 2005. <http://digital.csic.es/bitstream/10261/8398/1/2208076_B1.pdf > [consulta: 01-09-2012] [ Links ].
HERNÁNDEZ, J.A.; HEYD B. and TRYSTRAM, G. Predicition of bringhtness and surface area kinetics during coffee roasting. Journal of Food Engineering [article on line]. 2008. <http://www.deepdyve.com/lp/elsevier/prediction-of-brightness-and-surface-area-kinetics-during-coffee-20rievI0Kn> [consulta: 06-01-14] [ Links ].
HERNÁNDEZ, J.A.; HEYD, B.; IRLES, C.; VALDOVINOS, B. and TRYSTRAM, G. Analysis of the heat and mass transfer during coffee batch roasting. Journal of Food Engineering. 2007, vol. 78, pp. 1141-1148. [ Links ]
HEYD, B.; BROYART, B.; HERNÁNDEZ, J.A.; VALDOVINO-TIJERINO, B. and TRYS-TRAM, G. Physical model for the heat and mass transfer in the coffee roasting. Drying Technology. 2007, vol. 61, no. 6-7, pp. 212-222. [ Links ]
GARCÍA, E. and AYUGA, F. Design and construction of food processing industries (1st ed.). n. p.: Mundi Prensa, 1993. [ Links ]
GOMES, J.F.S. and LETA, F.R. Applications of computer vision techniques in the agriculture and food industry: A review. European Food Research and Technology. 2012, vol. 235, no. 6, pp. 989-1000. [ Links ]
JIMÉNEZ, H.; CORREA, B.; DIEZMA, V; DÍAZ, B.; MENESES, B. and OTEROS, R. Study techniques for quality monitoring and classification of roasted coffee beans: analysis of new technologies [document on line]. Presented at VI Iberian Congress Agricultural Engineering, Portugal: Universidad de Évora. 2011. <http://oa.upm.es/9604/1/Traba-jo_Caf%C3%A9_tatiana.pdf> [consulta: 13-06-13] [ Links ].
LÓPEZ-GALILEA, I.; FOURNIER, N.; CID, C. and GUICHARD, E. Changes in headspace volatile concentrations of coffee brews caused by the roasting process and the brewing procedure. Journal of Agricultural and Food Chemistry. 2006, vol. 54, no. 22, pp. 85608566. DOI: 10.1021/jf061178t. [ Links ]
PATEL, K.K.; KAR, A.; JHA, S.N. and KHAN M.A. Machine vision system: A tool for quality inspection of food and agricultural products. Journal of Food Science and Technology-Mysore. 2012, vol. 49, no. 2, pp. 123-141. [ Links ]
PATHARE, PB.; OPARA, U.L. and AL-SAID, F.A. Colour measurement and analysis in fresh and processed foods: A review. Food and Bioprocess Technology. 2013, vol. 6, no. 1, pp. 36-60. [ Links ]
SACCHETTI, G.; DI MATTIA, C.; PITTIA, P. and MASTROCOLA, D. Effect of roasting degree, equivalent thermal effect and coffee type on the radical scavenging activity of coffee brews and their phenolic fraction. Journal of Food Engineering. 2009, vol. 90, no. 1, pp. 74-80. DOI: 10.1016/j.jfoodeng.2008.06.005. [ Links ]
SANDOVAL, Z. Characterization and classification of cherry coffee using artificial vision [document on line]. Bogotá: Universidad Nacional de Colombia, 2005. <http://www.bdigital.unal.edu.co/985/1/zulmalilianasandovalnino.2005.pdf> [consulta: 14-01-13] [ Links ].
SUMMA, C.; DE LA CALLE, M.; BROHEE, M.; STADLER, R. and ANKLAM, E. Impact of the roasting degree of coffee on the in vitro radical scavenging capacity and content of acrylamide.Joint Research Centre [article on line]. 2007. <http://publications.jrc.ec.europa.eu/repository/handle/111111111/4445> [consulta: 20-01-13] [ Links ].
TEENA, A.; MANICKAVASAGAN, A.; MOTHERSHAW, A.; EL HADI, S. and JAYAS, D.S. Potential of machine vision techniques for detecting fecal and microbial contamination of food products: A review. Food and Bioprocess Technology. 2013, vol. 6, no. 7, pp. 1621-1634. [ Links ]
WU, D. and SUN, D.W Colour measurements by computer vision for food quality control: A review. Trends in Food Science & Technology. 2013, vol. 29, no. 1, pp. 5-20. [ Links ]
ZHENG, C.X.; SUN, D.W and ZHENG L.Y Recent developments and applications of image features for food quality evaluation and inspection: A review. Trends in Food Science & Technology. 2006, vol. 17, no. 12, pp. 642-655. [ Links ]
