


Serviços Personalizados
Journal
Artigo
 Inglês (pdf)
 Artigo em XML
 Referências do artigo
 Enviar este artigo por email
Indicadores
-
 Citado por SciELO
 -
 Acessos
Links relacionados
-
 Citado por Google
 -
 Similares em
SciELO
Similares em
SciELO -
 Similares em Google
Compartilhar

 Permalink
Ingeniería y Universidad
versão impressa ISSN 0123-2126
Ing. Univ. vol.20 no.2 Bogotá jul./dez. 2016
https://doi.org/10.11144/Javeriana.iyu20-2.almr
Adaptation of the L-Moments Method for the Regionalization for Maximum Annual Temperatures in Colombia1
Adaptación del método de los L-moments para la regionalización de temperaturas anuales máximas enColombia2
Lisandro Núñez-Galeano3
Juan Diego Giraldo-Osorio4
1Scientific and technological research article. Submitted on: May 18th, 2015. Accepted on: May 2nd, 2016. This article proceed from a magister thesis in hydrosystems, Pontificia Universidad Javeriana, Colombia.
2Artículo de investigación científica y tecnológica. Fecha de recepción: 18 de mayo de 2015. Fecha de aceptación: 2 de mayo de 2016. Este artículo se deriva de una tesis de la Maestría en Hidrosistemas de la Pontificia Universidad Javeriana.
3Ingeniero Civil de la Universidad Francisco de Paula Santander, Cúcuta, Colombia. MSc en Hidrosistemas de la Pontificia Universidad Javeriana, Bogotá, Colombia. Member of the Rearch Group Ciencia e Ingeniería del Agua y el Ambiente, de la Pontificia Universidad Javeriana, Bogotá, Colombia. E-mail: ing.nunez.galeano@gmail.com
4Ingeniero Civil de la Universidad Nacional de Colombia, sede Medellín. MSc en Ingeniería Civil de la Universidad de los Andes, Bogotá, Colombia. PhD de la Universidad Politécnica de Cartagena, España. Profesor asistente, Pontificia Universidad Javeriana, Facultad de Ingeniería, Departamento de Ingeniería Civil, Grupo de Investigación Ciencia e Ingeniería del Agua y el Ambiente, Bogotá, Colombia. E-mail: j.giraldoo@javeriana.edu.co
How to cite this article:
L. Nunez-Galeano and J. D. Giraldo-Osorio, "Adaptation of the L-moments method for the regionalization for maximum annual temperatures in Colombia," Ing. Univ, vol. 20, no. 2, pp. 373-389, 2016. http://dx.doi.org/10.11144/Javeriana.iyu20-2.almr
Abstract
The present study has developed a regional frequency analysis for Annual Maximum Temperature (AMT) in the hydrographic basins of Colombia. The L-moments methodology was applied for the regionalization. Five stages were considered to apply the methodology: data analysis; the L-Moments estimation; identification of homogeneous regions; fit of probability density functions (pdf) to observed data and estimation of quantile values; and finally, the developing and drawing of regionalized maps. Overall, fifteen homogeneous regions were identified and selected for the regionalization of AMT, which meet specific criteria of homogeneity and discordance. Several pdf for regional frequency analysis were tested in order to select the best probability function. Finally, regionalized temperature maps were generated for several return periods. Using the L-Moments methodology, the regionalization procedure was done using the average of AMT as the key scale parameter. The regionalization procedure ensures, as far as possible, a coherent-basin approach: the boundaries between homogeneous regions were drawn, complying with the catchment borders.
Keywords: regionalization; L-moments methodology; regional frequency analysis; annual maximum temperature
Resumen
Para este artículo se desarrolló un análisis de frecuencia regional para las temperaturas máximas anuales (TMA) en las cuencas hidrográficas de Colombia. Se ha aplicado la metodología de los L-moments para efectuar la regionalización. Se consideraron cinco etapas para aplicar esta metodología: análisis de datos, cálculo de los L-Moments, identificación de regiones homogéneas, ajuste de funciones de densidad de probabilidad (pdf) y cálculo de los cuantiles. Por último se construyeron mapas regionalizados de TMA. Se conformaron quince regiones para la regionali-zación de la TMA, las cuales cumplieron con los criterios establecidos de homogeneidad y discordancia. Se probaron distintas pdf para el análisis regional de frecuencia, con el fin de seleccionar la mejor de ellas para el cálculo de los cuantiles. Finalmente, se trazaron mapas de temperatura máxima anual para distintos periodos de retorno. Al utilizar la metodología de los L-Moments se puede regionalizar aplicando como parámetro de escala clave el promedio de las temperaturas máximas anuales. El procedimiento de regionalización asegura, en la medida de lo posible, una aproximación cuenca-coherente: los límites entre las regiones homogéneas fueron trazados obedeciendo las divisorias entre cuencas.
Palabras clave: regionalización; metodología de los L-moments; análisis regional de frecuencias; temperatura máxima anual
Introduction
For sites with enough record length, at-site frequency analysis can be applied. However, many sites do not have information at all, or observed data with sufficient length are not available to make a reliable assessment of extreme quantiles for larger return periods [1]. In such a situation, Regional Frequency Analysis (RFA) should be used to estimate extreme hydrological events at ungauged sites. The approach of RFA is to use the attainable data from gauged sites within a homogeneous region, to compute quantiles of several return periods in ungauged sites [1]—[3]. A regional approach to frequency analysis in poorly gauged areas makes possible a significant reduction of uncertainty associated with the assessment of hydrological events with a high return period [2], [4]—[8].
The most important step in the RFA procedure is the selection/delineation of homogeneous regions [4], in other words, the process of gathering the selected stations—which have enough record length and other suitable properties— into groups that obey the hypothesis of statistical homogeneity. Whenever the grouped stations fulfill the assumption of statistical homogeneity, then RFA will take advantage of all the available information and will make reliable assessments of extreme quantiles using the fitted regional pdf [7], [8].
The L-Moments is a methodology used to estimate the parameters of regionalized pdf [9]. The L-Moments methodology summarizes the statistical properties of a data set such as location, scale, skew, and kurtosis, and its application provides advantages over conventional moments. The L-Moments, whenever they represent lineal functions of a dataset, are less sensible to extreme values in the dataset and short records then can be considered more precise and robust estimations of pdf parameters [10]. The L-moments methodology has been widely applied to perform RFA of drought [5], precipitation intensity, and annual extreme rainfall values [1], [2], [11], [12], to delineate homogeneous regions in analyses of minimum flows—low quantiles, related to low flow rates and droughts—and maximum peak flows—high quantiles, related to floods—[3], [13], for regional analysis of extreme skew surges along the coasts of UK [7], and predicted changes in high flows due to climate change [4].
In Colombia, several regionalized-analysis efforts have been undertaken: e.g. for annual maximum and minimum flows [14]—[17], monthly precipitation depth [18], and for developing rainfall IDF curves (intensity - duration - frequency curves; [19]). However, not many temperature analysis have been carried out; likely, the most important work for this variable is Poveda et al. [20], where the strong relationship between the mean annual temperature and the height above sea level in Colombia was used to develop regional equations. Without considering previous works on RFA in Colombia, still the L-moments method has not been widely used. Due to the parameter estimation advantages using L-moments, some valuable works have used the methodology for assessing pdf parameters [21]—[24]; nevertheless the L-moments has not been used in a broad regionalization process. Perhaps, UNESCO-IHP technical documents [25], [26] must be considered, where the L-moments methodology was used in a RFA process of maximum and minimum values of precipitation depth for the whole Latin American and Caribbean region, including the Colombian territory.
Considering this information, the present document faces the problem of RFA of temperature using L-moments methodology. The main procedure could be summarized as follows: (1) preparation and analysis of in-situ temperature data and database development; (2) estimation of L-moments at stations; (3) delimitation of homogenous regions; (4) fit and selection of regionalized pdf, and quantile calculation; and (5) generation of temperature maps.
1. Methodology
The RFA of AMT using L-Moments methodology was performed using 410 temperature gauge stations, which belong to Instituto de Hidrología, Meteorología y Estudios Ambientales de Colombia (IDEAM). The implemented methodology allowed drawing up several AMT maps for different return periods. A description of the used methodology is presented below.
1.1. Data Analysis
The first stage of temperature data analysis was a time series quality inspection, with the aim of building a suitable database for subsequent analyses. The first criterion for temperature station selection was record length: the data from some stations were discarded if the time series was less than 15 years long.
Another important analysis about data reliability was to identify outlier data in the previously selected temperature time series.
The preliminary analysis were conducted in three phases: (1) a visual representation of selected time-series, which included the drawing of time-series and the data histogram; (2) numerical summary of data, such as record length (initial date and final date), count of missing data, assessing of statistical parameters (e.g. both maximum and minimum value, data average, standard deviation, skewness coefficient, and kurtosis); and (3) the exploratory analysis of data distribution was performed using Box-Plot. These stages searched for a complete time-series depiction using numerical and graphical parameters, while the behavior of the time series was observed.
Finally, a preliminary analysis of time-series stationarity was performed. The analysis was conducted using the Kwiatkowski-Phillips-Schmidt-Shin test (KPSS test; [27]), where the null hypothesis is a level-stationary time series (the other option is to evaluate the stationarity around a deterministic trend, which also could be done with the KPSS test). If a particular time series was considered non stationary using the KPSS test, it should be removed from the used database.
1.2. Calculation process of L-Moments
The L-moments make up an alternative system to conventional moments in order to describe the shape of pdf [10]. The L-moments can be assessed using combinations of Probability Weighted Moments (PWM; [28], [29]), as follows:
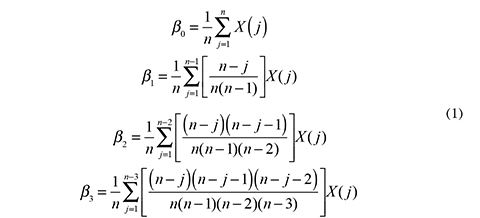
Where n is the record lenght of times series, and X(j) represent the data pf times series, arranged in increasing order (X(1 < ... < X(n)). From eq. 1general expressions for the first four L-Moments of a random variable X could be written as follows:

The first sample L-Moment l is equal to the time series average (often called L-mean or L-location parameter). If the second L-moment is scaled by the mean, then a coefficient of variability is computed (sample L-CV) as t = l2/l1. Similar to the definition and meaning of ordinary moments, a measure of shape parameters skewness (sample L-SK; t3 = l3/l2) and kurtosis (sample L-CK; t4 = l4/l2) could be obtained using L-moments [30].
Several RFA procedures have been used to fit pdf to a sample of data, associating the distribution shape to a finite number of parameters. A good summary of those procedures can be found in [10], [28], [29].
1.3. Identification of Homogeneous Regions
The key of a RFA is that in situ data from a homogeneous region can be put into a group, in order to improve the reliability of extreme quantiles assessments in each site. The homogeneous region could be a geographic area defined on a map, where the gathered sites (with data) have similar attributes which should be relevant to the modeled phenomenon [12].
In this work, the main hydrological watersheds defined by IDEAM were used as basis for homogeneous regions delineation, trying to draw "coherent-basin" homogeneous regions. The identification of homogeneous regions was done using physical variables, such as geographic location of the stations, as auxiliary variables, which is a recommendation of [29], [31]. The goal of a coherent-basin regionalization approach is to find homogeneous regions with stations, which are not only nearby, but also belong to the same catchment; in other words, the process discriminates and makes up the groups of stations into each homogeneous region using the boundaries of the main watersheds in Colombia.
Hosking & Wallis [31] provide the definition of two statistics for a homogeneity test. The first metric measures the dissimilarity, and is a discordance indicator based on L-Moments. The discordance metric in site i is computed as follows:
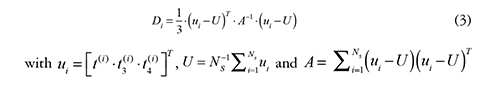
In eq. (3), Ns represents the number of stations that form a group (a homogeneous region) in the analysis; U is the group average; and A is the covariance matrix of the sample. The critical region of discordance indicator D. depends on the number of stations that form a region [9].
The second statistic (H) measures the heterogeneity of the grouped stations and evaluates whether these sites are homogenous. This statistic compares the variability of L-moments between the sites with the variability that would be expected for a homogeneous region [32].
The H statistic compares the variations of L-Moments for the Ns stations (each of the stations has a record length ni), with the expected values for the homogeneous region. The statistical estimation of H begins by assessing the regional values of L-CV (tR), L-SK (tR3) and L-CK (tR4), and its weighted standard deviation V. For example for L-CV:

In a particular region, the mean (μV) and standard deviation (σV) of V can be assessed through Monte Carlo simulations. According to [9], the H statistic is computed as follows:

A region is considered to be homogeneous if H ≤ 1, possibly heterogeneous if 2 ≤ H < 3, and heterogeneous if H > 3. However, these values are not restrictive [9], [12].
1.4. Goodness-of-Fit Test for pdf Choice
The pdf selection was conducted by using the goodness-of-fit test based on the ZD1ST. The test determines whether the measurement of the L-SK and L-CK simulated in a determined homogeneous region fit adequately to the L-SK and L-CK of the observed data points. According to [9], the expression of the ZD1ST is the following:
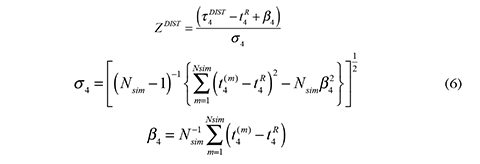
where σ4 is the standard deviation of the regional L-kurtosis; β4 is the regional L-kurtosis bias; τ4DIST is the L-kurtosis computed from the fitted distribution; and (tR4] is the regional L-kurtosis.
The eq. (6) were used to compute the ZDIST for all candidate distributions. In this study, five pdf were taken in account whose general expression can be found in [9]: Generalized Logistics (GLO), Generalized Pareto (GPA), Generalized Extreme Value (GEV), Generalized Normal (GNO), and Pearson Type III (PEIII). According to [9], the fitted pdf is acceptable or appropriate if the statistical value of ZDIST is close to zero. At this time, a reasonable value is associated with a grade of significance of 90%, in other words ZDIST ≤ 1.64.
After the pdf choice, the stage second part was estimating the quantiles or values of extreme temperature associated with a specific probability of occurrence (or return periods Tr).
1.5. Map Generation of AMT
After creating several homogeneous regions that satisfied the criteria of discordance and homogeneity, and determining which is the best pdf through the ZDIST value based on L-Moments, regional quantiles can be assessed in each station. The main goal is to draw maps of AMT for selected values of probability of occurrence, using interpolation of those values between stations.
2. Results
2.1. Data Analysis and L-moments Computation
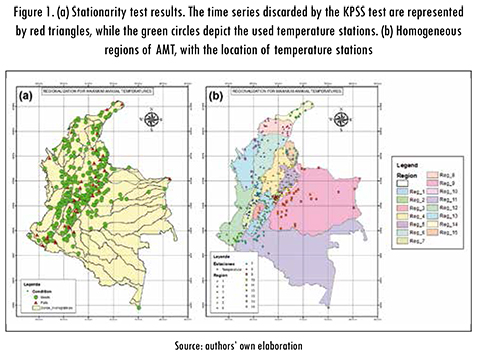
The time series of Colombian meteorological data are gathered by IDEAM. From the IDEAM's big database, 974 stations with temperature data were identified. However, 564 stations were discarded by the length criteria (> 15 years), so 410 stations were selected for subsequent analysis. Finally, 277 stations were selected in order to identify homogeneous regions, because regionalization process requirements and stationarity constrains (59 stations were discarded by the KPSS test; see Figure 1a.
Once the data were analyzed and the AMT time series were selected, the next step in the process was computing the L-Moments at each site. The regionalization suggested by [9], [31] begins calculating the L-Moments estimators, which can be done using the eq. (1) and (2).
2.2. Homogeneous Region Delimitation, pdf Selection, and Quantile Assessment
Table 1 shows several statistical values that typify the homogeneous regions: the values of maximum discordance and homogeneity (which help to identify homogeneous regions); the selected pdf and the related ZDIST value of goodness of fit test; and regional distribution parameters for the selected pdf (location, scale, and shape). The drawing of final homogeneous regions for AMT is depicted by Figure 1b.
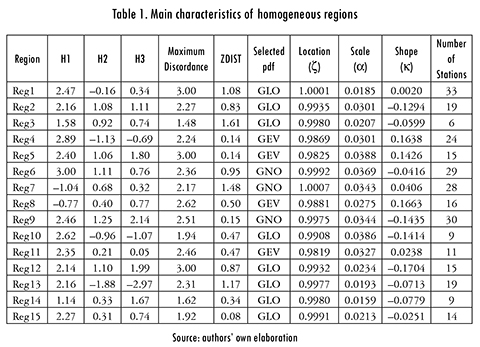
Table 2 shows an example of quantile assessment in region 3. The Region 3 has six (6) temperature stations, which have mean temperature values between 31.8 °C to 37.6 °C (location parameter in Table 2), and fulfill the homogenous regions requirements, according to Table 1. Also, Table 2 shows the values of scale parameters and shape parameters, which were fitted using the GLO distribution. With those parameter values, temperature values for several return periods were computed in each temperature station (5 to 100 years return period; Table 2).
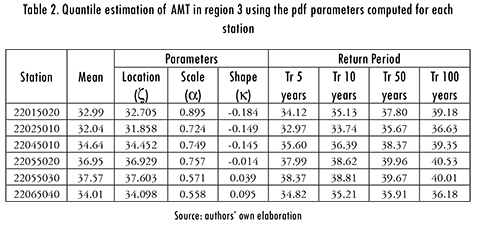
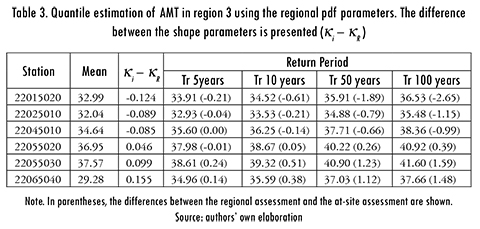
Table 3 shows the ATM assessment for several return periods in region 3, but using the regional pdf parameters. As it can be seen, the computed values with highest bias are those for high return periods, and those where the difference between the regional shape parameter KR, and the station shape parameter K, is high too.
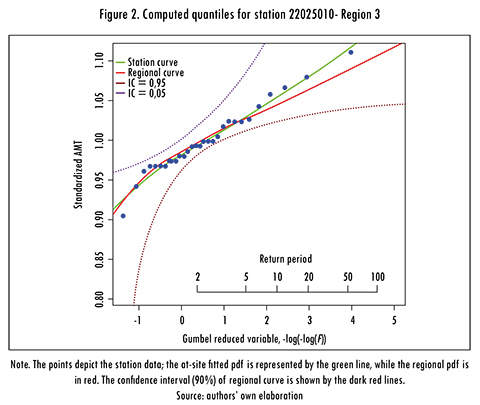
A graphical depiction of those results is presented in Figure 2 (station 22025010), together with a confidence interval that represents the fitting uncertainty of regional pdf. If the regional distribution confidence interval envelops the at-site pdf, so the regional pdf can be considered a good representation of at-site distribution. The previous analysis was performed in all the considered sites, according with bootstrapping techniques of analysis [1], [7].
2.4. Map Generation of AMT
One of the main goals of RFA analysis is to allow the estimation of variables in ungauged locations. The RFA performed in the present work was done using a coherent-basin approach: in that way, the interpolation between points was achieved using stations inside the basin, with a Digital Elevation Model (DEM) as auxiliary variable in the interpolation process (the temperature in Colombia depends mainly on elevation above sea level, due to Colombian tropical climate).
Nevertheless, the previous fact also allowed a suitable interpolation between homogeneous regions using the DEM: for example, two low altitude stations (warm climate) in different basins, but near each other, could have a watershed boundary at high altitude between them, where the temperature is relatively cold because of its height. Catching that fact in the interpolation process between homogeneous regions was possible because the DEM data were used as an auxiliary variable.
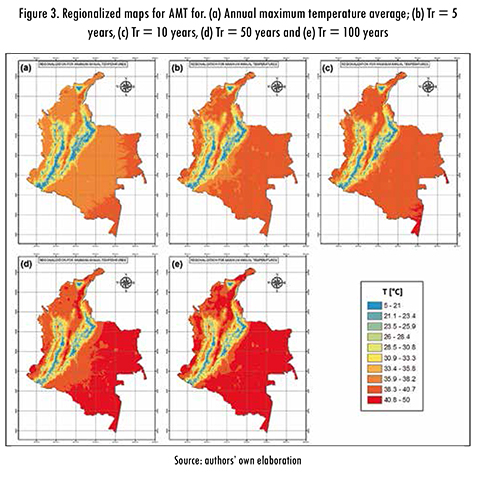
In above sections, the temperature for different return periods was computed at-site using the regionalized distribution. Then, those values were interpolated using Universal Krigging and elevation data as auxiliary variable. The computer tools used in the interpolation process were GRASS-GIS and R-software, through rgrass7 package [33]. The developed temperature maps are shown in Figure 3.
Conclusions
The L-moment methodology was implemented to perform a RFA of AMT in Colombia. Temperature stations from IDEAM were used. The scatter of IDEAM stations covers all Colombian territory; however, some sites were discarded due to short record length, non-stationary behavior of time series, etc. Finally, only 277 stations were used in the RFA process, from 974.
The RFA process identified 15 homogeneous regions. The fitted distributions were GLO (in 8 regions; mostly located along the upper Magdalena river basin and beside to Pacific Ocean), GNO (3; Cauca river basin and Colombian Orinoco river basin), GEV (4; beside the Caribbean, along the medium-low Magdalena river basin, and Colombian Amazonian river basin). Finally, PEIII did not fit any homogenous region.
The L-moments methodology allows a suitable RFA of AMT, using the mean annual maximum temperature as a key scale parameter. Also a "coherent-basin" approach for regionalization process was developed, which allowed performing a suitable interpolation of temperature values, computed for different return periods with the regionalized distributions.
Setting up new meteorological stations is recommended, particularly in vast areas like the Colombian east plains (which belong to both Orinoco and Amazonas river basins), where data scarcity and its low quality is a common situation. Other areas which deserve special attention are the high mountains, in order to improve the interpolation process between adjacent watersheds.
The RFA analysis must warrant a suitable selection of homogeneous regions and its stations, using both discordance and heterogeneity statistics. The requirement's compliance assures an appropriate selection of regional pdf, which should assess temperature values in ungauged sites. The work has presented, for example, at-site shape parameters dissimilar from those assessed for regional distribution, then the computed values were very different at highest return periods. However, the computed values are still between the confidence intervals, due to the appropriate selection of regional distribution.
References
[1] T. T. Hailegeorgis, S. T. Thorolfsson, and K. Alfredsen, "Regional frequency analysis of extreme precipitation with consideration of uncertainties to update IDF curves for the city of Trondheim," J. Hydrol., vol. 498, pp. 305-318, Aug. 2013. [ Links ]
[2] A. P García-Marín, J. Estévez, C. Sangüesa-Pool, R. Pizarro-Tipia, J. L. Ayuso-Muñoz, and F. J. Jimenez-Hornero, "The use of the exponent K(q) function to delimit homogeneous regions in regional frequency analysis of extreme annual daily rainfall," Hydrol. Process., vol. 29, no. 1, pp. 139-151, Jan. 2015. [ Links ]
[3] H. Wazneh, F. Chebana, and T. B. M. J. Ouarda, "Delineation of homogeneous regions for regional frequency analysis using statistical depth function,"J. Hydrol., vol. 521, pp. 232-244, Feb. 2015. [ Links ]
[4] J. Clavet-Gaumont, L. Sushama, M. N. Khaliq, O. Huziy, and R. Roy, "Canadian RCM projected changes to high flows for Québec watersheds using regional frequency analysis," Int. J. Climatol, vol. 33, no. 14, pp. 2940-2955, Nov. 2013. [ Links ]
[5] A. Sarhadi and M. Heydarizadeh, "Regional frequency analysis and spatial pattern characterization of Dry Spells in Iran," Int. J. Climatol., vol. 34, no. 3, pp. 835-848, Mar. 2014. [ Links ]
[6] X. Sun, M. Thyer, B. Renard, and M. Lang, "A general regional frequency analysis framework for quantifying local-scale climate effects: A case study of ENSO effects on Southeast Queensland rainfall,"J. Hydrol., vol. 512, pp. 53-68, May 2014. [ Links ]
[7] J. Weiss and P Bernardara, "Comparison of local indices for regional frequency analysis with an application to extreme skew surges," Water Resour. Res., vol. 49, no. 5, pp. 2940-2951, May 2013. [ Links ]
[8] J. Weiss, P Bernardara, and M. Benoit, "Formation of homogeneous regions for regional frequency analysis of extreme significant wave heights," J. Geophys. Res. Oceans, vol. 119, no. 5, pp. 2906-2922, May 2014. [ Links ]
[9] J. R. M. Hosking and J. R. Wallis, Regional Frequency Analysis: An Approach Based on L-Moments, Ed. Revised. Cambridge: Cambridge University Press, 2005. [ Links ]
[10] J. R. M. Hosking, "L-moments: Analysis and estimation of distributions using linear combinations of order statistics,"J. R. Statist. Soc., vol. 52, no. 1, pp. 105-124, 1990. [ Links ]
[11] S. Gabriele and F. Chiaravalloti, "Using the meteorological information for the regional rainfall frequency analysis: An application to sicily," Water Resour. Manage., vol. 27, no. 6, pp. 1721-1735, Dec. 2012. [ Links ]
[12] J. R. Wallis, M. G. Schaefer, B. L. Barker, and G. H. Taylor, "Regional precipitation-frequency analysis and spatial mapping for 24-hour and 2-hour durations for Washington State," Hydrol. Earth Syst. Sci., vol. 11, no. 1, pp. 415-442, Jan. 2007. [ Links ]
[13] Y D. Chen, G. Huang, Q. Shao, and C.-Y Xu, "Regional analysis of low flow using L-moments for Dongjiang basin, South China," Hydrol. Sci. J., vol. 51, no. 6, pp. 1051-1064, Dec. 2006. [ Links ]
[14] Ó. J. Mesa Sánchez, J. I. Vélez Upegui, J. D. Giraldo Osorio, and D. I. Quevedo Tejada, "Adaptación del método de muliescalamiento para la estimación de caudales máximos en Colombia," Meteorol. Colomb., vol. 7, pp. 149-156, Mar. 2003. [ Links ]
[15] Ó. J. Mesa Sánchez, J. I. Vélez Upegui, J. D. Giraldo Osorio, and D. I. Quevedo Tejada, "Regionalización de características medias de la cuenca con aplicación en la estimación de caudales máximos," Meteorol. Colomb., vol. 7, pp. 141-147, Mar. 2003. [ Links ]
[16] G. Poveda Jaramillo, J. I. Vélez Upegui, Ó. J. Mesa Sánchez, L. I. Ceballos Bonilla, M. D. Zuluaga Arias, and C. D. Hoyos Ortiz, "Estimación de caudales mínimos para Colombia mediante regionalización y aplicación de la curva de recesión de caudales," Meteorol. Colomb., vol. 6, pp. 73-80, Oct. 2002. [ Links ]
[17] M. V Vélez, W Quintero, and J. P Delgado, "Implementación del modelo MG para An-tioquia y el Eje Cafetero," Avances en Recursos Hidráulicos, vol. 14, pp. 87-96, Oct. 2006. [ Links ]
[18] Y Carvajal Escobar and J. B. Marco Segura, "Aplicación de métodos estadísticos para la regionalización de precipitación mensual en el Valle del Cauca," Metereol. Colombg., no. 5, pp. 13-21, Mar. 2002. [ Links ]
[19] J. I. Vélez, G. Poveda, O. Mesa, C. D. Hoyos, J. F. Mejía, D. I. Quevedo, L. F. Salazar, and S. C. Vieira, "Aplicación de diferentes metodolgías para la estimación de curvas intensidad-frecuencia-duración en Colombia," Meteorol. Colomb., vol. 6, pp. 91-100, Oct. 2002. [ Links ]
[20] G. Poveda, J. Vélez, Ó. Mesa, A. Cuartas, J. Barco, R. Mantilla, J. Mejía, C. Hoyos, J. Ramírez, L. Ceballos, M. Zuluaga, R Arias, B. Botero, M. Montoya, J. Giraldo, and D. Quevedo, "Linking Long-Term Water Balances and Statistical Scaling to Estimate River Flows along the Drainage Network of Colombia,"J. Hydrol. Eng., vol. 12, no. 1, pp. 4-13, 2007. [ Links ]
[21] L. A. Acevedo Aristizábal, "Estimación hidrológica bajo escenarios de cambio climático en Colombia," MSc Thesis, Universidad Nacional de Colombia, Medellín, Colombia, 2009. [ Links ]
[22] P M. Acosta Castellanos and L. X. Sierra Aponte, "Evaluación de métodos de construcción de curvas IDF a partir de distribuciones de probabilidad y parámetros de ajuste," Revista Facultad de Ingeniería Universidad Pedagógica y Tecnológica de Colombia, vol. 22, no. 35, pp. 25-33, Jul. 2013. [ Links ]
[23] E. G. Pulgarín Dávila, "Fórmulas regionales para la estimación de curvas intensidad-frecuencia-duración basadas en las propiedades de escala de la lluvia (región andina colombiana)," MSc Thesis, Universidad Nacional de Colombia, Medellín, Colombia, 2009. [ Links ]
[24] J. A. Torres, J. I. Ordóñez, and R. Duque, "Comparación de los métodos de máxima verosimilitud y L-momentos en el análisis de frecuencias en la cuenca alta del río Magdalena," in XX Seminario Nacional de Hidráulica e Hidrología, Barranquilla, 2012. [ Links ]
[25] J. Núñez-Cobo, K. Verbist, J. Ramírez-Hernández, and M. Hallack-Alegría, "Guía metodológica para la aplicación del análisis regional de frecuencia de sequías basado en L-momentos y resultados de aplicación en América Latina," UNESCO IHP-LAC-CAZALAC, Montevideo, Uruguay, Technical Document 27, 2010. [ Links ]
[26] K. Verbist, F. Santibáñez, D. Gabriels, and G. Soto, "Atlas of arid and semi-arid zones of Latin America and the Caribbean," UNESCO IHP-LAC - CAZALAC, Montevideo, Uruguay, Technical Document 26, 2010. [ Links ]
[27] D. Kwiatkowski, P C. B. Phillips, P Schmidt, and Y Shin, "Testing the null hypothesis of stationarity against the alternative of a unit root," J. Econ., vol. 54, no. 1, pp. 159-178, Oct. 1992. [ Links ]
[28] J. A. Greenwood, J. M. Landwehr, N. C. Matalas, and J. R. Wallis, "Probability weighted moments: Definition and relation to parameters of several distributions expressable in inverse form," Water Resour. Res., vol. 15, no. 5, pp. 1049-1054, Oct. 1979. [ Links ]
[29] J. R. M. Hosking, J. R. Wallis, and E. F. Wood, "Estimation of the generalized extreme-value distribution by the method of probability-weighted moments," Technometrics, vol. 27, no. 3, pp. 251-261, Aug. 1985. [ Links ]
[30] S. S. Eslamian and H. Feizi, "Maximum monthly rainfall analysis using L-moments for an arid region in Isfahan Province, Iran," J. Appl. Meteor. Climatol., vol. 46, no. 4, pp. 494-503, Apr. 2007. [ Links ]
[31] J. R. M. Hosking and J. R. Wallis, "Some statistics useful in regional frequency analysis," Water Resour. Res., vol. 29, no. 2, pp. 271-281, Feb. 1993. [ Links ]
[32] H. Malekinezhad and A. Zare-Garizi, "Regional frequency analysis of daily rainfall extremes using L-moments approach," Atmosfera, vol. 27, no. 4, pp. 411-427, Oct. 2014. [ Links ]
[33] R. Bivand, R. Krug, M. Neteler, and S. Jeworutzki, rgrass7: Interface Between GRASS 7 Geographical Information System and R., 2016. [ Links ]

