


 Inglés (pdf)
 Articulo en XML
 Referencias del artículo
 Enviar articulo por email
 Citado por SciELO
  Citado por Google
  Similares en
SciELO
Similares en
SciELO  Similares en Google
 Permalink
1. Introduction
Depending on the reservoir's source, raw natural gas can have different compositions. Normally, raw natural gas is composed of methane (CH4), other light hydrocarbons from ethane to pentane (C2H6 to C5H12), heavy hydrocarbons (C6+), water (H2O), carbon dioxide (CO2), hydrogen sulfide (H2S), helium and nitrogen [1]. If the heavy hydrocarbons are not removed from the stream of the raw natural gas before its sale to a transmission company, at some point in the pipeline, these compounds begin to condense, causing corrosion issues, an increase in the pressure drop and liquid carryover in the pipeline. These situations may result in operational and integrity issues in the equipment downstream in the gas pipeline [2]. The raw natural gas can also be classified according to its liquid content measured in GPM or gallons of liquid recoverable per 1,000 standard cubic feet (MSCF) of gas (in SI, cubic meters of liquids recoverable per 100 cubic meters of gas). Based on this measure, the rich and lean terms refer to the amounts of recoverable hydrocarbons in the natural gas. A lean gas will usually contain 1 GPM or less, whereas a rich gas may contain 3 or more GPM [3].
The hydrocarbon dew point (HCDP) defines whether the natural gas stream in a pipeline at a given pressure and temperature consists of a single gas phase or two phases (gas and liquid) [4]. The highest temperature above which a liquid cannot be formed, regardless of the pressure, is called the cricondentherm [5]. As natural gas flows through a pipeline, its temperature varies depending on the ambient temperature surrounding it. To avoid hydrocarbon condensation, the natural gas temperature within the pipeline should always be higher than the HCDP. The heat transfer (between the gas inside the pipe and its surroundings) and the pressure drop define whether hydrocarbon condensation occurs. The cricondentherm is a property that depends on the gas composition, hence it indicates the level of heavy hydrocarbons (hexane and heavier) in the natural gas. It is an important quality parameter written into regulations and tariffs from producers through transmission and distribution companies to the final end users [6].
The technical specification that a country issues to regulate its natural gas transmission must represent a balance between the best performance of the gas appliances and the cost of the gas supply. If the gas specification is too narrow, it will present a barrier to the creation of an effective and efficient gas market by limiting gas sources and thereby increasing the gas processing cost. On the other hand, a broad gas specification results in increased safety risks and can lead to efficiency losses [7]. A well-balanced gas specification is one that offers the broadest possible range of natural gas parameters while maintaining safety, reliability, efficiency and compliance with environmental standards throughout the supply chain of transmission, distribution and consumption [8].
According to the 2015 Indicative Plan for Natural Gas Supply in Colombia, without the inclusion of gas supply from a regasification plant or gas imports, Colombia was expected to have a natural gas deficit of approximately 400 Million of Standard Cubic Feet per Day (MMSCFD) beginning in the second half of 2017 [9], [10]. After the 2015 report, a transitory plan was issued in November 2016 with recommendations to the Ministry of Mines and Energy about the future infrastructure and plans for implementation in the following 5 years. Some projects identified in this report were the Pacific regasification plant and the strengthening of the current gas transport infrastructure [11].
In addition, it is estimated that the national natural gas demand will reach an average annual growth of 2.5% between 2017 and 2031 [11,10].
For this reason, it is necessary to explore and develop new gas fields and take full advantage of the existing ones. Although there are opportunities for new sources of gas entering the Colombian gas market (small lean gas fields, offshore gas fields, associated gas fields), the actual cricondentherm regulation acts as a barrier for several new potential lean gas fields in warm climates in the country. The cost of processing this gas to meet the regulation probably discourages the development of these fields. Making adjustments to the cricondentherm or HCDP of these lean gases (with small removal ratios of heavy hydrocarbons) is a complex and expensive process, because the technology to be implemented demands large amounts of energy and the resulting amount of heavy hydrocarbon product is not commercially viable, since in some cases, recovery of the stabilized hydrocarbon condensates is economical only for rich gases [12], [13].
The first cricondentherm limit in the Colombian regulation for natural gas pipeline transmission was established in 1999, and the value approved was 4.4°C. Later, in 2004, a study [14] was carried out at some main pipelines located in the Colombian south (Centragas, Centroriente and Mariquita- Cali) and concluded that at 7.2°C, there was no evidence of hydrocarbon condensation for that specific natural gas flowing inside that particular gas pipeline, even at its coldest parts. The 2004 study supported a modification of the regulation for natural gas transmission in Colombia, and a new cricondentherm of 7.2°C was established at any pressure for gas pipelines all over the country [15]. This is the current HCDP limit that has been established in the Colombian regulation. It adequately fits the coldest parts of the country, but there is an opportunity to propose a different maximum limit on the cricondentherm for the Colombian Caribbean coast taking into account that 48% of the natural gas pipelines are located in these warm regions and their minimum average temperature oscillates between 21 and 23°C [16], [17]. Countries around the world with high climatic diversity within their territories similar to those in Colombia, such as Brazil [18], Venezuela [19] and Australia [20], [21], have different HCDP limits in their regulations depending on the region in which the gas is transported. This allows the producer to reduce its investments because the cost of processing gas and the economics of the gas supply are directly related to the limits imposed by the gas quality specifications [22].
This study aimed to propose a different maximum limit on the cricondentherm for warm climates on the Colombian Caribbean coast, following trends in current regulations in other countries. For this purpose, different countries were studied to identify the main drivers of their actual regulations. Then, a gas pipeline on the Caribbean coast of Colombia transporting two types of natural gas prior to any treatment was simulated at different ambient temperatures to identify the possibility of hydrocarbon condensation by changing the operating temperature and pressure. Conditions promoting hydrocarbon condensation in the simulation were compared to the current Colombian regulation. Finally, an interval in which a different limit for the cricondentherm for warm climates in the gas quality regulation of Colombia was proposed, taking into account that a slight modification in the gas quality parameters can result in considerable savings in the design and performance of a gas processing plant and transmission system.
2. Materials and methods
2.1. Evaluated Gases
The samples were taken from three Caribbean lean gas fields, and two of them were mixed in different proportions before treatment and sold as a new natural gas. In this study, the gas from one of the lean gas fields was identified as Gas A, while the mixed ones were identified as Gas B. Table 1 shows the extended chromatography results used to model the gases.
The gas condensate sample compositions were determined by a cryogenic distillation technique and gas chromatography. A portion of the single-phase sample was condensed and then it was gradually allowed to return to the ambient temperature. The evolved gas and the residual condensate were collected separately, weighed and then analyzed by gas chromatography. The compositions were then recombined mathematically to determine the wellhead fluid composition. The gas composition was measured using a "one-shot" Varian 3800 gas analyzer (Varian Inc. Palo Alto, California, USA), with GPA 2286 and 3 columns to clearly identify all of the eluted components from N2, CO2 and Ci through C11+. The chromatograph was calibrated using air and synthetic hydrocarbon gas with a known composition. The resultant calibration data was checked statistically against previous calibrations. The liquid compositions were measured using an HP 6890 chromatograph (Agilent Inc., Santa Clara, California, USA), which was checked twice per week with a gravimetric n-paraffin mix containing a range of pure components from C8 through C36 and a synthetic gas-oil mix (according to ASTM -D2887) with a known composition. The resultant calibration data was checked statistically against previous calibrations prior to performing analyses on unknown samples.
Extended chromatography was used because it is almost universally accepted in the oil and gas industry that compositional data at least through C9 is required for an accurate hydrocarbon dew point prediction [23]. Heavy hydrocarbons modify the cricondentherm of the gas, and small changes in the higher hydrocarbon components have a greater effect on the hydrocarbon dew point than the lower carbon number components in a typical natural gas. As a rough rule of thumb, a change in the C9 concentration of 1 ppm can cause a 17.2°C change in the dew point temperature, whereas an 8 ppm change in the C7 concentration would be required to produce the same effect [24]. Thus, if the heavy hydrocarbons are not analyzed separately, the chance of under-specifying the treatment process for the recovery or removal of such hydrocarbons is very high [25].
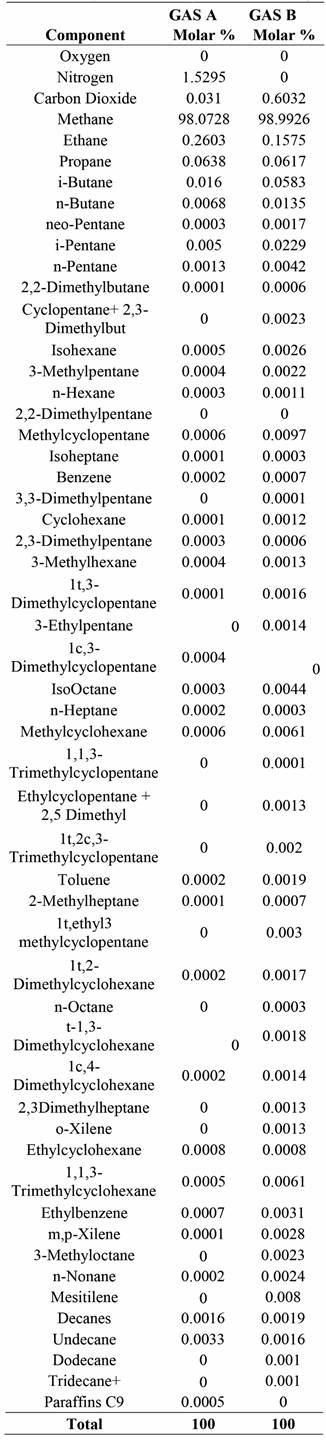
This study used the worst case scenario for the cricondentherm of all of the possible mixtures. Fig. 1 shows the simulated phase envelope in a temperature versus pressure plot for the evaluated gases (Gas A and Gas B). The thermodynamic model used to simulate these gases is explained in the next section.
Gas A has a cricondentherm of 15.6°C, which is close to the value in the natural gas transmission regulation. However, the temperature is above the limit, so the gas has to be treated to meet the 7.2°C limit. Gas B is a richer gas with a cricondentherm of 40.4°C.
2.2. Equation of State (EOS)
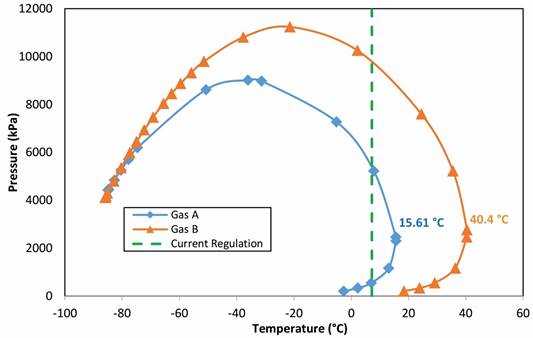
HCDP measurements were taken in the production pipeline of one of the evaluated fields at different delivery pressures to determine an EOS that represents the evaluated gases’ behavior, The collected data were then compared with some of the most frequently used EOS in the oil and gas industry: Peng-Robinson (PR), generalized cubic equation of state (GCEOS), Peng-Robinson- Stryjek-Vera (PRSV), Soave-Redlich-Kwong (SRK) and Soave-Redlich-Kwong-Twu (SRK-Twu) [26]. Fig. 2 shows the behavior of each thermodynamic model in comparison with the collected data. The equations that best represent the experimental data are the PR and the GCEOS, with the average absolute deviation (AAD) of 10.35% and 16.7%, respectively. In addition, several studies [27], [28], [29], [30] have demonstrated that the PR equation usually determines the behavior of hydrocarbon mixtures accurately [31], especially when the mixtures are not very close to their critical points [6].
Source: Author’s own creation
Fig. 2 Hydrocarbon Dew Point Measurements and EOS Adjustment Comparison
The determination of the suitable EOS for this study is based on the mixing rules, which use a quadratic term component for molecular attraction and a linear term component for molecular repulsion [32]. The Peng-Robinson EOS was selected [33] for calculating the gas thermodynamic behavior inside the gas pipeline.
2.3 Warm climate in the Colombian Caribbean coast and the evaluated gas pipeline system
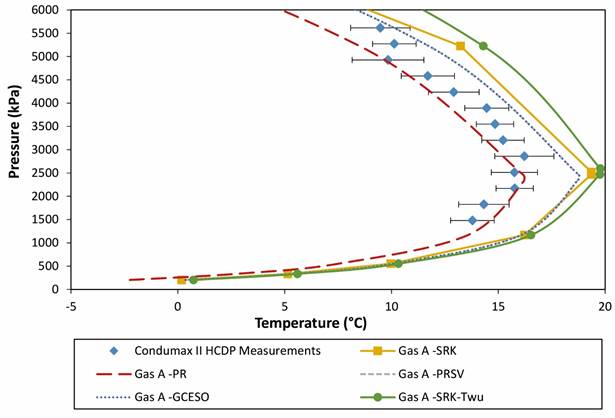
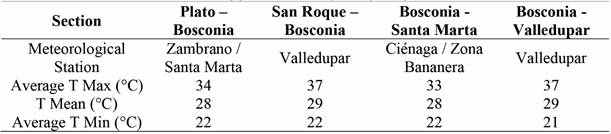
The Colombian Caribbean region is located at the northern part of the country, representing 11.6% of the 1141748 km2 that comprises the total Colombian territory, and it is mainly characterized by low altitude terrains (less than 130 m.a.s.l.) and a high mean temperature (28°C). [34]. The evaluated pipeline is 450 km long, has a diameter of 8 in (203 mm), and traverses a major section of the Colombian Caribbean coast. Fig. 3 shows the location of the analyzed gas pipeline: from east to west, the pipeline starts in Plato (Magdalena) and goes up to Valledupar (Cesar); from south to north, the pipeline starts in San Roque (Cesar) and goes up to Santa Marta (Magdalena). The two pipelines have an intersection in Bosconia (Cesar).
The highest point on the evaluated gas pipeline is located at 210 m.a.s.l (between Bosconia and Valledupar). Hence, geographic locations higher than 210 m.a.s.l (like Sierra Nevada de Santa Martha, which is also located in the Colombian Caribbean region) are not included in this study. Therefore, the proposed cricondentherm in this study is restricted to those gas pipelines located below 210 m.a.s.l.
2.4. Hydraulic modeling
To accurately calculate the flow patterns, possible liquid hold up, and pressure gradient inside the gas pipeline system, a flow correlation is needed. Empirical and mechanistic correlations have been developed for particular sets of flow characteristics, such as Lockhart and Martinelli, Hughmark, Beggs and Brill, Taitel and Dukler, Cheremisinoff and Davis, and Oliemans [36]. According to [37], the correlation that best allows the prediction of the pressure losses and liquid hold up, and handles different flow directions, is Beggs and Brill [38]. This model was later modified to include a correction for the pressure drop calculation, a correction for the friction in rough pipelines, and a correction for multiphase conditions in pipelines with an ascending or descending slope [39]. This correlation, known as modified Beggs and Brill, was used in this study for the gas pipeline hydraulic modeling.
2.5. Heat transfer modeling
To predict the temperature profile within a pipeline, the heat transfer between the natural gas and the environment should be considered. The natural gas temperature in an underground pipeline can be considered isothermal. The ambient temperature, the thermal conductivity of any given terrain and the thermal conductivity of the pipeline material have a direct impact on the heat transfer rate [40]. Table 2 shows the main parameters needed to simulate the heat transfer rate.
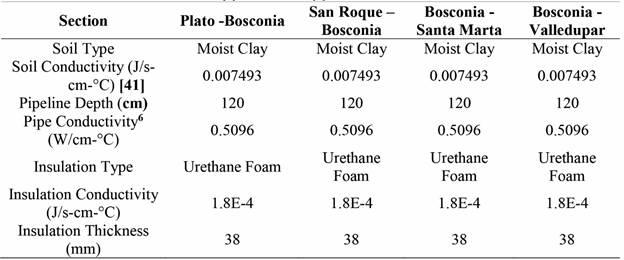
A summary table containing the average temperatures used for the gas pipeline simulation is shown in Table 3. Usually, the gas pipeline surrounding temperature is between 28 and 29°C; during the coldest months of the year, the temperature might descend to 21°C, and in the warmest months, the temperature reaches almost 37°C.
2.6. Heat transfer global coefficient
The global heat transfer coefficient combines the internal and external convective coefficients, insulation and the pipeline’s own characteristics into a unique parameter that is associated directly with the heat transfer [40]. For the calculation of the heat transfer coefficient between the gas pipeline and the environment, four predictive correlations were reviewed: Petukov, Dittus, Sieder and ProFES. It was found that the first three correlations can only analyze flows in one phase, mainly turbulent flow (Reynolds number > 10000) [42], [43]. On the other hand, the ProFES correlation [44] based on the Reynolds, Prandtl and Nusselt numbers allows the evaluation of systems with two and three phases in laminar flow, taking into account the flow regime. Consequent simulations showed that the analyzed gases had a Reynolds number between 9500 and 10100. Based on this fact, the ProFES correlation was selected, as it allows adequate modeling of the heat transfer in the eventual retrograde condensation process of the gas. Retrograde behavior describes a transition from the gas phase (or liquid phase) to partial condensation (or partial vaporization) and back to the initial phase with an isothermal change in pressure or an isobaric change in temperature. This property is particularly pronounced for mixtures that boil over a wide temperature range, such as natural gas [45].
2.7. Gas pipeline simulation
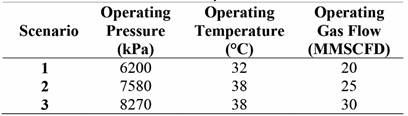
Hysys (version 7.3, Aspen Tech, Burlington, MA, USA, 2011) was used for the gas pipeline simulation to identify the operating conditions (pressure and temperature) under which hydrocarbon condensation might occur. Table 4 shows the three scenarios evaluated for the gas pipeline for each ambient temperature presented in Table 3. Different operational combinations among the three operating scenarios were also evaluated. The maximum and minimum operating pressures adhere to the current Colombian gas quality specifications: a maximum pressure of 8270 kPa and the minimal pressure found in the gas pipeline.
3. Results
3.1. HCDP limit comparison
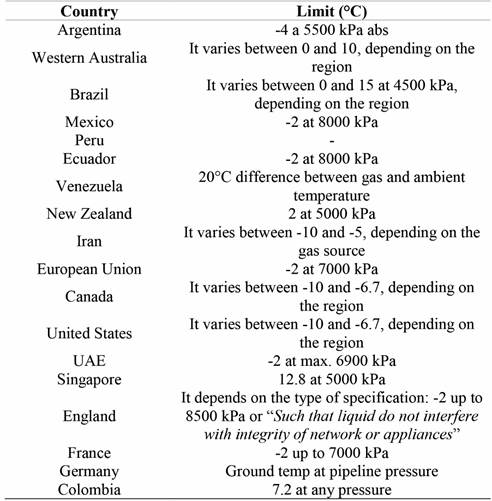
Table 5 shows the HCDP limits for the gas pipeline transmission in 17 gas producing countries and the European Union with different climate conditions within their territories or near the equator. It shows that most countries establish a single HCDP for a specific pressure. However, gas quality specifications vary not only between countries but also between jurisdictions within countries. Some countries establish their HCDPs depending on the region of the country in which the gas is transported. For example, Western Australia, Brazil and Venezuela present different limits of HCDP depending on the region.
3.2. Effect of ambient temperature on the gas pressure profile
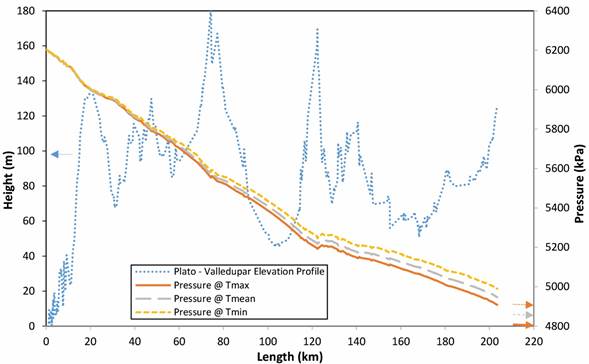
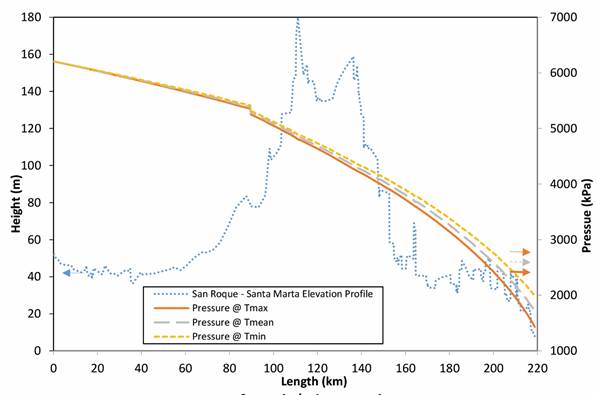
Fig. 4a and 4b correspond to the pressure profiles for Gas A grouped by pipeline sections: the first section going east to west, from Plato to Valledupar, and the second section going south to north, from San Roque to Santa Marta. The results for the three evaluated scenarios are similar to those of scenario 1. As before, there was no evidence of condensation in any case. In scenario 1, Gas A shows slight differences in the gas outlet pressure when the ambient temperature is modified (the greatest difference is 565 kPa). These differences are mainly due to changes in the gas density and viscosity [3] because there is no evidence of hydrocarbon condensation. In this case, it can be observed that the variation of the ambient temperature has little to no effect on the pressure gradient and that the only condition defining the gradient is the pipeline elevation profile. The results for the two other operational scenarios are similar to those of scenario 1.
Source: Author’s own creation
Figure 4a Pressure profile of Gas A at different ambient temperatures (Plato - Valledupar section)
Source: Author’s own creation
Figure 4b Pressure profile of Gas A at different ambient temperatures (San Roque - Santa Marta sectic
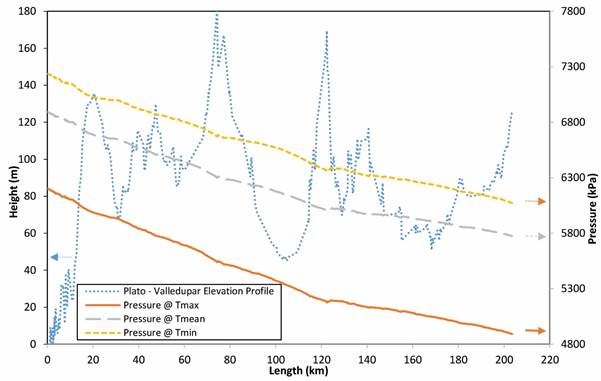
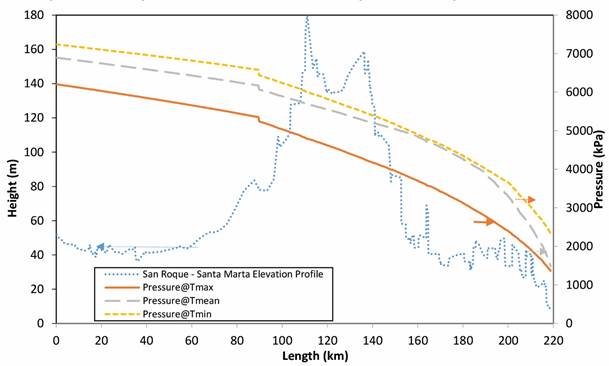
The results for Gas B are shown in Fig. 5a and 5b. A noticeable difference in the pressure profiles can be seen depending on the evaluated ambient temperature. This is due to the amount of the condensed liquid and the different gas pipeline inlet pressure requirements. For example, if the operation is carried out at the mean ambient temperature, it is not possible to have an inlet pressure below 6890 kPa, while if the operation is carried out at the maximum ambient temperature, the minimum inlet pressure required becomes 6205 kPa (685 Pa less). It has been shown experimentally that the presence of even small quantities of liquid can have a huge effect on the pressure gradient in the gas transport [47]. A liquid buildup as low as 0.005 can result in pressure losses up to 30% compared to the pressure gradient of a pipeline transporting only gas with no liquid [48].
Source: Author’s own creation
Figure 5a Pressure profile of Gas B at different ambient temperatures (Plato - Valledupar section)
Source: Author’s own creation
Figure 5b Pressure profiles of Gas B at different ambient temperatures (San Roque - Santa Marta section)
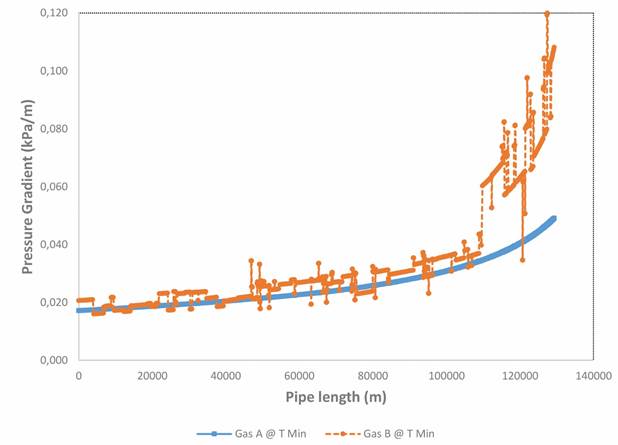
Upon reviewing the pressure gradient profiles vs. the pipeline length for Gases A and B (Fig. 6), increased pressure losses due to the presence of liquid in the gas pipeline are observed. For Gas A, the maximum gradient is 0.05 kPa/m, while for Gas B, the gradient is 0.12 kPa/m.
3.3. Effect of the ambient temperature on the gas temperature profile
The evaluation of the operating temperature profile in the gas pipeline relative to any variation in the ambient temperature and terrain elevation shows that for all of the evaluated scenarios for gases A and B, the gas pipeline temperature rapidly equilibrates to the ambient temperature and it becomes the operating temperature, regardless of the operating pressure.
As was previously stated for Gas A, there is no evidence of liquid buildup to any degree, even at the lowest operating temperature of the gas pipeline of 21°C, upon arrival to Santa Marta with a gradual pressure loss from 6200 to 1379 kPa in scenario 1. For Gas B, taking into account its cricondentherm (40.6°C), the liquid buildup is shown for all operating temperatures, with the proportion increasing as the ambient temperature decreases. The maximum quantity of condensed liquid obtained after the review of all operational scenarios for Gas B was 15.6 L/h for the minimum ambient temperature upon arrival to Santa Marta, 21°C.
Since in the case of Gas A, there was no liquid buildup in the gas pipeline in any scenario, a possible operating scenario where condensation might occur was sought, and 2 possibilities were found: a) sudden depressurization in regulating stations and b) retrograde condensation. A graphical summary of all of the evaluated gas pipeline operation points for Gas A is shown in Fig. 7.
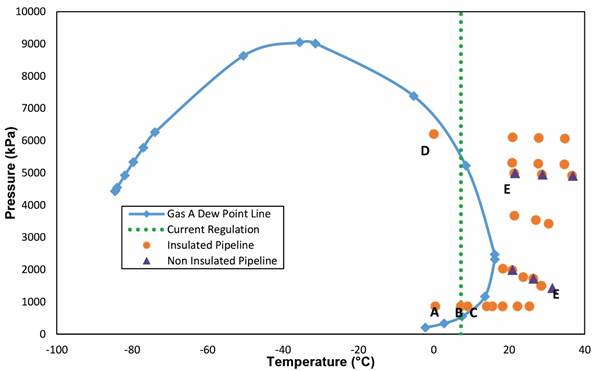
If there is any sudden depressurization, for example, from 3347 kPa to 862 kPa, and the gas pipeline is operating at the minimum ambient temperature possible, there is a possibility of hydrocarbon condensation at the pressure regulation station (A, B, C). On the other hand, if the pipeline is “packed” (meaning that there is no input or output of gas into the system) and a constant 6205 kPa pressure is maintained, retrograde condensation might occur if the operating temperature is 0°C.
(D) . The first situation can be easily avoided by installing a heater before the depressurization; the second one is very unlikely to occur, taking into account that the minimum ambient temperature on the Colombian Caribbean Coast is 21°C (see Table 3.). Fig. 7 also shows that from the heat transfer perspective, the difference between the insulated and noninsulated pipelines is negligible, and the gas pipeline final temperature (soil temperature) is the same for the evaluated scenarios (E).
4. Conclusions
Comparing the HCDP and cricondentherm limits established in countries with a high climatic diversity within their territories similar to those seen in Colombia, it is possible to suggest a different cricondentherm limit based on the location of the gas pipeline system. This limit should not compromise the security of the existing network. According to the results obtained in the simulation from Gas A with a cricondentherm of 15.6°C, where there was no hydrocarbon condensation, it is possible to state that an adequate cricondentherm limit for gas pipelines transiting the Colombian Caribbean coast is between 10 and 12.6°C. The condensation phenomena that may occur at the regulation stations might be controlled through the installation of heating equipment prior to the gas expansion. It is important to state that although these reported results are on a simulation basis and a further experimental design must be made in order to confirm these findings, they are useful to provide a preliminary technical feasibility for this proposal. This newly proposed cricondentherm might also be applied in gas pipelines located in warm climates in other parts of the country, depending on the gas final user location. It is important to understand that the gas quality specification impacts competition in both the upstream and downstream markets, and hence options for the development of a uniform broad gas quality specification should be examined to develop and enhance the gas market in Colombia.

