


Serviços Personalizados
Journal
Artigo
 Espanhol (pdf)
 Artigo em XML
 Referências do artigo
 Enviar este artigo por email
Indicadores
-
 Citado por SciELO
 -
 Acessos
Links relacionados
-
 Citado por Google
 -
 Similares em
SciELO
Similares em
SciELO -
 Similares em Google
Compartilhar

 Permalink
Ingeniería y competitividad
versão impressa ISSN 0123-3033
Ing. compet. vol.15 no.2 Cali jul./dez. 2013
Analysis of wireless propagation using a novel 3D Raytracing acceleration technique
Análisis de propagación inalámbrica usando una nueva técnica 3D de aceleración de trazado de rayos
Adolfo Escobar
Grupo de Investigación en Materiales Avanzados y Energía, Instituto Tecnológico Metropolitano, Medellín, Colombia
E-mail: adolfoescobar@itm.edu.co
Lorena Lozano
Grupo de Investigación en Electromagnetismo Computacional, Universidad de Alcalá, Alcalá de Henares, España
E-mail: lorena.lozano@uah.es
Hector Cadavid
Grupo de Investigación en Alta Tensión, Universidad del Valle, Cali, Colombia
E-mail: hector.cadavid@correounivalle.edu.co
Manuel F. Cátedra
Grupo de Investigación en Electromagnetismo Computacional, Universidad de Alcalá, Alcalá de Henares, España
E-mail: felipe.catedra@uah.es
Eje temático: Electrical and electronic engineering / Ingeniería eléctrica y electrónica
Recibido: 20 de Abril de 2013
Aceptado: 15 de Agosto de 2013
Abstract
The rapid growth in wireless communications has led to the need for an effective way to evaluate the radio propagation. Dense urban areas and indoor spaces tend to be complex environments that require a lot of obstacles to be modeled. In such environments, the radio propagation is an extremely complex phenomenon and ray tracing techniques have been widely used to analyze these problems. However, the main drawback of ray tracing algorithm is it slowness. Therefore, the ray tracing process should be performed using techniques that improve the efficiency of the computations. This paper presents a new ray tracing acceleration technique that combines AZB and octree techniques to subdivide the space. This new technique was validated by propagation measurements in two hospital environments and the maximum error encountered for measured and calculated values was below 8%. The new technique reduces the computation time by half in comparison to AZB technique. But, as the number of interactions increases, computational time increases as well.
Keywords: Acceleration techniques, propagation models, ray-tracing, wireless communications.
Resumen
El rápido crecimiento en las comunicaciones inalámbricas ha llevado a la necesidad de evaluar de un modo eficaz la radiopropagación. Las densas áreas urbanas y los ambientes interiores tienden a ser entornos complejos que requieren una gran cantidad de obstáculos para ser modelados. En tales entornos, la radiopropagación de las ondas es un fenómeno extremadamente complicado y las técnicas de trazado de rayos han sido ampliamente usadas para analizar estos problemas. Sin embargo, el principal problema del algoritmo de trazado de rayos es su lentitud. Por lo tanto, el proceso del trazado de rayos se debe realizar con técnicas que mejoran la eficiencia de las simulaciones. En este artículo se presenta una nueva técnica de aceleración de trazado de rayos que combina las técnicas AZB y octree para la subdivisión del espacio. Esta nueva técnica se validó mediante mediciones de propagación en dos ambientes hospitalarios, encontrando que el máximo error entre los valores medidos y calculados fue inferior al 8%. La nueva técnica permitió reducir el tiempo de cálculo a la mitad comparado con la técnica AZB. Sin embargo, a medida que crece el número de interacciones que se evalúan, crece el tiempo computacional.
Palabras clave: Técnicas de aceleración, modelos de propagación, trazado de rayos, comunicaciones inalámbricas.
1. Introduction
The rapid rise in standards, and personal communication systems has led to intensive use of radio frequency spectrum. In addition to radio transmitters, like AM and FM transmitters, which are mainly external, wireless communication equipments have been widely used. Due to this fact, there has been an increasing interest to characterize radio propagation in different environments: urban and suburban areas, and even within buildings. Propagation models can be used for this purpose. Propagation models can be divided into two types: empirical and theoretical models (Stutzman & Thiele, 1997). Empirical models are based on statistical extrapolation of results from phenomenon measurements taken in situ. These models consider environmental characteristics and are computationally time demanding (Motley & Keenan, 1988; Tornevik et al., 1993). By contrast, error depends on measurement error as well as similarity in environments where measurements were taken, and environments to be analyzed (Neskovic et al., 2000).
Unlike empirical models, theoretical or deterministic models are not supported by extensive measurements, but by detailed knowledge of the environment, providing accurate predictions. They can be applied in different environments without altering their error (Sarkar et al., 2003). Algorithms used in theoretical models are usually complex and computationally inefficient (they are based on the wave-equation solution). When obstacles in the environment are bigger than one wavelength, exact analytical solutions have infinite series that slowly converge. In these cases, electromagnetic propagation can be treated through approximate solutions.
Deterministic models can be classified into: numerical and asymptotic methods. Numerical methods (MoM, FDTD, FEM, etc.) are generally used in problems involving obstacles with no more than few tens of wavelengths in size (Hult, 2006; Gougeon et al., 2011). On the other hand, asymptotic methods come from the need to employ approaches to efficiently analyze wave propagation in large-dimension environments, in terms of wavelength. This analysis is based on the fact that high frequency wave propagation can be modeled through ray propagation. These methods reduce the computational effort and are quite accurate. Geometrical Optics and Physical Optics are two asymptotic methods widely used in radio propagation (Malik et al., 2007; McNamara & Pistotius, 1990).
Ray-tracing is a technique based on Geometrical Optics (GO) that assumes that energy can be radiated through small tubes, often called rays. These rays travel in straight lines along the propagation direction. Therefore, a signal propagation can be modeled through ray propagation. In large areas compared with wavelength, this method is more accurate than empirical models and requires less computational resources than numerical methods. In GO, only the direct, reflected, and transmitted rays are considered. The Geometrical Theory of Diffraction (GTD) and its uniform extension, the Uniform Theory of Diffraction (UTD) (Bernardi et al., 2004) complement the GO theory by introducing a new type of rays, called diffracted rays. The purpose of these rays is to remove field discontinuities.
With the rapid advance in computing, ray-tracing techniques have become one of the most popular methods for characterizing radio propagation in different environments (Iskander, 2002). These techniques are of interest because they are highly accurate in dense urban areas (Catedra et al., 1998; Cavalcante et al., 2007) and indoor environments (Choi et al., 2006). The disadvantage when using the ray-tracing method is that it is computationally expensive; thus, inappropriate to be used in complex environments. For this reason, it is necessary to use efficient propagation models and ray-tracing acceleration techniques (Catedra & Perez, 1999). Spatial subdivision methods are being widely used in ray-tracing acceleration (Rajkumar et al., 1996). As for many of raytracing acceleration techniques, the main goal of spatial subdivision is to reduce the number of ray-facet intersection analyses in the ray-tracing process. To evaluate if a ray intersects any facet, it is necessary to test all environment facets for intersection. The basic idea for reducing a search problem order is to divide the space in many areas, establishing a correspondence relationship between areas and facets, and determining if the ray intersects the facets inside the area. The resolution at which the space is divided depends on the desired accuracy. Octree and AZB techniques are two spatial subdivision methods.
The octree data structure is a three-dimensional variant of the quadtree. An octree recursively decomposes three-dimensional space or cube, to eight sub-cubes (voxels). If the voxel satisfies certain criteria, it is recursively divided. The decomposition process splits and structures the environment by associating the facets to the voxels comprising terminal nodes of the octal tree. The Angular Z-Buffer (AZB) technique is similar to the light buffer technique, although the AZB has several unique characteristics that make it especially suitable for the diffraction treatment (Perez et al., 1996). For each environment facet, the space is divided into angular regions. These regions are called anxels as an abbreviation for angular elements. The anxels are spherical sectors defined by the angular margins which determine the anxel size. In each anxel, facets are assorted according to the distance to the facet under analysis. This information is stored in a matrix called AZB. This matrix depends exclusively on the location of facets in the environment (Gutiérrez et al., 2000). When the scene size increases, the AZB technique efficiency decreases because it is far away from the facet under analysis; if the area occupied by each anxel is large; then, it may contain a large number of facets (Catedra et al., 1998). Similarly, in environments with several obstacles, the AZB matrix construction for each facet can be computationally expensive.
This paper presents a new 3D ray-tracing acceleration technique based on AZB and octree techniques. This new technique has been successfully implemented in the FASANT tool, a software created at the University of Alcalá (Alcalá de Henares, Spain) for the analysis of on board antennas. The kernel of this software is based on the Uniform Theory of Diffraction. With this new technique, the computation time of the FASANT tool reduces, because its execution time to create the AZB matrix decreases. Therefore, the geometry preprocessing accelerates. The paper is structured as follows: the new ray-tracing acceleration technique is described in Section II, the obtained results are reported in Section III, and the authors' conclusions are in Section IV.
2. Methodology
To increase the efficiency of AZB technique, the AZB algorithm was combined with another algorithm for space subdivision (the octree algorithm). This new technique is called TROyA (ray TRacing based on Octree and AZB). The TROyA technique consists of two phases. Its first phase creates the scene octree. The octree recursively subdivides the scene into eight octants (voxels or volume elements). A voxel is the smallest unit of 3D space that can be created by dividing the space. Basically, a 3D is equivalent to a pixel. Each voxel is associated with a list of objects (facets) in the scene that are contained (partially or totally) in it. This technique is dynamic, i.e. empty voxels do not need to be subdivided, which often results in large empty regions (Escobar, 2009).
The first step in an octree construction is to define the spatial extent of the scene. The scene is enclosed in a rectangular axis-aligned bounding box (AABB). An AABB is a rectangular region whose edges are parallel to coordinate axes (Barequet & Har-Peled, 2001). A bounding box is the computationally simplest box of all linear containers, and it is the most commonly used in many applications (O'Rourke, 1985). A 3D bounding box is specified by the bottom left and top right endpoints. This box includes the entire scene that will be the root node of the octree. Several algorithms use scene-centered cubes whose length is the maximum height, width, and depth of the scene. However, in this work, a bounding box was used as a root node to reduce the number of empty voxels generated with the cubes.
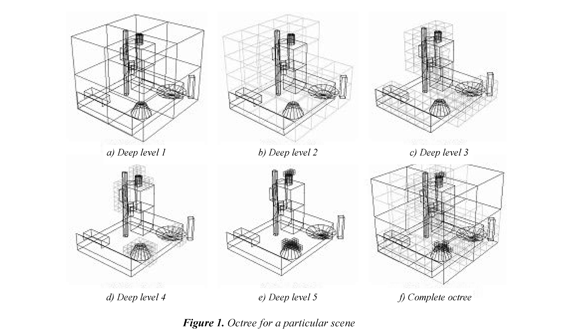
In the second step, the space is divided into eight voxels, which are congruent with one another to create the first deep level. The facets and the number of facets to be partly or totally contained within each one of the eight voxels are determined. This information is stored in the octree matrix. If, by assessing the number of facets within a voxel, this is larger than a predefined limit, the second step is recursively repeated (Figure 1). The process ends when the octree algorithm reaches a defined deep level. In the TROyA technique, these values (number of facets within a voxel and the deep level) can be modified depending on the geometrical model complexity.
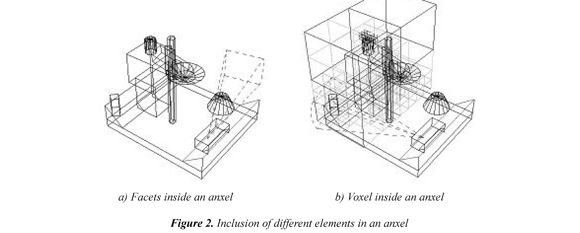
In the second phase of the TROyA technique, the AZB matrix for each facet is created from the information previously obtained with the octree. Only the facets within the same voxel or neighboring voxels to the facet under analysis are evaluated. The farther facets are not individually analyzed, but are joined by the voxel that stores them (Figure 2). If during the ray-tracing process, the voxel is not within the ray viewing area (a simple and rapid test), it is not necessary to test every facet inside the voxel. This significantly reduces computational time.
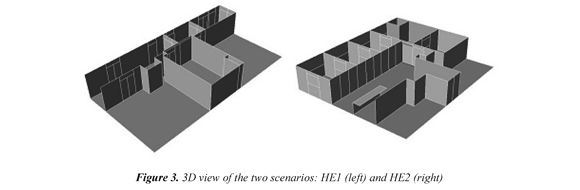
To validate the TROyA technique, propagation measurements were taken in two hospital environments in Cali, Colombia: an adult surgical ward (HE1) and a new intensive care unit (HE2). Figure 3 shows a 3D view of two scenarios. These scenarios were chosen to evaluate electromagnetic compatibility in hospital environments. These measurements were compared with computed values obtained in the same scenarios, using the FASANT tool, with the new TROyA technique, and the material electrical properties found in literature. Fortunately, measurements were taken before these areas to operate as hospitals, allowing a free movement through different rooms because they were empty. A wireless router Linksys WRT54G with two external dipoles was used as a source. This equipment operates at a 2.4 GHz frequency band and transmits using a constant power of 18 dBm (approximately 63 mW). A laptop with a built-in wireless antenna was used as a receiving equipment.
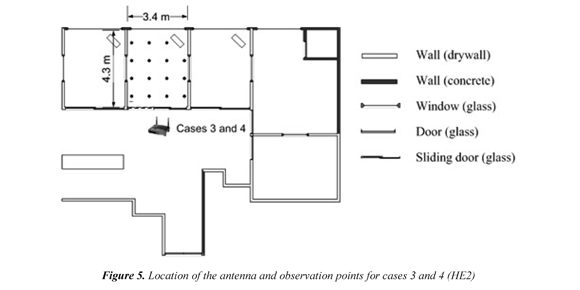
Two cases were evaluated in scenario 1 (HE1). First, the antenna was located at the beginning of the corridor and the observation points were along the corridor in line of sight to the antenna (LOS). In Case 1, the two doors were open. In Case 2, the two doors were closed (LOS and NLOS). Figure 4 shows the antenna location and observation points, and the materials that are part of the scene. In scenario 2 (HE2), two cases were also evaluated. In the first one, the antenna was placed outside the room, and observation points covered the entire room. In Case 3, the room door was open (LOS and NLOS). In Case 4, the room door was closed (NLOS).
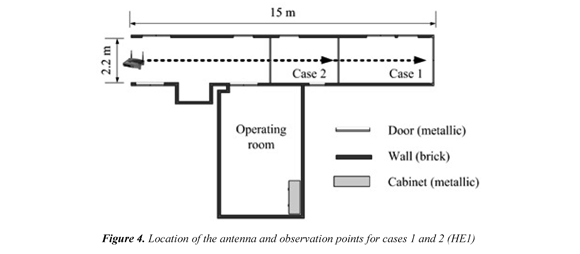
Figure 5 shows the location of the antenna and observation points, and the materials that are part of the scene. The electric field computation was performed in accordance with simulation main parameters and the order to be considered during the process. The order defines the effects to be take into account in the simulation for field computing. That is, order 1 is only a direct, reflected, transmitted, and diffracted field (simple effects). Order 2 is the combination of simple effects: reflected-reflected, reflected-diffracted, diffracted-reflected, etc.
3. Results and discussion
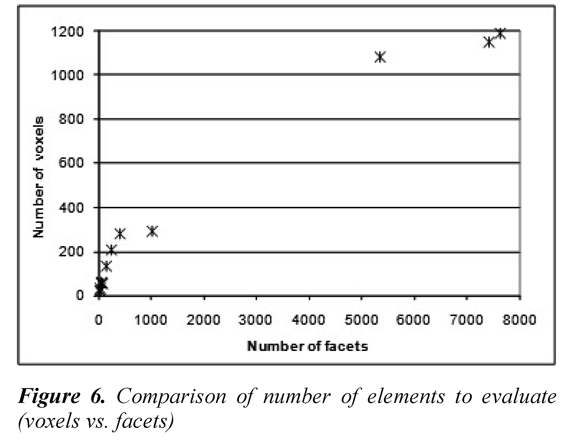
Figure 6 shows the comparison between the number of voxels generated by the octree algorithm with the number of scene facets using the bounding box as root node. When a scene has few facets (below 200) the number of voxels created is close to the number of facets. However, when the scene complexity increases, the number of voxels of the octree matrix deceases by up to 65% compared to the number of facets. This means a significant time reduction in the AZB matrix creation. The main goal of TROyA technique is to reduce the number of elements to be evaluated during the AZB matrix construction. The AZB technique analyzes each facet of the scene and places them in the anxel or anxels corresponding to the facet under analysis. While in TROyA technique, this analysis is done for each voxel created with the octree algorithm. Only the facets that are in the same vessel or neighboring voxels to the facet under analysis are examined.
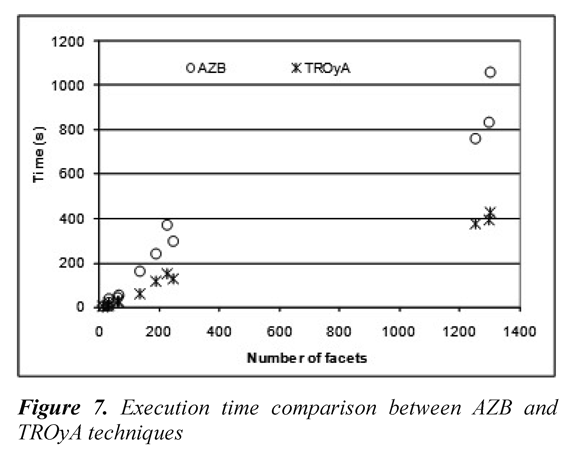
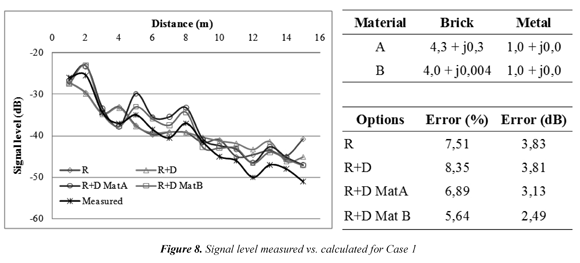
Computational time demand by the FASANT tool was reduced while using this new technique because the execution time to create the AZB matrix decreased. Therefore, the geometry preprocessing was accelerated. The TROyA technique reduces the computational time to create the AZB matrix in 40%-70% with regard to Evaluation results of the four cases using the FASANT tool with the implemented TROyA technique are described as follows. In Case 1, all observation points are in line of sight (LOS) to the antenna, thus the most important contributions to the signal intensity are provided by a direct ray, and reflection and diffraction phenomena. Figure 8 shows the signal intensity obtained during measurements and calculated with two orders of interaction considering the phenomena of reflection (R) and reflection-diffraction (R+D) without considering the electrical properties of materials. The signal intensity calculated with two options of electrical permittivity (R+D Mat A and R+D Mat B), considering the reflection and diffraction phenomena and two orders of interaction is shown. Two values were given for bricks and one value for metallic doors. These two materials were mainly present in the scenario. As shown in Figure 8, the received power is determined by few rays, the direct ray and some second-order rays, especially from reflection phenomenon. Compared to these rays, the contributions of higher order rays are not significant to change the total received power. The error in calculated values is reduced by using the electrical properties of materials.
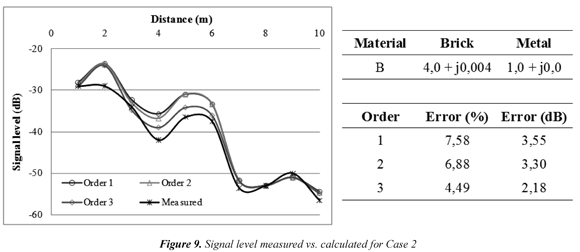
In Case 2, the first six observation points are in line of sight, the others are hidden by a metallic door located in the corridor (NLOS). In this case, it is necessary to consider the transmission phenomenon for the last points. Figure 9 shows the signal intensity obtained during the measurements and calculated with one option of materials and several orders of interaction, considering the reflection, diffraction, and transmission phenomena. In this case, the relative and RMS errors decrease by increasing the order of interactions. This is especially noticeable in the middle of the path, which shows that the contribution made by the rays reflecting on the metal door is important.
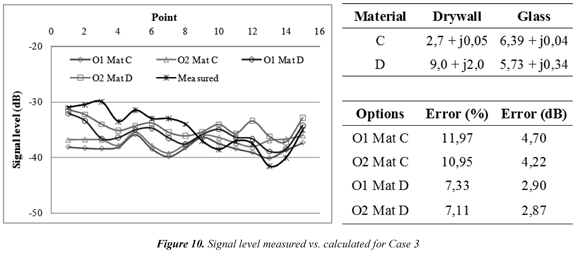
In Case 3, about half of the observation points are in line of sight to the antenna (LOS), while the remaining points are not in line of sight (NLOS) because of the room door. Figure 10 shows the signal intensity obtained during the measurements and calculated for several orders of interaction. The reflection, diffraction, and transmission phenomena and two options of electrical properties for the drywall and glass were considered. These two materials were mainly present in the scenario.
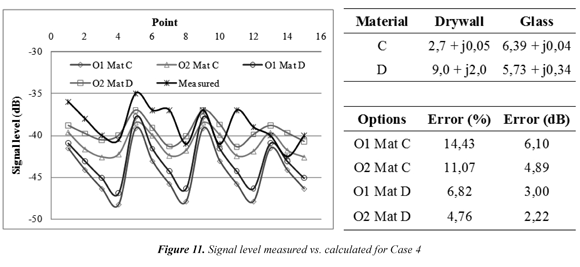
In Case 4, the room door is now closed; thus, all observation points are hidden by the door (NLOS). Figure 11 shows the signal intensity obtained during measurements and calculated for several orders of interaction. The reflection, diffraction, and transmission phenomena, and the electrical properties used in Case 3 were considered.
The error difference between the options of materials shows the importance of the electrical properties of the materials that compose geometry. The electrical properties of the materials are very important in modeling indoor environments. While there are some complex permittivity values in literature, they do not frequently consider environment reality or evaluation frequency. It is advisable to obtain these values from laboratory or in situ measurements, which can be costly. In Case 3, the maximum error difference between orders of interaction shows a weak contribution from the highest order of interaction rays. While in Case 4, the importance of higher-order rays is observed.
4. Conclusions
A new ray-tracing acceleration technique called TROyA (ray TRacing based on Octree and AZB) was presented. This technique combines the benefits of two space subdivision algorithms: AZB and octree techniques. With this new technique, the computation time to create the AZB matrix decreased by 50% during the geometry preprocessing phase in comparison with the AZB technique. The AZB matrix construction does not depend on source position, nor observation point location, nor electrical properties of materials, but it rather depends only on geometry (facets number and location). Therefore, the AZB matrix can be saved in a file for subsequent scene analysis if some of the parameters mentioned above change, but geometry remains the same, this would further accelerate the analysis of the scene.
Calculated values showed that after a certain number of orders of interaction, extra orders do not affect results. However, although at each point only few rays contribute to signal intensity, it is important that the software can handle a large number of rays to produce reliable results in complex environments or in areas far from source. In LOS conditions, few orders of reflection are adequate to predict signal intensity. However, in some NLOS conditions, more reflections, diffractions, and even transmissions to obtain reliable results are necessary. In indoor environment modeling, transmission effect is very important. But, as the number of interactions increases, computational time increases as well. Other factors influencing calculation error are geometry details, accuracy in source and observation point position, and accuracy in technical characteristics of source.
5. Acknowledgment
The authors thank the Comunidad de Madrid Projects S2009/TIC-1485, the Spanish Department of Science, Technology Projects TEC 2007-66164 and CONSOLIDER-INGENIO Nº CSD-2008-0068, and the Comunidad de Madrid/ Universidad de Alcalá, CCG08- UAH/TIC-4023 y CCG08-UAH/TIC-3981 for supporting this work. Adolfo Escobar thanks Colciencias for his Ph.D. studies sponsor.
6. References
Barequet, G., & Har-Peled, S. (2001). Efficiently Approximating the Minimum-Volume Bounding Box of a Point Set in Three Dimensions. Journal of Algorithms , 38 (1), 91-109. [ Links ]
Bernardi, P., Cicchetti, R., & Testa, O. (2004). An Accurate UTD Model for the Analysis of Complex Indoor Radio Environments in Microwave WLAN Systems . IEEE Transactions on Antennas and Propagation , 52 (6), 1509-1520. [ Links ]
Catedra, M. F., & Perez, J. (1999). Cell Planning for Wireless Communications (p. 216). Norwood (MA): Artech House Mobile Communications Library. [ Links ]
Catedra, M. F., Perez, J., Saez de Adana, F., & Gutierrez, O. (1998). Efficient ray-tracing techniques for three-dimensional analyses of propagation in mobile communications: application to picocell and microcell scenarios. IEEE Antennas and Propagation Magazine , 40 (2), 15-28. [ Links ]
Cavalcante, A. M., Sousa, M. J. de, Costa, J. C. W. A., Frances, C. R. L., & Cavalcante, G. P. dos S. (2007). A New Parallel Approach for 3D Ray-Tracing Techniques in the Radio Propagation Prediction. IEEE Latin America Transactions , 5 (5), 271-279. [ Links ]
Choi, M. S., Park, H. K., Heo, Y. H., S.H., O., & Myung, N. H. (2006). A 3-D Propagation Model Considering Building Transmission Loss for Indoor Wireless Communications. ETRI Journal , 28 (2), 247-249. [ Links ]
Escobar, A. (2009). Metodología de Cálculo de Campo Electromagnético para Evaluar la Interferencia Electromagnética Producida por Telefonía Móvil Celular en Ambientes Hospitalarios . Tesis Doctoral, Facultad de Ingeneiría, Universidad del Valle. Cali, Colombia. [ Links ]
Gougeon, G., Lostanlen, Y., & Maviel, L. (2011). Coupling a deterministic propagation model with diffuse scattering and urban furniture for small cells. In IEEE. 5th European Conference on Antennas and Propagation (EUCAP) (pp. 3448-3452). Rome, Italy: IEEE. [ Links ]
Gutiérrez, O., Saez de Adana, F., González, I., Pérez, J., & Cátedra, M. F. (2000). Ray-tracing techniques for mobile communications. Applied Computational Electromagnetics Society (ACES) Journal , 15, 209-231. [ Links ]
Hult, T. (2006/08/14-19). Indoor Propagation Simulation using FEM for Short-Range Wireless Communication Systems Operating at 2.4 GHz. In American Institute of Physics. AIP Conference Proceedings 834 (pp. 65-73). Vaxjo, Sweden: AIP. [ Links ]
Iskander, M. F. (2002). Propagation prediction models for wireless communication systems. IEEE Transactions on Microwave Theory and Techniques , 50 (3), 662-673. [ Links ]
Malik, W. Q., Stevens, C. J., & Edwards, D. J. (2007). Spatio-temporal ultrawideband indoor propagation modelling by reduced complexity geometric optics. IET Communications , 1 (4), 751. [ Links ]
McNamara, D. A., & Pistotius, C. W. I. (1990). Introduction to the Uniform Geometrical Theory of Diffraction (p. 488). Norwood (MA): Artech House Mobile Communications Library. [ Links ]
Motley, A. J., & Keenan, J. M. P. (1988). Personal communication radio coverage in buildings at 900 MHz and 1700 MHz. Electronics Letters , 24 (12), 763-764. [ Links ]
Neskovic, A., Neskovic, N., & Paunovic, G. (2000). Modern approaches in modeling of mobile radio systems propagation environment. IEEE Communications Surveys & Tutorials , 3 (3), 2-12. [ Links ]
O'Rourke, J. (1985). Finding minimal enclosing boxes. International Journal of Computer & Information Sciences , 14 (3), 183-199. [ Links ]
Pérez, J., Velarde, L., Gutierrez, I., & Cátedra, M. F. (1996, July). Efficient ray tracing algorithms for planning of picocellular systems in urban and indoor environments. Antennas and Propagation Society International Symposium, 1996. AP-S. Digest , 1, 437-440. IEEE. [ Links ]
Rajkumar, A., Naylor, B. F., Feisullin, F., & Rogers, L. (1996). Predicting RF coverage in large environments using ray-beam tracing and partitioning tree represented geometry. Wireless Networks , 2 (2), 143-154. [ Links ]
Sarkar, T. K., Ji, Z., Kim, K., Medouri, A., & Salazar-Palma, M. (2003). A survey of various propagation models for mobile communication. IEEE Antennas and Propagation Magazine , 45 (3), 51-82. [ Links ]
Stutzman, W. L., & Thiele, G. A. (1997). Antenna Theory and Design , (2 ed.). (p. 664). New York: Wiley. [ Links ]
Tornevik, C., Berg, J.-E., Lotse, F., & Madfors, M. (1993/05/18-20). Propagation models, cell planning and channel allocation for indoor applications of cellular systems. In IEEE. IEEE 43rd Vehicular Technology Conference (pp. 867-870). Secaucus (NJ): IEEE. [ Links ]

Revista Ingeniería y Competitividad por Universidad del Valle se encuentra bajo una licencia Creative Commons Reconocimiento - Debe reconocer adecuadamente la autoría, proporcionar un enlace a la licencia e indicar si se han realizado cambios. Puede hacerlo de cualquier manera razonable, pero no de una manera que sugiera que tiene el apoyo del licenciador o lo recibe por el uso que hace.
