


Services on Demand
Journal
Article
 English (pdf)
 Article in xml format
 Article references
 Send this article by e-mail
Indicators
-
 Cited by SciELO
 -
 Access statistics
Related links
-
 Cited by Google
 -
 Similars in
SciELO
Similars in
SciELO -
 Similars in Google
Share

 Permalink
Ingeniería y competitividad
Print version ISSN 0123-3033
Ing. compet. vol.15 no.2 Cali July/Dec. 2013
Evaluation of disparity maps
Evaluación de mapas de disparidad
Ivan Cabezas
Escuela de Ingeniería de Sistemas y Computación. Universidad del Valle. Cali, Colombia
E-mail: ivan.cabezas@correounivalle.edu.co
Maria Trujillo
Escuela de Ingeniería de Sistemas y Computación. Universidad del Valle. Cali, Colombia
E-mail: maria.trujillo@correounivalle.edu.co
Eje temático: Systems engineering / Ingeniería de sistemas
Recibido: 26 de Abril de 2013
Aceptado: 06 de Septiembre de 2013
Abstract
A disparity map is the output of a stereo correspondence algorithm. It is estimated in an intermediate step of a 3D information recovery process, from two or more images. A performance assessment of stereo correspondence algorithms may be addressed by a quantitative comparison of estimated disparity maps against ground-truth data. This assessment requires of the use of a methodology, which involves several evaluation elements and methods. Some elements and methods have been discussed with more attention than others in the literature. In the one hand, the quantity of used images and their relation to the application domain are topics rising large debate. On the other hand, there exist few publications on evaluation measures and error criteria. In practice, contradictory evaluation results may be obtained if different error measures are used, even on a same test-bed. In this paper, an evaluation methodology for stereo correspondence algorithms is presented. In contrast to conventional methodologies, it allows an interactive selection of multiple evaluation elements and methods. Moreover, it is based on a formal definition of error criteria based on set partitions. Experimental evaluation results showed that the proposed methodology allows a better understanding and analysis of algorithms performance than the Middlebury methodology. Final remarks highlights the relevance of discussing on the different elements and methods involved in an evaluation process.
Keywords: Evaluation criteria, evaluation methodologies, evaluation models, stereo correspondence.
Resumen
Un mapa de disparidad es la salida de un algoritmo de estimación de puntos correspondientes, el cual es estimado en una etapa intermedia del proceso de reconstrucción de la profundidad a partir de dos o más imágenes. La comparación del desempeño de un grupo de algoritmos de estimación de correspondencia puede hacerse mediante una evaluación cuantitativa de mapas de disparidad contra mapas de referencia. Está evaluación requiere de una metodología, la cual involucra diversos elementos y métodos. Algunos de estos elementos y métodos han recibido más atención que otros en la literatura. La cantidad de imágenes utilizadas, y la relación entre el contenido de las mismas y los diferentes dominios de aplicación han sido temas de amplia discusión en la literatura. Por otra parte, existen pocas publicaciones que aborden los temas relacionados con las medidas y los criterios de evaluación. En la práctica, el uso de diferentes medidas podría conllevar a la obtención de resultados contradictorios, empleando inclusive un mismo conjunto de pruebas. Adicionalmente, las particularidades de diferentes dominios de aplicación pueden implicar requerimientos variables durante el proceso de evaluación. En este artículo se presenta una metodología de evaluación para algoritmos de estimación de correspondencia en imágenes estéreo. La metodología se considera como aumentada en la medida que, a diferencia de las metodologías convencionales, permite una selección interactiva de diferentes elementos y métodos de evaluación, con diferentes propiedades. En la presente metodología, se formaliza el concepto de criterios de error, mediante la teoría de conjuntos. La experimentación realizada mostró que el uso de la metodología propuesta provee resultados innovadores, realzando la relevancia de una discusión en los diferentes elementos y métodos involucrados en el proceso de evaluación.
Palabras clave: Correspondencia estéreo, criterios de evaluación, metodologías de evaluación, modelos de evaluación.
1. Introduction
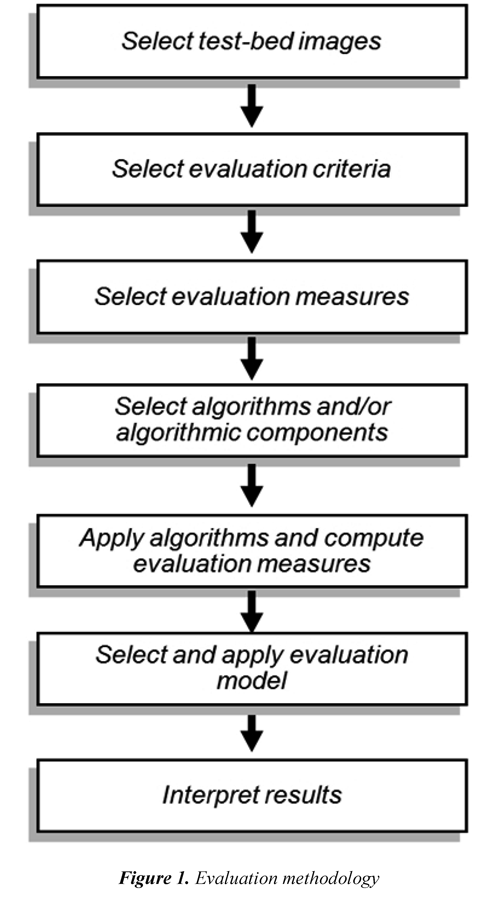
A quantitative comparison of estimated disparity maps allows evaluating, in a fair basis, the performance of Stereo Correspondence Algorithms (SCA) as well as algorithmic components and procedures, (Scharstein & Szeliski, 2002; Neilson & Yang, 2008; Cabezas and Trujillo, 2013), among others. An evaluation process can be addressed using either a qualitative or a quantitative approach. Although a qualitative evaluation approach, which is based on human viewing experiences, may properly take into account factors that are complex to quantify in an automatic process (Trucco & Ruggeri, 2013), it is time and resources consuming. Moreover, obtained results may be not repeatable (Wang et al., 2004). A quantitative evaluation of SCA can be automatically addressed using Disparity Ground-Truth Data (DGTD). However, the generation of DGTD may impose constraints on content of captured imagery test-bed (Geiger et al., 2012). In practice, quantitative evaluation methodologies, which are based on comparing estimated disparity maps against DGTD, are widely adopted. In general, an evaluation methodology for assessing estimated disparity maps is composed by a set of elements and methods, which interact following a sequence of steps, as it is illustrated in Figure 1. Two fundamental evaluation element and method are error criteria and error measures, respectively. Error criteria define image regions of interest, on which errors are calculated, allowing a detailed evaluation according to the application domain. Error measures quantify differences among estimated data and ground-truth data.
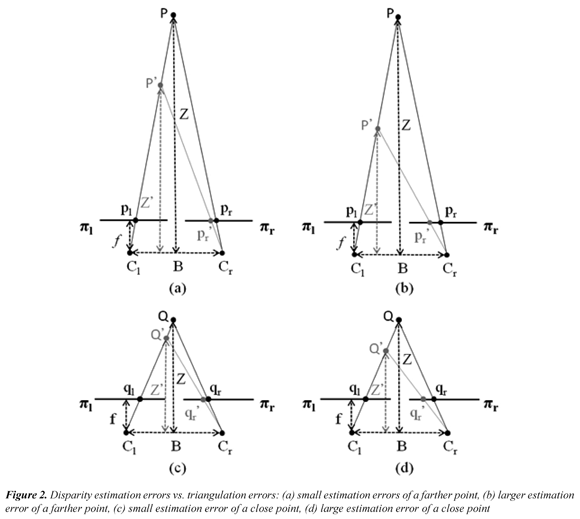
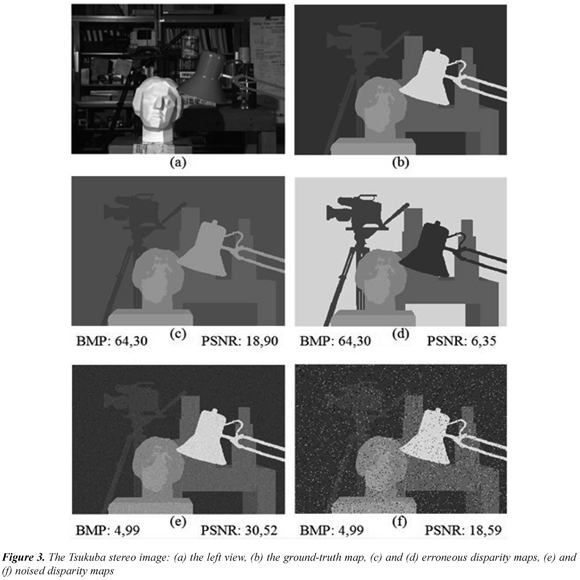
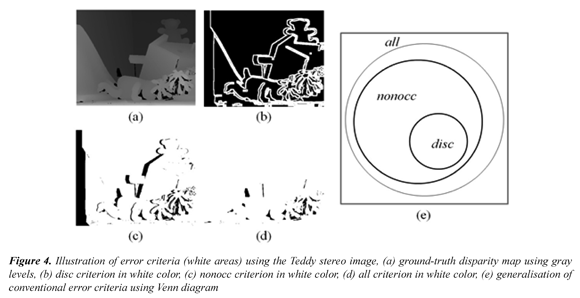
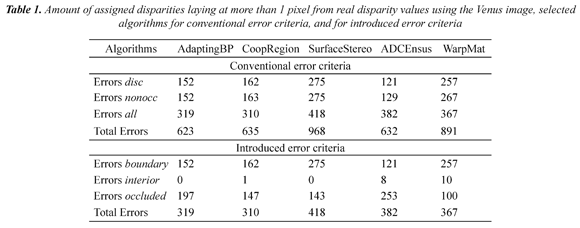
Most of published papers introducing SCA rely on the use of the Middlebury's methodology (Scharstein & Szeliski, 2002; 2013). This methodology can be analyzed based on the evaluation elements and methods depicted in Figure 1. In particular, three aspects require attention for the sake of the discussion presented in this paper: the error measure, the error criteria, and the evaluation model. Regarding the error measure, the Middlebury's methodology uses the percentage of the Bad Matched Pixels (BMP) as the error measure. The BMP is a binary function, which calculates an estimation error using a threshold and ignores the inverse relation between depth and disparity along with error magnitude (Cabezas et al., 2011). Consequently, it does not properly distinguish between a small and a large disparity error; neither considers if an evaluated point is close or far from the stereo camera system. These considerations are illustrated in Figure 2, assuming a canonical stereo rig. Figure 2(a) and Figure 2(c) illustrate how estimation errors of a same magnitude - represented by points p'r and q'r respectively - may cause different 3D reconstruction errors by triangulation -represented by points P' and Q´, respectively. Figure 2(b) and Figure 2(d) illustrate how a larger estimation error magnitude increases the 3D reconstruction error by triangulation. These 3D reconstruction errors have to be taking into account during an evaluation process. The impact of the limitations of the BMP measure is illustrated in Figure 3. The left view of the Tsukuba stereo image pair and associated ground-truth disparity map are shown in Figure 3(a), and Figure 3(b), respectively (Scharstein & Szeliski, 2013). Figure 3(c) and Figure 3(d) show erroneously estimated disparity maps. Figure 3(e) and Figure 3(f) show corrupted disparity maps by adding salt and pepper noise. It can be observed that the calculated disparity maps in Figure 3(c) and Figure 3(d) contain errors, in the background and the foreground, whilst the maps in Figure 3(e) and Figure 3(f) contain a similar quantity of errors, but with a small and a large magnitude, respectively. In addition, Figure 3 includes the values of the BMP percentage and the Peak Signal-to-Noise Ratio (PSNR) for the estimated disparity maps. It is clear that the BMP is incapable of distinguishing errors of different magnitudes. Regarding error criteria, three of them are simultaneously used in the Middlebury's methodology. The disc criterion considers errors in points near depth discontinuities. The nonocc criterion considers errors in non-occluded points. The all criterion includes the points in the whole image (i.e. for those which a disparity groundtruth value is available). Nevertheless, an image point may be included in more than one error criterion. This is illustrated in Figure 4 using the Teddy stereo image. The ground-truth disparity map of the Teddy image is shown in Figure 4(a). It can be observed that all points included in the disc criterion - Figure 4(b) - are also included in the nonocc criterion - Figure 4(c). In addition, all points included in the nonocc criterion are also included in the all criterion - Figure 4(d). The relation among the points composing each one of the above criterion is illustrated in Figure 4(e) using a Venn diagram. Thus, a disparity estimation error is counted more than once, biasing final scores, in the Middlebury methodology. The multiple counting of errors is quantified in Table 1, using the evaluation of the Venus stereo image, a set of selected algorithms, and the threshold equal to 1 pixel. It can be observed that errors associated to the nonocc criterion are in fact errors associated to the disc criterion. Moreover, the total of score using for ranking is almost twice the number of errors in the disparity map. Regarding the evaluation model, the model of Middlebury's methodology can be seen as a linear function which relates ranks to weights. It is based on sorting BMP scores from each error criterion, ranking sorted positions, and averaging all rankings in order to obtain a final ranking. However, although there are different evaluation methodologies for evaluating SCA, a unique methodology that properly handles all evaluation requirements may not exist. This may be due to, in existing methodologies, evaluation elements and methods are fixed beforehand, assuming that different Research and Development (R&D) processes will have similar evaluation requirements. Consequently, allowed evaluation scenarios are fixed. Nevertheless, requirements may indeed change according to some particularities such as the application domain, or in general, to evaluation goals. In practice, problems arise when specific components of a methodology do not fit to some evaluation requirements, or they do not provide proper feedback. Thus, there is a lack of an adaptive evaluation methodology allowing the selection of diverse evaluation elements and methods. Moreover evaluation results may be biased due to possible shortcomings of considered evaluation elements and methods. In this paper, an evaluation methodology for SCA based on DGTD is presented. The presented methodology introduces a set of error criteria in order to allow a proper analysis of disparity estimation errors. In addition, it includes two evaluation models capable of handling multiple evaluation measures: the A* Groups model (Cabezas et al., 2012a), which is based on the Pareto Dominance relation (Van Veldhuizen et al., 2003), and an extension to the Middlebury's evaluation model (Scharstein & Szeliski, 2002). In this way, the proposed methodology suited to be used in different phases of R&D processes. Experimental results are shown in order to exemplify the versatility of the presented methodology.
2. Related work
The state-of-the-art is briefly reviewed, in thissection, using as reference the methodology presented in Figure 1. An extensive review and a thorough discussion on some mentioned aspects can be found in (Cabezas & Trujillo, 2013).
Test-bed images: Ground-truth data can be generated by either using a ray tracing algorithm -synthetic data-, or, using an active vision technique such as structured light (Scharstein & Szeliski, 2003) or laser scanning (Geiger et al., 2012), among others -real imagery data. Synthetic data, generated considering noise models, have been used in different approaches (Van der Mark & Gavrila, 2006; Neilson & Yang, 2008). However, introduced noise in a systematic way may not necessarily correspond to real image capturing conditions. The generation of DGTD for real imagery is a challenging task, which is not always possible. The Middlebury's methodology use a test-bed of four stereo images (the Tsukuba, the Venus, the Teddy and the Cones stereo images). It is available in an online evaluation platform (Scharstein & Szeliski, 2013). Such test-bed is widely known and used by the stereo vision community. Regarding the quantity of images selected as test-bed, when a small number of images are used, obtained evaluation results may lack of statistical significance (Cabezas & Trujillo, 2013). In general terms, is not convenient to consider the obtained results using a particular test-bed, as of general character (i.e. to be repeatable under a different imagery test-bed) (Cabezas & Trujillo, 2011).
Evaluation criteria: The concept of error criteria was introduced in (Scharstein & Szeliski, 2002) as binary image segmentation. Most of methodologies consider evaluation criteria related to disparity estimation errors, which are related to challenging content for SCA (Scharstein & Szeliski, 2002). However, considering aspects such as the consumed time and required resources (e.g. memory and the use of specialized hardware, among others) may enhance the evaluation process.
Evaluation measures: Several evaluation measures are available in the literature. The BMP is based on counting disparity estimation errors exceeding a threshold δ, the most commonly used value is 1 pixel (Scharstein & Szeliski, 2002). The Sigma-Z-Error (SZE) is based on the inverse relation between depth and disparity, and aims to measure the impact on depth estimation of disparity estimation errors (Cabezas et al., 2011). The Mean Absolute Error (MAE) is based on absolute differences. The Mean Square Error (MSE) is based on quadratic differences, and the Mean Relative Error (MRE) is based on the ratio between absolute differences and the ground-truth disparity (Van der Mark & Gavrila, 2006). The MAE, the MSE, and the SZE are metric functions. However, they are unbounded. In (Cabezas et al., 2012b) is highlighted how obtained evaluation results may vary according to the selection of error measures.
Algorithms and/or algorithmic components: In the one hand,the estimation of stereo corresponding point can be tackled as an optimization problem under a constrained scenario. Consequently, there are multiple approaches for estimating disparity maps. In the Middlebury's online benchmark (Scharstein & Szeliski, 2013) all the reported algorithms are compared regardless the nature of their optimisation technique. Moreover, in some cases, compared algorithms correspond to unpublished works. This makes difficult an analysis of obtained results. On the other hand, for evaluation purposes, it is expected that SCA be executed under the same conditions (i.e. with the same information, or with fixed parameters for the entire test-bed). However, in practice, this may be beyond control of the evaluation methodology.
Evaluation models: The linear approach used by the Middlebury's evaluation model has been used in other methodologies (Cabezas & Trujillo, 2013). In contrast, the A* Groups evaluation model proposed in (Cabezas et al., 2012a) addresses the comparison of SCA as a multiobjective optimization problem. This non-linear model is based on the Pareto dominance relation (Van Veldhuizen et al., 2003), and extends the model introduced in (Cabezas & Trujillo, 2011). It iteratively computes groups of SCA -A* sets- with comparable performance (i.e. not better, neither worst), according to scores of evaluation measures. Computed groups define a partition of the original set of SCA under evaluation. Among them, the A*1 group is of special interest since it is composed by the SCA of superior performance, under a specific evaluation scenario.
Interpret results: In a raking based model, a higher ranking is associated to a superior performance. However, some issues may arise in such model. For instance, two algorithms may have the same error scores but they will not obtain the same ranking. Moreover, it is not clear when two rankings are close or distant enough to affirm that the performance of associated SCA may be considered as similar or different, respectively. In addition, in this model, the number of top-performer algorithms is a free parameter. In contrast, in the A* Groups model, the interpretation of results is defined, without ambiguity, based on the cardinality of the A* set and the group label assigned to it. In this way, researchers and practitioners may obtain an unambiguous feedback.
3. An evaluation methodology
The methodology follows the steps illustrated in Figure 1. It offers the possibility of choosing different evaluation elements and methods, according to evaluation requirements. Moreover, it includes an extension to the Middlebury's evaluation model by considering multiple error measures, and introduces a formalization of error criteria.
3.1 Multiple error measures with different properties
The MAE, the MSE, the MRE and the SZE measures consider the disparity estimation error magnitude. In addition, the MRE and the SZE measures consider the inverse relation between depth and disparity. The use of multiple measures, with different properties makes an evaluation process less sensitive to the selection of error measure, since each one may capture a different aspect of the estimated maps. In this way, the possible weaknesses of a specific measure may be compensated by the strength of another one. Moreover, different measures can be used in a complementary way focusing on measuring specific aspects.
3.2 An error criteria definition
An error criterion is conceived as a membership function defining a set partition of points (pixels) belonging to a disparity map. It identifies challenging image points associated to a specific and unique meaning. For the sake of completeness, required concepts are defined as follows. Let I be a set of image points composing the reference view from a stereo image pair:

where T is the amount of points composing a reference image for which ground-truth disparity value is known. Let M be a set defined as:

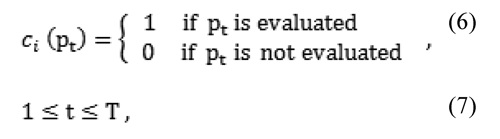
In addition, a set C of error criteria is considered. Let C be a set of onto-functions defined as:

where:

Thus, an error criterion ci is an onto-function with domain in I, and codomain in M:

where:
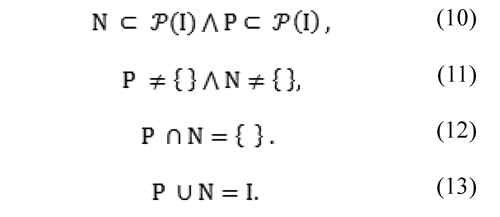
where Pis a positive subset of I, according to the onto-function ci, defined as:

Analogously, let N be a subset of I, according to the onto-function C, defined as:

Thus, an onto-function ci defines a partition over I, by fulfilling the following properties:
Let PCk be the positive set of the onto-function ck
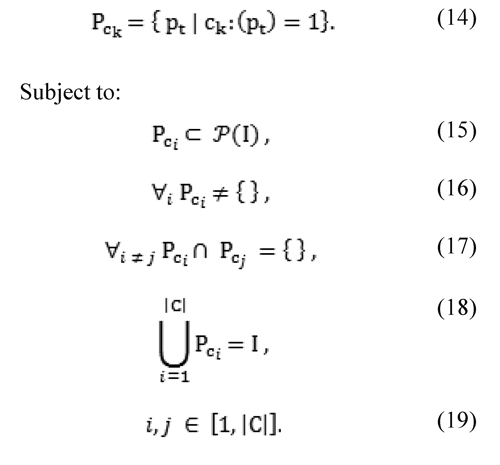
Based on the above definition, three meaningful error criteria are identified as follows.
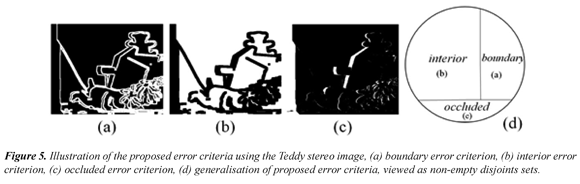
boundary: this criterion considers points near to both depth discontinuities and occluded regions. In this case the property of being near can be computed by a function using thresholds for determining a neighbourhood and what a depth discontinuity is. This criterion offers backward compatibility with the disc criterion used in the Middlebury's methodology. interior: this criterion considers image points which are visible in both stereo images, and far enough from depth discontinuities and occluded regions. occluded: this criterion considers occluded points, which can be detected by forward projecting the reference view, or applying the bi-directional constraint on DGTD.
In practice, each criterion can be represented and stored as a binary image mask. Figure 5 shows the image masks associated to the three proposed error criteria, using the Teddy stereo image. Figure 5(a) illustrates the boundary criterion. Figure 5 (b) illustrates the interior criterion, and Figure 5 (c) illustrates the occluded criterion. Figure 5(d) represents a generalisation of the introduced formalisation, applied to error criteria presented above, as disjoint sets which union compose the set of points to be evaluated in a disparity map.
Following the presented definition for evaluationcriteria, the boundary, the interior and the occluded criteria are composed by different image points. The amount of disparity estimation errors with a deviation of more than 1 pixel from the real disparity value, associated to introduced criteria are shown in Table 1 using the Venus stereo image and a set of selected algorithms. Errors based on a criterion do not imply errors based on another criterion.
3.3 Extending the middlebury's evaluation model
The Middlebury's evaluation model is based on averaged rankings. It considers exclusively the BMP measure. The introduced extension incorporates multiple measures. It is described as follows. The conventional Middlebury's evaluation model is applied, separately, for each selected error measure. Then, the final ranking of each SCA is computed by summing all the intermediate rankings, and sorting the sum. In this way, a discrete value is obtained as result.
A τ threshold (with the number of considered error measures as suggested value), is used to determine if two algorithms show a similar performance, in the following way: if the absolute distance between the sum of rankings is less than τ, the performance of the two algorithms can be considered as similar. This criterion is applied to two algorithms under comparison. It defines a reflexive and symmetric relation. The extension provides robustness by considering multiple error measures.
3.4 An interactive evaluation process
The presented methodology considers several choices during the evaluation process, which are outlined as follows. Test-bed images can be selected, for instance, among the Tsukuba, the Venus, the Teddy, and the Cones stereo images (Scharstein & Szeliski, 2013). The evaluation criteria can be selected either among the introduced criteria (the boundary, the interior, and the occluded error criteria), or among the Middlebury criteria (the nonocc, the disc and the all criteria). Evaluation measures can be selected among available evaluation measures, such as: the BMP, the SZE, the MAE, the MSE, and the MRE, or a combination of them. Evaluated algorithms can be chosen from, for instance, the repository available at (Scharstein & Szeliski, 2013). The evaluation involves a set of algorithms, which can be selected algorithms according to user requirements in order to focus a comparison in SCA based on similar optimisation techniques. The evaluation model can be selected from the A* Groups model (Cabezas et al., 2012a), the Middlebury's model (Scharstein & Szeliski, 2002), or from its introduced extended version.
4. Experimental validation
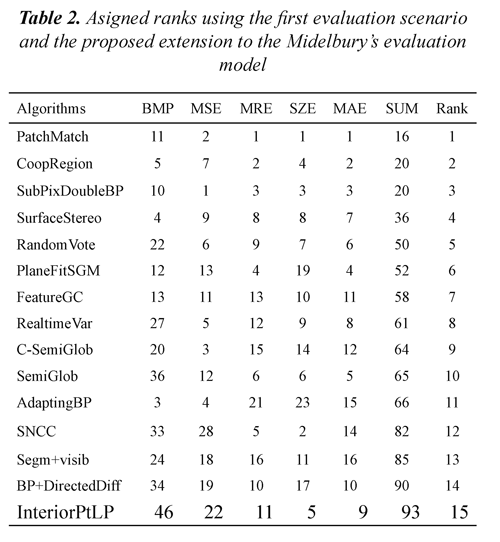
The presented methodology offers multiple evaluation possibilities. Only two different evaluation scenarios are presented in order to illustrate versatility, due to some constraints in space. Both scenarios consider the full set of testbed images available at (Scharstein & Szeliski, 2013). The first scenario is devised for comparing performance of SCA in regions visible in both images. It uses the boundary evaluation criterion, the full set of error measures presented in section 3.4, the entire set of SCA, and the extended Middlebury's evaluation model. The top-fifteen ranked algorithms under this evaluation scenario are shown in Table 2. In this case, the suggested value for the threshold τ is five, which is applied to the sum of rankings. Multiple observations can be extracted from obtained results. For instance, it can be observed that several algorithms belonging to variations of the semi-global approach (Hirschmuller, 2005) are present. Regarding the inclusion of multiple error measures, each measure can be seen as an expert, contributing in a multi-expert evaluation approach, reducing the impact of selecting a single measure. The second scenario is devised to find algorithms showing the best performance (in terms of 3D reconstruction accuracy, by considering the impact of disparity estimation errors) in areas near to depth discontinuities. It uses the occluded evaluation criterion, the MRE and the SZE measures, the entire set of SCA, and the A* Groups evaluation model, which, by definition, properly handles multiple evaluation measures. The members of the A*1 set are: WarpMat, SurfaceStereo,
Unsupervised, AdaptingBP, Segm+visib, ObjectStereo, and AdaptingOverSegBP, CurveletSupWgt, and InteriorPtLP (Scharstein & Szeliski, 2013). Several of them use an approach based on segmentation, assigning disparity values to each segment. Eight groups of SCA are selected by the used evaluation model. The cardinality of each A*group is: |A*1| = 9, |A*2|=24, |A*3|=23, |A*4|=14, |A*5|=9, |A*6|=11, |A*7|=8, |A*8|=7, and |A*9|=6 respectively.
5. Conclusions
An interactive evaluation methodology for comparing SCA, considering the use of multiple error measures with different evaluation properties was presented. Taking this into account, an extension to the Middlebury's evaluation model was introduced. Moreover, the presented methodology introduces a defintion of error criteria avoiding ambiguity during the gathering of score errors, along with an innovative criterion allowing the evaluation of disparity assignations in occluded regions. Error measures and error criteria are selected by a user, in order to obtain more reliable and useful evaluation results. In this way, users are allowed to define different evaluation scenarios, according to evaluation requirements. Thus the presented methodology provides state-of-the-art evaluation capabilities. Nevertheless, although the extension to the model introduces reliability to evaluation results, it may no alleviate the inherent issues of a ranking based model. Thus, the use of the A* Groups model, which is based on the Pareto dominance relation, arises as a proper alternative.
6. References
Cabezas, I., & Trujillo M., (2013). Methodologies for evaluating disparity estimation algorithms. In, J. García-Rodriguez & M. Cazorla (Eds.) Robotic Vision - Technologies for machine Learning and Vision Applications, (cap. 10). Hershey PA: Information Science Reference - IGI Global. [ Links ]
Cabezas, I., & Trujillo, M. (2011). A non-linear quantitative evaluation approach for disparity estimation. International Conference on Computer Vision, Theory and Applications (pp. 704-709). Algarve, Portugal. [ Links ]
Cabezas, I., Padilla, V., & Trujillo, M. (2011). A measure for accuracy disparity maps evaluation. Iberoamerican Congress on Pattern Recognition . Lecture Notes in Computer Science (vol. 7042) (pp. 223-231). Buenos Aires, Argentina: Springer. [ Links ]
Cabezas, I., Padilla, V., Trujillo, M., Florian, M. (2012). On the impact of the error measure selection in evaluating disparity maps. World Automation Congress - WAC (pp. 1-6). Puerto Vallarta, Mexico. [ Links ]
Cabezas, I., Trujillo, M., Florian, M. (2012). An evaluation methodology for stereo correspondence algorithms. International Conference on Computer Vision, Theory and Applications (pp. 154-163). Rome, Italy. [ Links ]
Geiger, A., Lenz, P., & Urtasun, R., (2012). Are we ready for autonomous driving? The KITTI vision benchmark suite. IEEE Conference on Computer Vision and Pattern Recognition (pp. 3354-3361). [ Links ]
Hirschmuller, H., (2005). Accurate and efficient stereo processing by semi-global matching and mutual information. IEEE Conference on Computer Vision and Pattern Recognition (pp. 807-814). [ Links ]
Neilson, D., & Yang, Y. (2008). Evaluation of constructible match cost measures for stereo correspondence using cluster ranking . Computer Vision and Pattern Recognition. IEEE Computer Society (pp. 1-8). [ Links ]
Scharstein, D., & Szeliski, R. (2002). A taxonomy and evaluation of dense two-frame stereo correspondence algorithms. International Journal of Computer Vision , 47, 7-42. [ Links ]
Scharstein, D., & Szeliski, R. (2003/06/18-20). Highaccuracy stereo depth maps using structured light. In IEEE. Computer Vision and Pattern Recognition, 2003. Proceedings. 2003 IEEE Computer Society Conference on . (pp. 195-202). [ Links ]
Scharstein, D., & Szeliski, R. (2013). Middlebury stereo evaluation - version 2 . Recovered 2013/12/15 http://vision. middlebury.edu/stereo/eval/ [ Links ]
Trucco, E., & Ruggeri, A. (2013). Towards a multi-site International public dataset for the validation of retinal image analysis software . International Conference of the IEEE Engineering in Medicine and Biology Society (pp. 7152-7155). Osaka, Japan: IEEE. [ Links ]
Van der Mark, W., & Gavrila, D. (2006). Real-time dense stereo for intelligent vehicles. IEEE Transactions on Intelligent Transportation Systems , 7 (1), 38-50. [ Links ]
Van Veldhuizen, D., Zydallis, J., & Lamont, G. (2003). Considerations in engineering parallel multiobjective evolutionary algorithms. IEEE Transactions on Evolutionary Computation , 7(2), 144-173. [ Links ]
Wang, Z., Bovik, A., Sheikh, H., & Simoncelli, E. (2004). Image quality assessment: from error visibility to structural similarity. IEEE Transactions on Image Processing, 13 (4), 600-612. [ Links ]

Revista Ingeniería y Competitividad por Universidad del Valle se encuentra bajo una licencia Creative Commons Reconocimiento - Debe reconocer adecuadamente la autoría, proporcionar un enlace a la licencia e indicar si se han realizado cambios. Puede hacerlo de cualquier manera razonable, pero no de una manera que sugiera que tiene el apoyo del licenciador o lo recibe por el uso que hace.
