


Serviços Personalizados
Journal
Artigo
 Inglês (pdf)
 Artigo em XML
 Referências do artigo
 Enviar este artigo por email
Indicadores
-
 Citado por SciELO
 -
 Acessos
Links relacionados
-
 Citado por Google
 -
 Similares em
SciELO
Similares em
SciELO -
 Similares em Google
Compartilhar

 Permalink
Ingeniería y competitividad
versão impressa ISSN 0123-3033
Ing. compet. vol.15 no.2 Cali jul./dez. 2013
Water Safety Plans: Risk assessment for consumers in Drinking Water Supply Systems
Planes de Seguridad del Agua: Evaluación del riesgo en el usuario final de Sistemas de Abastecimiento de Agua Potable
Andrea Pérez-Vidal
Facultad de Ciencias e Ingeniería, Programa de ingeniería Sanitaria, Universidad de Boyacá, Tunja, Colombia
E-mail: aperezv@uniboyaca.edu.co
Claudia Amézquita-Marroquín
Grupo de Investigación Estudio y Control de la Contaminación Ambiental, Facultad de Ingeniería, Universidad del Valle, Cali, Colombia
E-mail: claudia.amezquita@correounivalle.edu.co
Patricia Torres-Lozada
Grupo de Investigación Estudio y Control de la Contaminación Ambiental, Facultad de Ingeniería, Universidad del Valle, Cali, Colombia
E-mail: patricia.torres@correounivalle.edu.co
Eje temático: Sanitary and environmental engineering / Ingeniería sanitaria y ambiental
Recibido: 22 de Abri de 2013
Aceptado: 24 de Junio de 2013
Abstract
Consumers are the last stage in Drinking Water Supply Systems (DWSS) and they are characterized by their vulnerability to hazards due to the proximity of consumption point. The aim of this study is to carry out the risk assessment on water consumer in DWSS in Cali, which is supplied by Cauca River and framed in the philosophy of Water Safety Plans (WSP). Tools such as the matrix of hazards or hazardous events, monitoring water quality, conducting household surveys, and a semi-quantitative matrix for risk estimation were used. The results showed consumers' low perception on health risk and a lack of knowledge on their responsibility for protecting drinking water quality, which can lead to an inappropriate behavior affecting the integrity of the internal distribution system. Although most analyzed variables met national regulations, some monitored points into buildings showed low values of residual chlorine and high values of heterotrophic plate count bacteria, suggesting potential risks related to the presence of biofilms. The participation and commitment to fall involved stakeholder actors are key strategies to avoid misbehaviors, and thus, reduce risks. Besides, the promotion of educational campaigns as indicated by national regulations must be performed.
Keywords: Consumer, Drinking Water, Risk Assessment, Water Quality, Water Safety Plan - WSP.
Resumen
El usuario final es el último componente de los Sistemas de Abastecimiento de Agua Potable (SAAP) y se caracteriza por su vulnerabilidad frente a los peligros debido a su cercanía al punto de consumo. En este estudio se realizó la evaluación del riesgo en el usuario final del SAAP de la ciudad de Cali abastecido por el río Cauca, enmarcado en la filosofía de los Planes de Seguridad del Agua (PSA), usando herramientas como la matriz de peligros/eventos peligrosos, el monitoreo de calidad de agua, la aplicación de encuestas a los usuarios y la construcción de matrices semicuantitativas para estimación de riesgos. Los resultados evidenciaron poca percepción del riesgo y desconocimiento de la responsabilidad del usuario final en la protección de la calidad del agua, lo que puede generar conductas inadecuadas comprometiendo la integridad del sistema interno de distribución. Aunque la mayoría de variables analizadas cumplieron la reglamentación nacional, algunos puntos registraron bajos valores de cloro residual y elevado recuento de bacterias heterotróficas, lo que sugiere potenciales riesgos por presencia de biopelícula. La participación y compromiso de todos los actores involucrados son estrategias fundamentales para evitar conductas inadecuadas y reducir riesgos, además del fomento de campañas educativas como lo indica la reglamentación nacional.
Palabras claves: Agua potable, calidad del agua, evaluación del riesgo, Plan de Seguridad del Agua - PSA, usuario final.
1. Introduction
In a traditional approach, drinking water suppliers are usually required to verify that the quality of the water supplied to consumers meets the specified regulation, but a final water quality monitoring is not enough because its analysis results do not always allow to take opportune measures to prevent health risks before its distribution to consumers; besides, there are other factors such as low representativeness and monitoring frequency, and shortcomings in some microbiological contamination indicators. Therefore, an over reliance on the so-called end-of-pipe monitoring is both inadequate and expensive (WHO & IWA, 2010). Due to those limitations, the World Health Organization (WHO) has recommended the adoption of Water Safety Plans (WSP) as an effective strategy to reduce health risks and prevent contamination before drinking-water reaches the consumer.WSP is an integral approach of risk management that covers all components in a drinking water supply system(DWSS), from catchment to consumer. Its aims are to protect public health and promote good practices such as preventing or minimizing water source pollution, reducing or removing pollutants through treatment processes, and preventing its contamination during its storage, distribution, household connections and handling (Bartram et al. 2009, WHO, 2011a).
Periods of time with low or zero water consumption in buildings leads to the lowering of residual chlorine and the formation of Disinfection By-Products (DBPs) caused by an increase in water age (Pinney et al., 2006). Also, inconvenient designs and the periodic maintenance of storage tanks lead to a residual disinfectant loss and a microbiological risk increase, affecting drinking water quality (Lee & Schwab, 2005; Graham &Vanderslice, 2007; Montoya et al., 2012). Additionally, factors such as the age and material of internal pipelines, cross-connections, backflow, low pressures, discontinuity or intermittence in service, poor hygiene practices and lack of knowledge regarding adequate household water management (CEHI et al., 2009; Cunliffe et al., 2011), easing sediment drag due to hydraulic regimes, chemicals leaching by corrosion of pipelines and accessories, and biofilm formation (Lee & Schwab, 2005; Pinney et al., 2006; Jiménez & Rose, 2009; Silva et al., 2009).
National regulations and some international regulations rule the responsibility for drinkingwater quality supplied by water service companies only cover the municipal distribution systems until they reach household water meters. Then, the consumers are responsible for drinking water internal distribution systems, they sometimes do not know their responsibility is important (MPS, 2007; Silva et al., 2009). In Colombia, hydrosanitary facilities are regulated by the Colombian Plumbing Code NTC 1500 (ICONTEC, 2004) and the Article 10 of the Decree 1575/07 (MPS, 2007) that establishes consumers' responsibilities for drinking water quality protection once it is delivered to households through municipal distribution systems. Furthermore, an initiative to issue a technical regulation related to hydrosanitary facilities into buildings and houses, and good engineering practices, called RETHISA (FONADE, 2012) has been brewing with the objective to keep the effort that has been achieved by drinking water suppliers, nationwide.
The lack of regulations and little evidence of epidemiological studies, that associate deficiencies in drinking-water quality within buildings with risk to health, mainly in developing countries, reflect the importance of increasing researches on water quality in this DWSS component. This also reflects a need of having preventive measures for managing this risk, as a strategy for guarantying water quality and health protection for the consumer (Lee & Schwab, 2005).A step to develop WSP includes hazard identification and risk estimation, which are general issues in risk assessment, adopted by different expert committees, regulatory agencies, health institutions among others (Tuhovcak et al., 2009; WHO, 2011b). This study was aimed to assess health risks for consumers from DWSS in Cali supplied by the municipal distribution system (MDS) called low network.
2. Methodology
Although there are four different drinking water distribution systems in Cali, this study was developed in municipal distribution system (MDS), which is supplied by the Cauca River and covers about 80% of the population of the city of Cali. It was supported by the WSP team led by members of the academic sector and the water supplier company. This study comprises three steps: 1) Compilation, processing and analysis of available information 2) Hazard identification and 3) Risk assessment.
2.1 Compilation, processing and analysis of available information
Technical visits to the water provider company, health institutions, educational institutions and municipal planning took place in order to compile information such as i) reports on water quality monitoring in the MDS, ii) reports on distribution system pressure, iii) statistics or epidemiological studies on water-borne diseases, iv) population density inareas (these areas are called "comunas", and are composed by several neighborhoods), v) location maps of educational, health and commercial institutions, among others. Additionally, obtained results in previous studies carried out in the DWSS in Cali were used as a support (Rosero et al., 2005; Muñoz et al., 2007; Montoya et al., 2009; Sánchez et al., 2010; Montoya et al., 2012).
2.2 Hazard identification
Three tools to identify hazards: i) matrix of hazards and hazardous events (Bartram et al. 2009), ii) water quality monitoring (MPS & MAVDT, 2007) and iii) household surveys (CDC, 2008; CEHI et al., 2009; Jiménez & Rose, 2009; MWH, 2009; Cunliffe et al., 2011) were selected.
2.2.1 Matrix of hazards and hazardous events
Hazards and hazardous events that could disrupt water quality within housings considering hydraulic factors, design aspects, hygiene practices, among others were systematized. The matrix results were discussed and fed back with the WSP team members.
2.2.2 Water quality monitoring
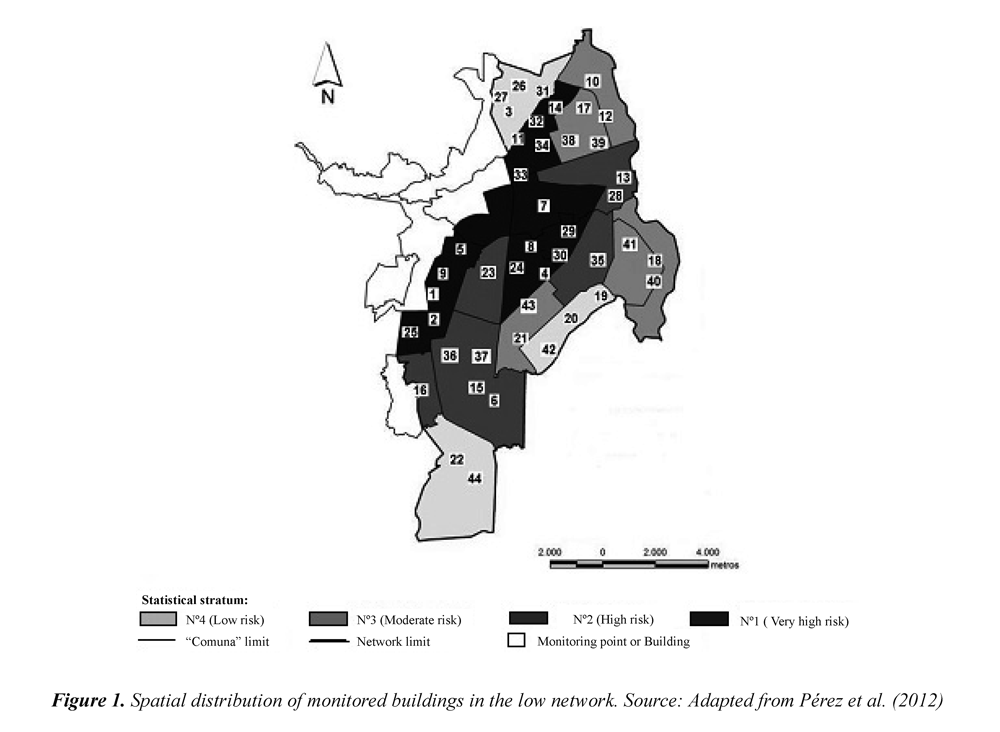
From the risk map built for the MDS by Pérez et al.,(2012), in which four risk levels (very high, high, moderate and low) were identified. A stratified randomly sampling by ratios, defining as astatistical stratum the cluster of "comunas" that have a similar risk level, was designed (Cochran, 1976; CDC, 2008; Pérez et al., 2012). In order to establish the sample size, pressure data in the municipal distribution system and historical reports on water quality in 2000-2010 were processed and analyzed. The aim was to select the parameter with the highest variability to generate the largest sample size (CDC, 2008), in this case, the "pressure in the municipal distribution system". The sample size was estimated with a 95% of confidence level and 10% of error by means of the Eq. (1) (Cochran, 1976).

Where:
n=sample size
L =number of statistical strata
Nh=number of households in each stratum
Wh=weight of each stratum regarding the total amount of households in Cali
Ph=proportion of non-fulfillment of regulation in h stratum
Qh = proportion of fulfillment of regulation in h stratum
The sample size calculated was 44, which was distributed using Eq. (2) for each statistical stratum (nh).The number of households to be monitored for the statistical stratum Nº1 (very high risk) was 15, for the statistical stratum Nº2 (high risk) 9; the statistical stratum Nº3 (middle risk) 10 and for the statistical stratum Nº4 (low risk) 10.

For achieving water quality characterization, a data base per "comuna" with specific information on institutional, commercial and residential households was constructed. It allows to select and prioritize the monitoring points as the building with the highest agglomeration of people functioning such as hospitals, clinics, schools, colleges, multi-family housing and condominiums because they are the most vulnerable places (Cunliffe et al. , 2011). Figure 1 shows the spatial distribution of the selected buildings to be monitored, as a function of statistical strata defined from the MDS risk map. 41% of buildings correspond to educational institutions, 20% to heath institutions, 32% to residential urbanizations and 7% to commercial buildings. Four monitoring campaigns were made in a 6-monthperiod, taking drinking water samples in two points within the 44 selected buildings. The physical-chemical and microbiological variables characterized according to APHA et al. (2005) were pH, residual chlorine and turbidity (measured in situ) and apparent color, conductivity, iron, manganese, lead, copper, zinc, Escherichia coli and total and fecal coliforms.
2.2.3 Conducting a household surveys
A survey with seven questions based on the recommendations of CDC (2008) and MWH (2009) was designed and addressed to both inhabitants as administrators and/or building workers, according to that defined by Cunliffe et al. (2011). The survey included questions about household storage and treatment practices, consumer perceptions, satisfaction and health concerns. The statistical design to survey conduction was based on the stratified random methodology by ratios with allocation of minimal variance (Cochran, 1976). The same statistical strata established for water quality monitoring were used, assigning the sample size as the heterogeneity function within each stratum. The sample size was taken from 35 buildings, where 3 users were surveyed in each building, with 95% of confidence level and 10% of precision error, and a total of 105 surveys distributed as follows: 9, 33, 42 and 21 for the statistical strata 1 to 4 respectively.
2.3 Risk assessment
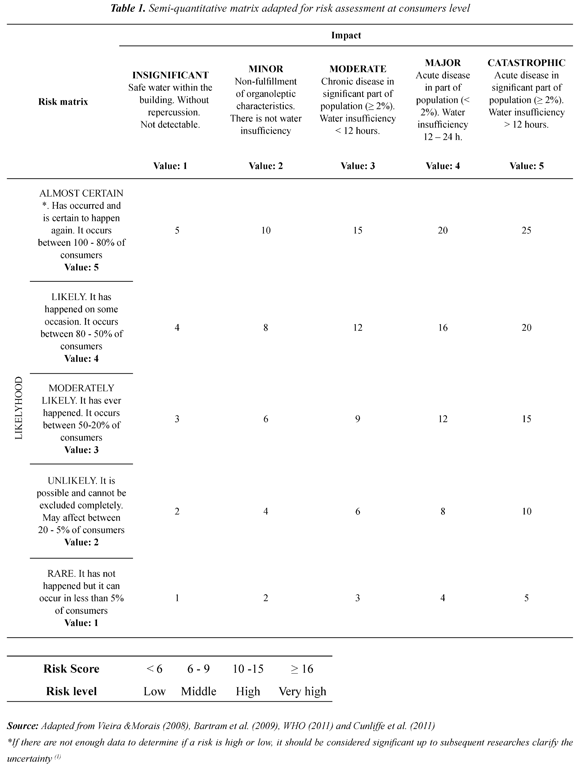
The risk estimation per each identified hazardous event in the previous stage was achieved, using semi-quantitative risk matrices recommended for WSP development; Table 1 shows the adapted semi-quantitative risk matrix, based on the suggestions of several authors (Vieira & Morais, 2008; Bartram et al., 2009; WHO, 2011b; Cunliffe et al., 2011).The matrix was used to estimate the risk, classifying them in four levels and according to the obtained punctuation: Low (< 6), Middle (6 - 9), High (10-15) and Very high (≥16). As part of the risk assessment, a risk estimation with and without control measures was performed.
3. Results and discussion
3.1 Compilation, processing and analysis of available information
While collecting information, the lack of available data on monitoring and controlling water quality within buildings, morbidity statistical reports or epidemiological studies associated to waterborne diseases, characteristics of internal hydro-sanitary facilities, hygiene practices and household water treatment systems, was evidenced. Despite that, the compiled information provided enough inputs to apply hazard identification tools. The lack of information was observed as a general condition in different DWSS, mainly in WSP experience reported in Latin America and the Caribbean (RED - PSA/LAC, 2012), which could be an obstacle to have a precise and reliable knowledge on the potential risk for the consumer. This situation and the proximity between a consumer or a consumption point and a contamination source increase the vulnerability of this DWSS barrier, e.g. if a hazardous event producing drinking water contamination in a building takes place, there will not be enough contact time for the residual disinfectant to counteract the hazards, especially microbiological ones (Lee & Schwab, 2005; Graham & Vanderslice, 2007; CEHI et al., 2009; Montoya et al., 2012).
3.2 Hazard identification
3.2.1 Matrix of hazards and hazardous events
Using the compiled information analysis reported in literature, and the WSP team support, nine hazardous events were identified and used to elaborate the detailed matrix in Table 2. The hydraulic system in buildings is designed, installed and controlled independently of the aqueduct system, causing hazards and specific hazardous events occurrence. Water quality management within buildings can be complex due to multiple factors such as: i) the specific use of buildings (e.g. hospitals, medical center, etc.), ii) use of alternative supply sources (wells, cisterns, rain water, etc.), iii) vulnerability of population (elderly, patients, children, etc.) iv) multiple owners, of common goods (e.g. residential complexes) and v) drinking water connection with cooling tower devices, condensers, boilers, pools, washing machines (clothes and dishes), dentist chairs, medical equipment, etc. (Cunliffe et al., 2011).
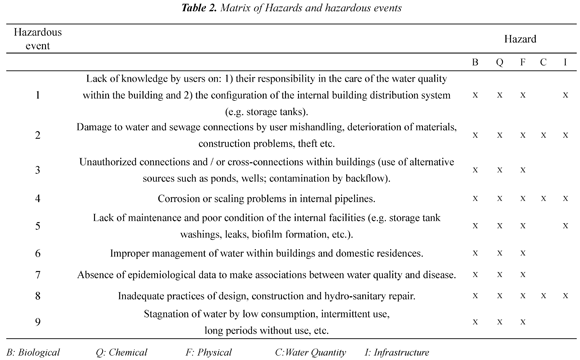
Although the water service company accomplishes to ensure water quality along the municipal distribution system, it is clear that potential hazards that can affect its quality once it enters buildings exist. In countries, such as the United States of America, have been evidenced that 51% of waterborne disease outbreaks at a household level are generated by cross connections or backflow, 39% take place due to internal pipelines fails in buildings, and 10% due to water contamination in storage (Moe & Rheingans, 2006). The coordinated work between the service provider company and all stakeholders (consumers, building administrators, designers and construction sectors, heath entities, etc.) would considerably reduce the impact associated to most hazardous events previously identified.
These events have also been considered in studies such as those of Beuken et al. (2008), and cited by authors like Bartram et al. (2009) and Cunliffe et al. (2011).The expedition of the RETHISA technical regulation in Colombia will become an important control instrument that can contribute to reduce the impact of some hazardous events identified in the matrix.
3.2.2 Water quality monitoring
Figure 2 synthesizes part of the obtained results while monitoring key variables such as residual chlorines, turbidity, heterotrophic bacteria and pH. It was accomplished according to WSP recommendation for operational monitoring for both MDS and the consumer (WHO, 2011b; Bartram et al., 2003; Mons et al., 2007).
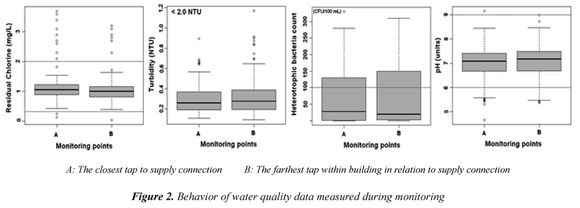
Wilcoxon test implementation showed that there are no significant differences in water quality between A and B points in the buildings, obtaining a p-Value> 0,05 in all measured variables, except residual chlorine that presented three monitoring values close to 0,05, indicating a possible demand of chlorine within the buildings. This could be due to factors such as low or null consumption, presence of a biofilm in pipelines, inadequate design and maintenance practices of storage tanks, among others (Lee & Schwab, 2005; Pinney et al., 2006; Graham & Vanderslice, 2007). 93% of residual chlorine data complied with national regulations, presenting some atypical data mainly higher to 2,0 mg/L that do not surpass the guide value of 5,0 mg/L established by WHO (2011) and three minor data at 0,3 mg/L registered in buildings with reservoir tank and located in the highest risk zone of MDS. In each monitoring, turbidity was <1 NTU, complying with the national regulation (2 UNT) (MPS & MAVDT, 2007) as well as the established values of the European Union (1998) and EPA (2009); additionally, the median values, at both A and B were lower to 0,3 NTU.
Regarding heterotrophic plate count bacteria (HB), used as an indicator in treating and disinfecting water and in detecting the presence of biofilms (WHO, 2004), only 75% of data complied with the regulated value (<100 CFU/100ml).This indicates a possible biofilm presence in internal network systems that could be responsible for the residual disinfectant loss, higher bacteria levels, organoleptic changes and induced corrosion by microbial activity (Bartram et al., 2003; Pinney et al., 2006). The main factors that ease the HB proliferation are temperature, nutrient availability (included organic carbon), absence of residual concentrations of disinfectant and water stagnation (WHO, 2005); the last factor is common in big buildings such as multi-family buildings or shopping malls compared with singlefamily units, is caused to the complexity of the internal network system which is no adequately treated (Pinney et al., 2006).
82% of pH data complied with national regulations and oscillated in an appropriated range for the effective action of the residual disinfectant over microbiological hazards such as viruses and bacteria (WHO, 2011b); however it is probable that the low-pH observed values promote corrosion problems in pipelines and accessories susceptible to leaching (e.g. lead pipes, galvanized iron, etc.) (Jiménez & Rose, 2009).
In the case of pathogens, a punctual and sporadic fecal coliforms presence (4,7% of data) and E. Coli (1,7% of data) was found in some buildings, which could be associated to recent fecal contamination; because it is not very probable that nutrients and temperature in MDS ease their proliferation (WHO, 2004). Water contamination could be the result of inadequate hygiene or inadequate storage practices in tap accessories as reported by CEHI et al.(2009), who tested drinking water samples in buildings with and without storage tanks. He found an increase in the total coliform and E. Coli counting in water samples taken in tanks compared with those analyzed directly in taps. The analysis of variables, such as alkalinity, Zn and Pb, indicated the regulation accomplishment in 100% of data, and variables such as conductivity, apparent color, Fe, Mn and Cu presented accomplishment values between 98.2% and 99.7%. The low concentration of heavy metals such as Pb and Cu indicated low risk; it is important to highlight that the historical record on the presence of these substances in treated water from drinking-water treatment plants have always been lower than those established in national and international regulations; for this reason, their potential presence in buildings could be associated to pipelines and internal accessories leaching (Cunliffe et al., 2011).
3.2.3 Conducting a household surveys
The survey results and building inventory show that most buildings as edifices, residential complexes, health institutions, and shopping malls have storage tanks. According to Bartram et al (2003) the highest growth of heterotrophic bacteria in big buildings could be associated to the presence of storage tanks, long internal networks and temperature; thus, an adequate water management to ensure an adequate maintenance, cleaning frequency and residual disinfectant concentration are required.
Consumers'lack of knowledge on the configuration of an internal hydraulic system was higher in the statistical stratum Nº 1 (13%) and Nº 2 (22%), corresponding to Very high and High risk levels of MDS. This is a hazardous event whose impact could increase the risk on physical integrity, hydraulic and water quality losses by focusing on the most vulnerable "comunas" of the MDS. According to Cunliffe et al. (2011), the lack of knowledge on the hydraulic system configuration in buildings and the inadequate operation and maintenance are factors that increase health risks. The Decree 1575/07 (MPS, 2007) regulates the cleaning frequency and disinfection of storage tanks (minimum every 6 months), answers to the associated question showed that only 26% of the surveyed consumers knew the regulated cleaning frequency, and they answered every 3 and 6 months; 68% answered with high frequencies (daily, weekly, monthly) and 6% expressed a lack of knowledge or answered with low frequencies (8 - 12 months). Despite that the article 10 of Decree 1575/07 (MPS, 2007) establishes the consumers' responsibility to "keep adequate practices in sanitary conditions in household water connections and drinking-water storage tanks at an intra-domiciliary level" in the survey conducting, it was found that 77% of consumers did not know anything about this topic and only 33% answered to know about their responsibility. Consumers' perception and awareness or knowledge on the potential risk of drinking water contamination within the building distribution system piping and/or storage tanks was evaluated, and it was found that 49% of the respondents answered affirmatively, mentioning among possible causes aging, pipeline material and the lack of maintenance; the other 51% answered "no" or "do not know" over the possible existing risk. According to Silva et al. (2009) and Mora et al. (2010), the low risk perception makes inadequate behaviors in the management and caring of water quality possible fact. Thus, training consumers on these topics can have relevant impacts on public health.
Although consumers' complains on water quality represent an important input to evaluate the DWSS, they are not indicative as a unique variable to be measured in order to evaluate consumers' satisfaction, mainly when persistent or continuous problems to which consumers do not complain take place. For this reason, surveys become a great usefulness and complementary (MWH, 2009) tool, easing hazardous events identification that could compromise water quality. The survey results related to consumers' perception on water quality provided by the service provider company (Figure 3) show a high satisfaction degree and confidence (in average 93% of consumers considered water quality to be excellent and good).
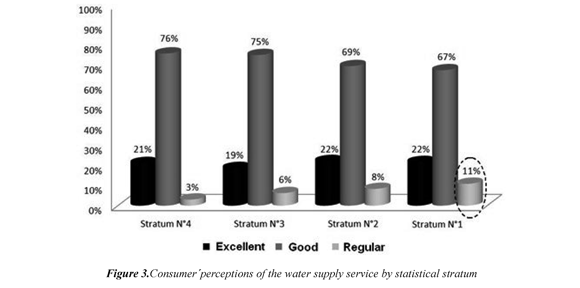
It is important to highlight that the highest dissatisfaction with water quality was concentrated in the statistical stratum Nº1, which corresponds to "comunas" with higher vulnerability to loss the physical and hydraulic integrity of the MDS. With respect to service continuity, 70% of surveyed consumers regarded it as good, 16% as excellent, 12.3% as average, and 1.7% as bad; answers that are probably influenced by the increase of drinking water service breaks, which are due to high contamination events and turbidity of Cauca river that obliges to close water catchment.
Consumers' confidence and satisfaction degree in the drinking water supplied by the company was also reflected in the high percentage (78%) of consumers who consume water directly from tap and the remaining 22% consume from other sources (48% bottled water, 33% boiled water, and 19% use domestic filters). It is important to remark that the Viceministerio de Agua y Saneamiento revealed a report from Procuraduría General de la Nación on the quality of the water consumed in Colombia, in which the drinking water in Cali was pointed to be the best in the country in terms of quality coverage and continuity, despite the characteristics of the raw water. On the other hand, an analysis made in 121 drinking water samples by Municipal Health Institution, in March 2012, ratifies the values of the risk index IRCA between 0 and 5%, indicating that there are no health risks (El País, 2012).In general, the survey results identify and verify part of the hazardous events posed in the hazard matrix, such as consumers' lack of knowledge of the hydraulic-system configuration and maintenance, and their responsibility to ensure water quality within buildings. Additionally, surveys showed their potential as a tool to identify hazards in the consumer, and as a support in the WSP development as indicated by CDC (2008).
3.3 Risk assessment
Table 3 synthesizes the obtained results in the risk estimation without and with existing control measures for each one of the hazardous events summarized in Table 2. The results of risk assessment indicate that despite the existence of some control measures, all hazardous events presented risk levels between very high and high, indicating the necessity of additional control measures and to strengthen or improve the existing ones. The presence of high risk levels reflects the difficulty for controlling water quality in this DWSS barrier, mainly due to the lack of governance by the service provider company, the existence of multiple stakeholders (health institutions, designers and builders sector, administrators, community, etc.). Another reason is consumers' the lack of interagency cooperation, awareness, knowledge and compromise by regarding their obligations to ensure water quality.
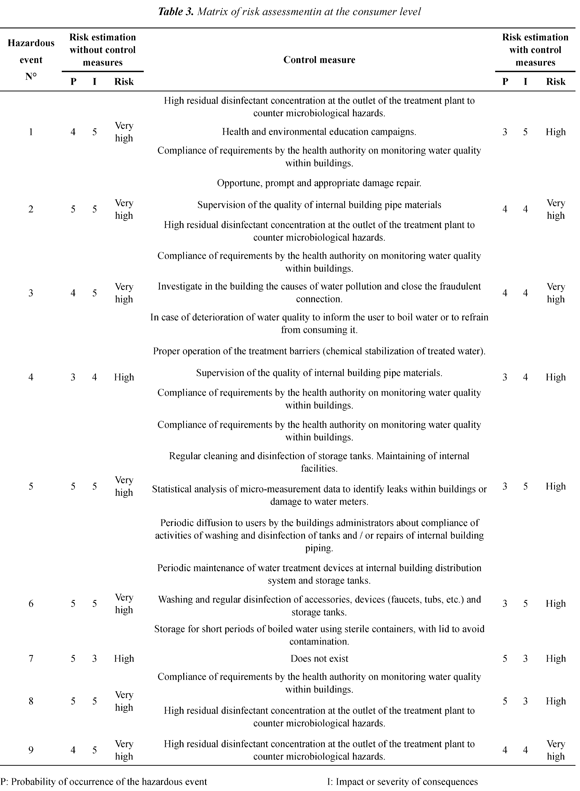
The results also show that the treatment and distribution of drinking water are not the unique control barriers to ensure the optimal quality of treated water. The correct management of water at intra-domiciliary level, the design, operation and maintenance of internal networks and activities of surveillance and control of water quality by health entities are of vital importance. According to Gundry et al. (2004) and Mora et al. (2010) the adequate treatment and distribution of drinking water, added to hygiene and water use at intra-domiciliary level are fundamental strategies to diminish morbidity by diarrhea diseases in consumers.
While identifying control measures, new measures that could reduce the risk level of some hazardous events were proposed. They can be evaluated to be implemented in the near future, and they should be considered as part of a risk management plan in the WSP. These are some of them: i) reviewing and approving hydro-sanitary facility designs within buildings in order to avoid cross connections and demanding device implementation to avoid backflow, ii) broadcasting by mass media (radio, television, payment receipt, etc.) and sanitary and environmental educational campaigns to train consumers on the adequate use of service and internal installations and responsibilities of consumers related to ensure the water quality within households and the mechanisms to prevent and reduce risk (this program is the responsibility of health and environmental entities, as well as by drinking water companies - Decree 1575/07 (MPS, 2007), iii) training or educating consumers, building administrators, community action groups, watch committees on sanitary issues and their legal responsibilities for controlling water quality within buildings and its impact on health derived from internal contamination, iv) relocating water meters within buildings in order to avoid theft or vandalism, v) achieving programs for replacing and maintaining supply connections, vi) supervising the material quality used in supply connections, pipelines, faucets, tanks, etc.
4. Conclusions
Consumers are very vulnerable against the presence of hazards, mainly microbiological in the drinking water supply system - DWSS. This is due to their proximity between consumption and contamination source points, which could generate massive problems in population's health. The risk assessment evidenced the importance of their role as a supporting tool for ensuring water quality, since it can allow them to identify the hazardous events within buildings and to estimate associated risks.
The participation and commitment of all stakeholders (Provider Company, health entities, residents, administrators, designers, builders, etc.) is a fundamental strategy to avoid inadequate behaviors, and reduce health risks related to cross connections, inadequate design, failure in operation and maintenance of internal networks and storage tanks, hygiene practices and water management.
Most analyzed variables during water quality monitoring within buildings showed the accomplishment of the national regulations on turbidity and substances of sanitary interest such as lead and copper. Some monitoring points registered low residual chlorine values linked with heterotrophic bacteria counts, which are higher than the regulated values, indicating a potential risk by the presence of biofilms. The upcoming issue of the national regulation and the manual of good engineering practices for designing, operating and adequately maintaining internal hydro-sanitary connections becomes a key instrument to support the risk management plans in DWSS.
Consumers' lack of knowledge regarding the configuration of the internal hydro-sanitary system and their responsibility to ensure water quality within buildings becomes a hazardous event whose risk level could be mitigated by means of promoting educational campaigns addressed to DWSS consumers. Sanitary and environmental authorities and the water service provider must be in charge of carrying out these campaigns, aiming to promote and broadly broadcast consumers' responsibilities to ensure water quality within households and mechanisms to prevent and reduce risks.
5. Acknowledgment
The authors thank the support of Colciencias for its financial support in co-sponsoring this research along with EMCALI EICE ESP and Universidad del Valle. They also thank Colciencias and Universidad del Valle for promoting programs for PhD. students and Young Researchers.
6. References
APHA (American Public Health Association), AWWA (American Water Works Association) & WEF (Water Environmental Federation). (2005). Standard Methods for the Examination of Water and Wastewater (21 ed.). Washington: APHA, AWWA. [ Links ]
Bartram, J.C., Cotruvo, J., Exner, M., Fricker, C., & Glasmacher, A. (2003). Heterotrophic Plate Count and Drinking Water Safety, The Signi.cance of HPCs for Water Quality and Human Health . London: IWA Publishing. [ Links ]
Bartram, J.C., Davison, A., Deere, D., Drury, D., Gordon, B., Howard, G., Rinehold, A., & Stevens, M. (2009). Manual para el desarrollo de planes de seguridad del agua: metodología pormenorizada de gestión de riesgos para proveedores de agua de consumo ; Gibebra: Organización Mundial de la Salud. [ Links ]
Beuken, R., Reinoso, M., Sturm, S., Kiefer, J., Bondelind, M., Åström, J., Lindhe, A., e. al. (2008). Identification and description of hazards for water supply systems, A catalogue of today's hazards and possible future hazards, updated version D4.1.4.TECHNEAU European Commission . Recovered 2013/12/15 http://www.techneau.org/fileadmin/files/Publications/Publications/Deliverables/D4.1.4.pdf [ Links ]
CDC (Centers for disease control and prevention). (2008). A guide to conducting household surveys for Water Safety Plans. Atlanta: U. S. Department of Health and Human Services . Recovered 2013/12/15 http://www.cdc.gov/nceh/ehs/gwash/Publications/Guide_Conducting_Household_Surveys_for_Water_Safety_Plans.pdf [ Links ]
CEHI (Caribbean Environmental Health Institute), GWI (Guyana Water Incorporated), NOAA (The National Oceanic and Atmospheric Administration), CDC (Centers for Disease Control and Prevention), Paho-Guyana (Panamerican Health Organization In Guyana) & USGS (Geological Survey). (2009). Water safety plan linden Guyana (vol. 1). Guyana: CEHI. [ Links ]
Cochran, W.G. (1990). Técnicas de muestreo (pp, 149-153). Mexico D.F.: Editorial Continental. [ Links ]
Cunliffe, D., Bartram, J., Briand. E., Chartier, Y., Colbourne, J., Drury, D., Lee, J., et. al. (2011). Water safety in buildings . Geneva, Switzerland: WHO. [ Links ]
El País (2012/03/09). El agua de Cali no está contaminada y es segura para el consumo . Recuperado 2013/12/15 http://www.elpais.com.co/elpais/cali/noticias/agua-cali-esta-contaminada-y-representa-riesgo-para-salud-dice-cvc-y-alcaldia [ Links ]
EPA (Environmental Protection Agency). (2009). National primary drinking water regulations , EPA 816-F-09-004. Recovered 2013/12/15 http://www.epa.gov/ogwdw/consumer/pdf/mcl.pdf [ Links ]
FONADE (Fondo Financiero de Proyectos de Desarrollo). (2012). Consultoría para realizar el documento inicial de manual de buenas prácticas de ingeniería correspondientes a las instalaciones hidráulicas y sanitarias al interior de la vivienda, que forme parte del RAS . Ministerio Vivienda, Ciudad y Territorio. Convenio interadministrativo 211042 Bogotá, Colombia. Recuperado http://www.fonade.gov.co/ [ Links ]
Graham, J., & Vanderslice, J. (2007). The effectiveness of large household water storage tanks for protecting the quality of drinking water. Journal of Water and Health , 5, 307-314. [ Links ]
Gundry, S., Wright, J., & Conroy, R. (2004). A systematic review of the health outcomes related to household water quality in developing countries. Journal of Water and Health , 2, 1-13. [ Links ]
ICONTEC (Instituto Colombiano de Normas Técnicas). (2004). Código Colombiano de fontanería . Norma Técnica Colombiana NTC 1500. (p. 96). Bogotá, Colombia: ICONTEC. [ Links ]
Jiménez, B., & Rose, J. (2009). Urban water security: managing risks (1 ed). New York: UNESCO-IHP, Taylor & Francis. [ Links ]
Lee, E., & Schwab, K. (2005). Deficiencies in drinking water distribution systems in developing countries. Journal of Water and Health , 3, 109-127. [ Links ]
Moe, C., & Rheingans, R. (2006). Global challenges in water, sanitation and health. Journal of Water and Health , 4(1), 41-57. [ Links ]
Mons, M., Hambsch, B., & Sacher, F. (2007). Monitoring and control of drinking water quality - Selection of key parameters . TECHNEAU. D 3.1.1/2. pp 20. [ Links ]
Montoya, C., Cruz, C., Torres, P., Laín, S., & Escobar, J. (2012). Evaluación de las condiciones de mezcla y su influencia sobre el cloro residual en tanques de compensación de un sistema de distribución de agua potable. EAFIT , 8, 9-30. [ Links ]
Montoya, C., Loaiza, D., Cruz, C., Torres, P., Escobar, J., & Delgado, L. (2009). Propuesta metodológica para localización de estaciones de monitoreo de calidad de agua en redes de distribución utilizando sistemas de información geográfica. Revista facultad de ingeniería Universidad de Antioquia , 49, 129-140. [ Links ]
Mora, D., Coto, M., & Portuguez, C. (2010). Accesorios domésticos en los grifos y su impacto sobre la calidad del agua para consumo humano; Tres Ríos- La Unión- Laboratorio Nacional de Aguas. In, XXXII Congreso Interamericano de Ingeniería Sanitaria y Ambiental . Punta Cana, República Dominicana. 2010. [ Links ]
MPS (Ministerio de la Protección Social) & MAVDT (Ministerio de Ambiente, Vivienda y Desarrollo Territorial). (2007). Resolución 2115 de 2007 . Bogotá D. C.: República de Colombia. [ Links ]
MPS (Ministerio de la Protección Social) y República de Colombia. (2007). Decreto 1575 de 2007 . Bogotá D. C.: MPS. [ Links ]
Muñoz, N., Sánchez, L., & Delgado, L. (2007). Caracterización Microbiológica y Fisicoquímica en la Red baja de la Ciudad de Cali-Colombia. In, I. Restrepo, L.D. Sánchez, A. Galvis, J. Rojas, & J. Sanabria. Avances en investigación y desarrollo en agua y saneamiento: para el cumplimiento de las metas del milenio en Colombia (pp. 300-313). Cali, Colombia: Universidad Del Valle. [ Links ]
MWH. (2009). Collecting and analysing consumer complaint data, Consumer communication and feeback. Techical Guidance, Toolbox-Water Safety Portal IWA, WHO . Recovered 2013/12/15 http://www.wsportal.org/ibis/water-safety-portal/eng/home [ Links ]
Pérez, A., Amézquita, C., & Torres, P. (2012). Identificación y priorización de peligros como herramientas de la gestión del riesgo en sistemas de distribución de agua potable. Revista Ingeniería y Universidad , 16, 449-469. [ Links ]
Pinney, K., Craik, S., & Gamal, M. (2006). Drinking Water Quality in Buildings Water Quality Best Practices Research Study. Department of Civil and Environmental Engineering , Environmental Engineering Technical Report. Alberta, Canada: University of Alberta - Edmonton. [ Links ]
RED-PSA/LAC (Red de planes de seguridad del agua de Latinoamerica y el Caribe). (2012). Estudios de caso. OPS/OMS, IWA, CDC, EPA, AIDIS y ONU-HABITAT. Recuperado 2013/12/15 http://www.bvsde.paho.org/redpsa/casos/casos.html [ Links ]
Rosero, M., Latorre, J., Torres, W., & Delgado, L. (2005). Presencia de materia orgánica y subproductos de la desinfección con cloro. Caso sistema de tratamiento de agua para consumo humano, Puerto Mallarino, Cali-Colombia. In, Seminario Internacional: Visión Integral en el Mejoramiento de la Calidad del Agua . Cali, Colomabi: Universidad del Valle, Instituto Cinara. [ Links ]
Sánchez, L., Rodríguez, S., Escobar, J., & Torres, P. (2010). Modelación del cloro residual y subproductos de la desinfección en un sector piloto del sistema de distribución de agua potable de la ciudad de Cali. Revista Ingeniería y Competitividad , 12, 127-138. [ Links ]
Silva, S., Heller, L., Valadares, J., & Cairncross, S. (2009). O cuidado domiciliar com a água de consumo humano e suas implicações na saúde: percepções de moradores em Vitória (ES), Brazil. Engenharia sanitária e ambiental , 14, 521-532. [ Links ]
Tuhovcak, L., Rucka, J., Alegre, H., & Almeida, M. (2009). Hazard Identi.cation and Risk Analysis of Water Supply Systems. En, Strategic Asset Management of Water Supply and Wastewater Infrastructures (pp. 287-298) London: IWA Publishing. [ Links ]
Vieira, J., & Morais, C. (2005). Planos de segurança da água para consumo humano em sistemas públicos de abastecimiento . Braga, Portugal: Universidade do Minho. [ Links ]
WHO (World Health Organization), IWWA (International Water Association). (2010). Water safety plans: Managing Drinking-water Quality for Public Health. World water day . Recovered 2013/12/15 http://www.unwater.org/wwd10/downloads/who_iwa/wsp_advocacy_16_3_10_wwd_2010.pdf [ Links ]
WHO (World Health Organization). (2004). Guidelines for drinking water quality (3 ed., vol. 1). Geneva, Suiza: WHO. [ Links ]
WHO (World Health Organization). (2011a). Guidelines for Drinking-water Quality (4 ed). Genève: WHO. Recovered 2013/12/15 http://whqlibdoc.who.int/publications/2011/9789241548151_eng.pdf [ Links ]
WHO (World Health Organization). (2011b). Water safety plans: why are they important and how can their implementation be supported by regulations. RegNet information products: Kit with issue sheets . Recovered 2013/12/15 http://www.who.int/water_sanitation_health/dwq/sheet5.pdf [ Links ]

Revista Ingeniería y Competitividad por Universidad del Valle se encuentra bajo una licencia Creative Commons Reconocimiento - Debe reconocer adecuadamente la autoría, proporcionar un enlace a la licencia e indicar si se han realizado cambios. Puede hacerlo de cualquier manera razonable, pero no de una manera que sugiera que tiene el apoyo del licenciador o lo recibe por el uso que hace.
