


Services on Demand
Journal
Article
 English (pdf)
 Article in xml format
 Article references
 Send this article by e-mail
Indicators
-
 Cited by SciELO
 -
 Access statistics
Related links
-
 Cited by Google
 -
 Similars in
SciELO
Similars in
SciELO -
 Similars in Google
Share

 Permalink
Ingeniería y competitividad
Print version ISSN 0123-3033
Ing. compet. vol.17 no.1 Cali Jan./June 2015
Vehicle Classification Based on a Bag of Visual Words and Range Images Usage
Clasificación de Vehículos Basada en Bolsa de Palabras Visuales y Usando Imágenes de Rango
Andrés F. Gómez*
E-mail: bladimir.bacca@correounivalle.edu.co
Pablo J. Hernández*
E-mail: andres.gomez.moreno@correounivalle.edu.co
Bladimir Bacca-Cortes*
E-mail: pablo.hernandez@correounivalle.edu.co
* School of Electrical & Electronics Engineering, PSI Research Group, Universidad del Valle, Cali, Colombia
Eje temático: ELECTRICAL AND ELECTRONICS ENGINEERING/INGENIERÍA ELÉCTRICA Y ELECTRÓNICA
Recibido: octubre 01 de 2014
Aceptado: febrero 20 de 2015
Abstract
3D feature descriptors extracted from point clouds are becoming a promising information source for many applications. These include object/shape recognition, building information and civil structures modeling, autonomous navigation systems, etc. Considering these trends, this paper presents a classification system for vehicles based on the bag of visual words framework. The former extracts feature descriptors from range images being captured from a SICK LMS200 sensor. Our approach uses also visual information to estimate the vehicle velocity using a Kalman filter. The velocity estimation is used to properly register laser scans and build the scene point cloud. In this work, a dataset was set up by including the vehicle point cloud, related visual information, vehicle velocity estimation as well as captured label classes. Using this dataset, various 3D descriptors were tested and for the classification process a bag of visual words was employed while KD-trees were used to speed up the process. As a result, our approach can classify up to nine different classes of vehicles. In this work, the classifier performance was measured using Precision-Recall curves.
Keywords: Bag of Visual Words, 3D descriptors, Range images.
Resumen
Los descriptores de características en 3D extraídos de nubes de puntos se han convertido en una fuente de información promisoria para muchas aplicaciones. Estas aplicaciones incluyen reconocimiento de objetos o formas, modelamiento de edificaciones, modelamiento de estructuras civiles, sistemas de navegación autónoma, etc. Considerando estas tendencias, este artículo presenta un sistema de clasificación de vehículos, basado en bolsa de palabras, el cual extrae descriptores de características de imágenes de rango capturadas usando un láser SICK LMS200. Nuestro enfoque usa información visual para estimar la velocidad de los vehículos usando un filtro de Kalman, esta estimación de la velocidad es usada para registrar los datos del láser y construir la nube de puntos de la escena. En este trabajo, un dataset fue capturado a partir de la nube de puntos del vehículo, su información visual, la estimación de la velocidad del vehículo y una etiqueta de la clase de vehículo. Usando este dataset, varios descriptores de 3D fueron probados y árboles KD fueron empleados para acelerar el proceso de clasificación, este último realizado con la Bolsa de Palabras. En consecuencia, nuestro enfoque puede clasificar hasta nueve diferentes clases de vehículos; el desempeño del clasificador fue medido usando curvas tipo Precision –Recall.
Palabras clave: Bolsa de Palabras, Descriptores 3D, Imágenes de rango.
1. Introduction
Today it is very important to know the number and type of vehicles on roadways. This information is used to record vehicular traffic data, which is a fundamental for Intelligent Transport Systems applications. Automatic vehicle classification systems (AVC) techniques have been widely considered to identify vehicles as they pass on highways without using any type of electronic pins or chips installed on the vehicle. AVC systems are used in many applications such as automatic tolls, bridge/tunnel clearance verification and road surveillance (Buch, Velastin & Orwell, 2011).
Nowadays in Colombia, road tolls make their fee collection in two traditional ways; manually or by implementing the stop-and-go schema. These approaches have three main inconveniences to be known. First, there is no control over the rate paid by the vehicle at the tall station. Second, there is a rise in pollution contamination due to traffic jams at the toll plaza produced by high traffic flow. Following, there is the decrease of road lifespan at toll-free roads since motorists drive them ignoring the allowed weigh regulations these road have (INVIAS, 2013).
Many methods has been proposed for vehicle classification considering visual (Buch, Velastin & Orwell, 2011). However, to fully accomplish this task many challenges still remain such as: change in illumination, image scale, image quality, size and color. Most of these problems can be solved using range images (Bielicki & Sitnik 2013). In this work, we suggest and AVC system which uses range information captured by a LMS200 laser sensor. The system employs 3D feature descriptors as well as geometrical information to feed our classifier engine. Moreover, in this work, the classifier engine is based on the Bag of Visual Words framework (Sivic & Zisserman 2003). Then, our approach is able to classify vehicles into categories including bikes, buses, trucks, jeeps, vans, hatchbacks, pick-ups, sedans, and sport utility vehicles (SUV). Hence, there are some assumption that are not taken into consideration such as occlusion; constant vehicle orientation throughout a scene; ground plane removal (performed in advance), and adverse weather conditions.
The rest of this paper is organized in four different sections as follows. Related Works are described in Section 1.1.; Section 1.2 shows the system configuration. Section 2 shows a description of our approach. Section 3 explains the laser range finder calibration procedure, the captured dataset, and the classifier's performance measurements. Lastly, Section 4 presents our conclusions.
1.1 Related works
Over the last decade, intelligent transport systems have been developing a wide diversity of AVC methods. These methods can be classified depending on the sensor used and if the method is invasive or non-invasive (Buch, Velastin & Orwell, 2011). Regarding sensors, AVC can be classify as laser sensors (Guarnieri Pirotti, Pontin & Vettore, 2006), magnetic sensors (Buch, Velastin & Orwell, 2011) or vision sensors (Ng & Tay 2012). Nowadays, magnetic sensors are clearly considered an invasive method which is not often used in present time. Although, vision sensors are very common because of their non-invasive feature and also their provision of rich appearance information; they are sensitive to illumination changes; moreover, their field of view (FOV) is limited providing only 2D data. On the other hand, laser sensors have become simpler and more compact, they just render 3D information and usually their FOV is wide. However, laser sensors do not provide texture information.
In this work, we used a laser sensor to implement our AVC system. For this reason, we are focusing on the problem of AVC using range information. To illustrate, Table 1 summarizes the state of the art in 3D descriptors used for object recognition. It also shows many representative object recognition systems classified regarding principles such as global 3D descriptors, key-point uniform sampling, and automatic key-point selection. Additionally, for each reference, it is detailed the descriptor type, method used, descriptor size, rotational invariance, and if the descriptor provides 6DOF data. Table 1.
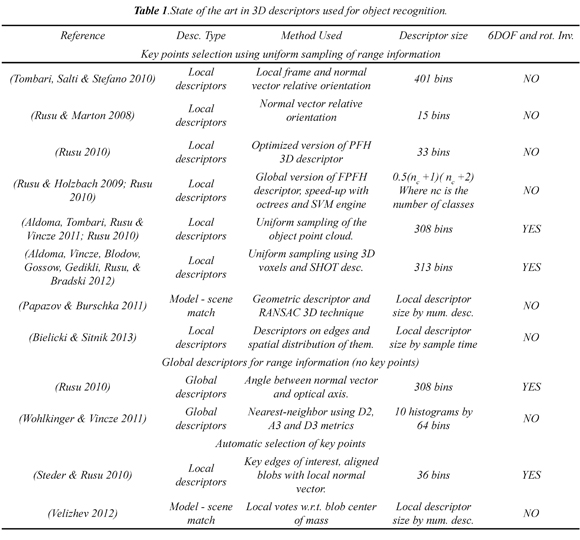
Uniform sampling allows the selection of key points in range images. The main goal of methods using this approach is to reduce the amount of information and make it easier to process. The uniform sampling process takes place considering the sensor resolution and point cloud density. In this category there are relevant works such as (Tombari, Salti & Stefano, 2010) who suggested the SHOT descriptor (Signature of Histograms of Orientations) (Rusu, Marton, Blodow & Beetz, 2008) and with the PFH descriptor (Point Feature Histograms) as well as the FPFH descriptor (Fast Point Feature Histograms) (Rusu, Blodow & Beetz, 2009). From the introduced different methods only two use the SHOT, PFH, and FPFH descriptors. First, SHOT descriptor considers the local geometric information of a normal vector with respect to a 3D neighborhood centered in the selected key point. Second, both PFH and FPFH descriptors consider multi-dimensional histograms of geometrical relationships between the key point normal vector and the normal surface vectors in a 3D neighborhood.
Another approach in object recognition is the usage of global descriptors which do not select key points. Global descriptors have important features as their compactness and ability to represent full objects which also make them easy to compare. However, it is assumed that the object is completely segmented and no occlusion is present. The latter is an important real world condition where local descriptors overcome global descriptors. In Table 1 there are a couple of works present in (Rusu 2010) with the VFH descriptor (Viewpoint Feature Histogram) and (Wohlkinger & Vincze 2011) with the ESF descriptor (Ensemble of Shape Functions). The VFH descriptor is based on the FPFH one, but applied at the global level and considering the vector's viewpoint. The VFH descriptor holds the statistical orientation between the vector's viewpoint and the normal local vectors of the entire range image. On the other hand, the ESF descriptor considers the key properties of the point cloud. To do so, three different statistics must be performed in the point cloud using the distance histogram between two random points. These are a distance histogram between two random points; an orientation histogram between two lines defined by three random points, and an area histogram between three random points.
The third and more robust approach is the automatic selection of key points. In this category, (Steder & Rusu 2010) introduced the NARF descriptor (Normal Aligned Radial Feature). This descriptor automatically detects three different types of edges in the range image; afterwards, key points are detected on these edges and their normal vectors are taken into account. Lastly, each key point is superimposed a star pattern with N cells, and then each cell scores how much the surface changes.
Continuing, AVC systems could be partitioned into two general categories, top-down and bottom-top strategies (Buch, Velastin & Orwell, 2011). Top-down strategy, extracts features from the whole object which means global descriptors and shape-based methods are widely used. Moreover, bottom-top strategy' main goal is to detect parts (features) of the object to be classified and later on to arrange the objects by using group of features. Up to now, the most relevant 3D descriptors used for object recognition were shown in Table 1. Once a global feature or set of local features are detected, classifiers map the object's information with an extracted feature vector to a known class. Nowadays, there are different ways to perform this mapping. For instance, there are the nearest neighbor classifier, machine learning methods, probabilistic frameworks, and alphabet based methods (Buch, Velastin & Orwell, 2011). From the former, Nearest Neighbor Classifier is the simplest mapping method because it uses a defined distance (this can be Euclidean, Manhattan or Mahalanobis) to measure the object similarity. Nearest neighbor approaches are used when descriptors are robust enough to differentiate between classes. If this condition cannot be satisfied data association error might occur. In the case of Machine Learning approaches there are the supervised or unsupervised kind, depending on the way the classifier performs the learning process. These classifiers are known by its black-box model and normally large amount of ground truth information which is required to provide evaluation with statistical confidence. Probabilistic classifiers estimate the posterior probability based on observed data and prior knowledge. Nevertheless, modeling density functions probability of unknown data is hard. For this reason, Bayesian frameworks as well as Markov Chain Monte Carlo approaches are implemented. Finally, alphabet based methods, like the Bag of Visual Words or Features (Sivic & Zisserman 2003), are introduced to reduce the number of training samples since these methods combine similar feature vectors instead of using every single feature vector.
To sum up, nearest neighbor classifiers often make strong assumptions on descriptor robustness and discriminability while machine learning approaches need high and diverse number of training samples. Consequently, this work employs an alphabet based method, like the bag of visual words of features, to be able to implement the AVC system. With this method it is possible to increase the speed of the final classifier and reduce the amount of training and storage data, as shown in ( Buch, Velastin & Orwell, 2011).
1.2 System configuration
Figure 1a shows the data acquisition block diagram, here the laser SICK LMS200 is connected to a laptop using a RS485/USB interface. For the terms of this project, visual data is also acquired using a Canon VC-C50i analog camera which is connected to a laptop using a RCA/USB converter. In order to test our approach, a dataset was captured on at Universidad del Valle vehicle access entrance at Calle 16. The distribution sensor at this place is shown in Figure 1b.
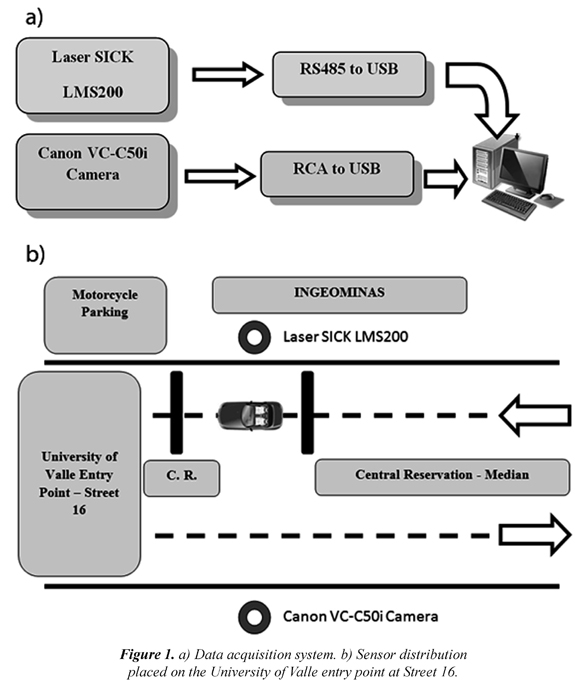
The sensor arrangement was set by placing the laser SICK LMS200 vertically in such a way that vehicles were scanned transversely. The LMS200 was placed at 2.75m high in order to get a frontal view of vehicles. The VC-C50i camera was installed at the opposite car lane to obtain a wide field view. As for the VC-C50i, it was positioned at 2.82m high. Concerning the LMS200 basic specifications this has a range of 0º to 180º and an angular resolution of 0.25º, 0.5º or 1º while its range precision is ± 15mm. As for the video camera, it used the following settings, NTSC analog images, video output BNC, 3.5mm to 91mm focus and an aperture from f/1.6 to f/4.0. The camera's video output was acquired by an EasyCap converter getting images of 720 x 450 pixels.
2. Vehicle classification system based on a bag of visual words
This section presents a vehicle classification system based on a bag of visual words when using range images. To do so, the process has been summarized in four steps to be known: vehicle velocity estimation, 3D-point cloud construction, finding the most relevant features, and classification. These four steps are illustrated in the coming sections.
2.1 Vehicle velocity estimation using Kalman filters
The captured dataset (see Section 3.2) to test this system included range scans and video data. The video data was used to estimate the vehicle's velocity, and then register the laser scans properly. To perform this task, three problems must be solved in advance such as selecting the region of interest (ROI), making the vehicle segmentation, and tracking the vehicles.
Considering the sensor distribution in Figure 1a, the original image was cropped in a blob of 640 x 320 pixels where the vehicles of interests appeared. Furthermore, vehicle segmentation was performed using a background subtraction method suggested by (KaewTraKulPong & Bowden 2002). According to this method, each background pixel is modeled as a mixture of Gaussians and each weigh of such a mixture represents the time proportions that image colors stay in the scene. From an original image, the background model was subtracted and updated along with its binary template (former seen in Figure 2a- center). Once the interval between frames and KLT features were extracted and tracked from the blob over vehicle as in (Tomasi & Kanade 1991), the vehicle's velocity time could be estimated as depicted in Figure 2a (right). However, when observing Figure 2b the vehicle's measured velocity (continuous line) was very noisy. Consequently, a Kalman filter was implemented as based observer considering a linear and uniform movement with constant velocity (Reid & Term 2001). To do so, the state space model is detailed in Ec. (1).
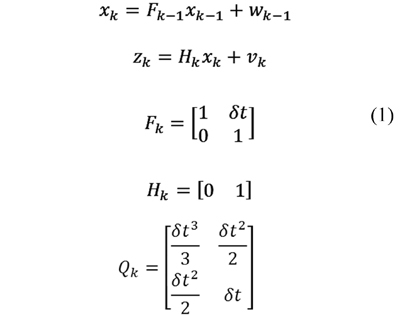
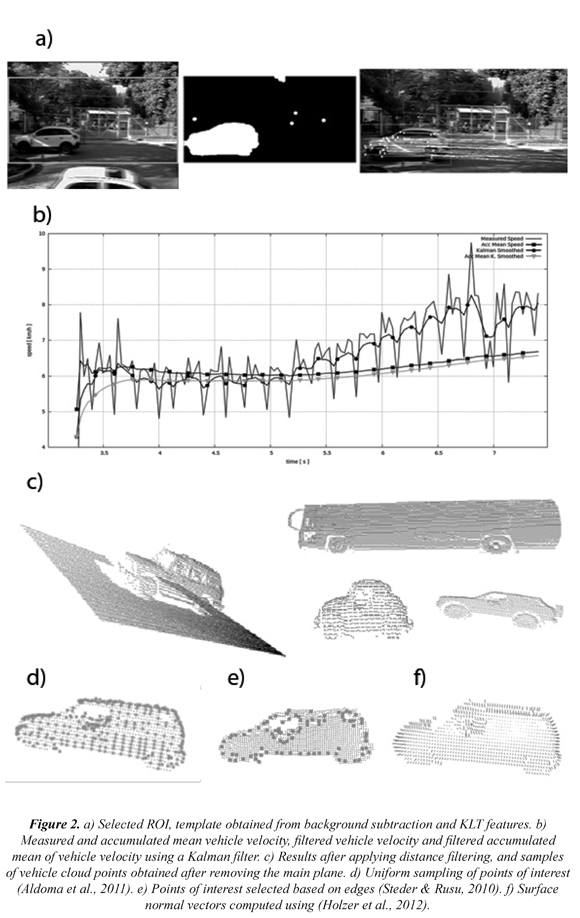
where xk=[posk ∂posk/∂t] is the state vector composed by the KLT feature position and its velocity; wk and vk are uncorrelated Gaussian noise with zero mean and covariance Qk and Rk respectively. As for Fk and Hk these are the state transition and measurement matrices while δt corresponds to time. Applying a Kalman filter to the measured vehicle's velocity, a smooth and improved velocities profile can be obtained as observed in Figure 2b (round marker). Nevertheless, registering the laser scans using this filtered velocity profile did not get proper results. For this reason, in this work the vehicle velocity accumulated mean was considered (see Figure 2b, triangle marker).
2.2 Building the cloud points
Once the vehicle velocity profile was computed, laser scans were registered and a scene point cloud was obtained. However, this point cloud included other useless information such as maximum range values, trees, the main plane, and other small vehicles. In order to filter out these data two pre-processing steps were carried out. To start, a distance filter was applied to the scene point cloud, in this work a threshold of 7m was considered and any measured range bigger than was filtered out. The resulting point cloud can be observed in Figure 2c (left). Then, the feature extraction stage required a point cloud that contained only the object of interest. Thus, the main plane must be separated out by applying the method proposed by ( Rusu, Blodow & Beetz, 2009). Basically, this method uses a random sample consensus (RANSAC) of 3D points to detect the main plane. Results, shown in Figure 2c (right), present some samples of the segmented vehicle point clouds.
2.3 Feature extraction
As described in Section 1.1, feature extraction from 3D point clouds can be coarsely classified in two main categories which are local and global features. From the methods described in Table 1, this work implemented three local 3D features FPFH, SHOT, and NARF descriptors. The FPFH descriptor was selected because it encapsulates curvature information of the ROI which allows describing the change and shape of the object of interest. Concerning SHOT descriptor, it encases explicitly invariance to rigid transformations which is worth testing. Lastly NARF descriptor is capable of detecting automatically the point of interest based on edge analysis of point clouds. This characteristic is important when compared to FPFH and SHOT descriptors since they compute on sampled ROIs uniformly. In Figure 2d and 2e, it can be observed the interest point reduction, which means a diminution in computing time and errors due data association (Steder & Rusu 2010). Local descriptors were calculated using 3D voxels around interest points and the corresponding normal vectors. In this paper, then, normal vectors are computed using (Holzer, Rusu, Dixon, Gedikli, & Navab, 2012) as observed in Figure 2f.
Local descriptors have the main advantage of performing well in presence of occlusions or changes in the surface reflectivity properties. Nonetheless, they need clustering methods to compare feature sets. Hence, this work also implemented global 3D features such as VFH and ESF descriptors. The VFH was selected because it is based on the FPFH descriptor which considers the curvature shape analysis at global level. The ESF descriptor was chosen due to its distinct feature of building the descriptor by using distance angles and areas histograms of the object of interest rather than surface normal vectors.
2.4 Bag of visual words classifier
During the development of this project, a classifier based on a bag of visual words was used in order to sort nine different types of vehicles. By employing this method, an input range image was outlined with a given feature dictionary, as a set of unordered features (words) while the classifier was based on the features frequencies in a range image (Sivic & Zisserman 2003). It is important to recall that the features used for the purpose of this work are the local descriptors mentioned in Section 2.3. Then, the classifier did not use these features directly because they were sensitive to noise and had high dimensionality. For this reason, the attributes were categorized using a vector-quantization technique such as K-means and then the output clusters of this discretization became the word dictionary. As the number of words in the dictionary incremented, the less efficient the frequency extraction was. To improve the storage-retrieval efficiency, the words in the dictionary are stored in a KD-tree (Bentley 1975).
Categorizing an input range image entails extracting features. Finding their frequencies in the words dictionary meant comparing them by using L2 distance and K-nearest neighbors and afterwards, performing a likelihood evaluation considering the inverted index associated with the words dictionary (Angeli, Filliat, Doncieux & Meyer, 2008).
During the computation of the likelihood associated to the feature space, the main goal was to avoid performing image-to-image comparisons. The inverted index listed the range images from which each word had been seen previously (Angeli, Filliat, Doncieux & Meyer, 2008). This list was used to update a score for each vehicle class using a voting schema. The statistics were computed using the term frequency-inverted document frequency (tf-idf) weighting (Sivic & Zisserman 2003) as depicted in Ec. (2).

where, nid is the number of feature occurrences in d the range image; i, nd is the number of features in the range image I; N is the total number of features in the data base and Nd is the number of range images which containing feature d. From Ec. 2, it can be observed ti is the product of the feature frequency in a range image, by the inverse frequency of the range images containing this feature.
To sum up, for the terms of this project the pipeline of the suggested classifier works by capturing an image range follow by the computation of local and global descriptors. These descriptors include the FPFH, SHOT, NARF, VFH and ESF ones, which allows comparing the classification results using different kind of descriptors. Afterwards, each feature in the range image is weighted using the tf-idf coefficient for each class vehicle hypothesis. Furthermore, it results in a likelihood histogram which scores the most likely class of vehicle hypothesis. Finally, the classifier output is defined as the most likely hypothesis using the tf-idf coefficient histogram. It is worth noting that the words dictionary of this project was built before the classification phase using the Caltech Large Scale Image Search Toolbox (Aly, Munich & Perona, 2011).
3. Results and discussion
In order to perform the tests and results for this work, a dataset (Section 3.2) was captured using the sensor configuration depicted in Figure 1b. The LRF implemented in this work was previously calibrated as described in Section 3.1. Lastly, the performance of the AVC system depicted in this work was measured in terms of precision-recall curves (Section 3.3). These precision-recall curves include classification results obtained using clustered local descriptors accordingly with the bag of words approach; as well as global descriptors compared directly with those stored in the database which employ L2 norm and K-nearest neighbors.
3.1 Laser range finder calibration
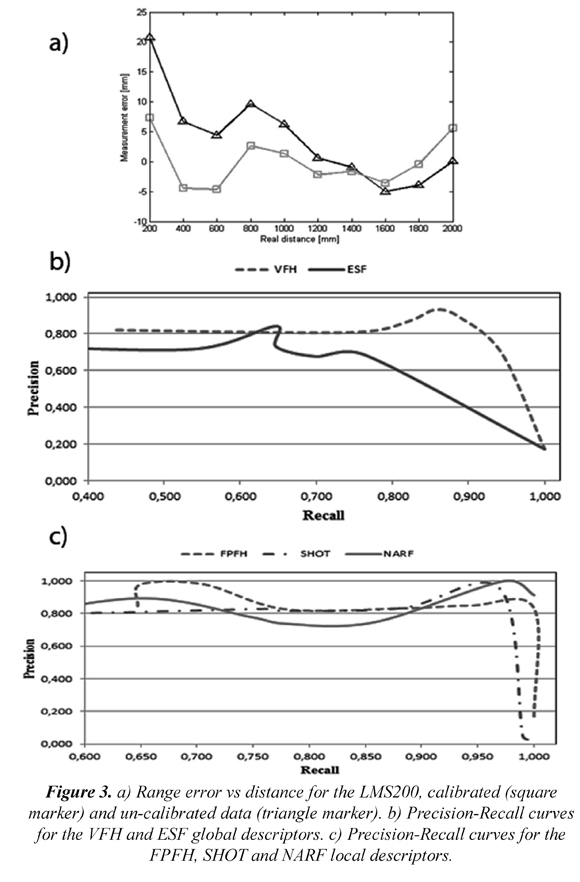
A good characterization of these sensors is shown in (Borenstein 2002). The author explores characteristics such as laser alignment, drift effect, and laser range model. In this work, suggestions about the material properties as describe in (Borenstein 2002) were collected in order to decrease the error range. After running ten different tests, each one at different distance from the LRF, it was found the following laser range model: d=0.98453L+15.233, where L is the range given by the LRF, and d is the estimated range. Figure 3a shows the range error d - d, or the difference between the estimated and real distance, vs. the real distance.
3.2 Dataset
To evaluate this work a dataset was captured including visual and range images. The sensor setup, depicted in Figure 2b, and the dataset acquisition assumptions included the captured dataset in real world situations comprising different illumination conditions; moreover, scenes displaying pedestrian presence and also more than one vehicle views were inserted. The dataset did not include bad weather conditions due possible damage to the sensors involved. Data acquisitions with occlusions in range images and vehicles in motion at high velocities were discarded. Once the range and visual images were captured, a manual procedure started in order to classify the vehicles between nine different categories. This was done in order to obtain the ground truth and evaluate the classifier performance. Also, the vehicle's velocity estimation was computed offline and stored as part of the dataset. The number of vehicles at each class varies in order to build the word dictionary; a proportion of 50/50 % was kept for training and testing respectively.
3.3 Classification results
The AVC proposed in this work is able to categorize nine different types of vehicles. Among them there are motorbikes or bicycles, buses, trucks, jeeps, vans, hatchback or station wagons, pickups, sedan and SUVs. Concerning the suggested classifier, it performs a multi-class categorizing task, where the range image input is classified into one and only one of C non-overlapping classes. Then, to evaluate the classifier performance, precision-recall curves were built from confusion matrices (Sokolova & Lapalme 2009). In those, precision is defined as the number of correct matches divided by the total number of matches. Recall instead is the number of correct matches divided by the total number of expected matches, as presented in Ec. (3).
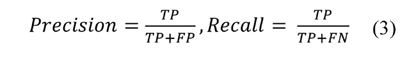
Here, TP are true positives, FP false positives and FN false negatives. Expected correct matches are obtained from the dataset ground truth since this dataset was already labeled as stated in Section 3.2. Figure 3.
In multi-class classification tasks a desired outcome corresponds to a high recall rate of at least 80% precision (Bishop 2006) (Sokolova & Lapalme 2009). Figure 3b and 3c show the precision-recall for global and local descriptors. Global ones were also stored in a KD-tree and retrieved considering a K-nearest neighbor approach, but without generating a word dictionary. Figure 3b presents the precision-recall curves for the VFH and ESF global descriptors. In this Figure VFH performs better compared with ESF, VFH achieves ≅ 93% recall at 80% precision; however, the precision-recall curve of ESF descriptor hardly achieves a precision of 80%. VFH outperforms ESF since it includes surface normal vectors and object curvature information. The ESF descriptor works with distances, areas, and angles which implicitly assumes non-textured surfaces. This condition is hardly found in outdoors scenes as those captured in the dataset and outlined in Section 3.2.
Figure 3c illustrates the precision-recall curves for the FPFH, SHOT, and NARF local descriptors and in here they are processed by the multi-class classification system. This classifier is based on the bag of visual words approach. It is important to say that the more descriptiveness is coded in descriptors, the more discriminative the classifier is. Observing Figure 3c, the classifier results using FPFH and SHOT descriptors outperform the NARF descriptor. The FPFH descriptor achieves ≅ 98% of recall at ≅ 83% precision while SHOT descriptor achieves ≅ 97% of recall at ≅ 90% precision. Figure 3c shows that these descriptors do not present precision values less than 80% in the performed tests. Despite the fact that the NARF descriptor tends to be at the top, it achieves precision values less than 80% at ≅72% of recall. The success of FPFH and SHOT descriptors is due to the inclusion of several factors as normal vector data; grouping geometric information of point of interest clusters; invariance in presence of 3D changing point density, and considering abrupt changes in the object geometry into the descriptor coding. On the other hand, the most detailed and complex descriptor is the NARF one since it auto-detects the point of interest, the edges in the 3D point cloud, and computes the descriptor value on these edges. Nevertheless, the 3D geometric information about the vehicle edges is very similar. It could be the main reason why in this case the NARF descriptor is not discriminative.
In this work, the average rate classification performances for the FPFH, SHOT and NARF descriptors were 84.52%, 81.5% and 79.18% respectively. (Urazghildiiev, Ragnarsson, Ridderstrom, Rydberg, Ojefors, Wallin, Enochsson, Ericson, & Lofqvist, 2007) proposes an AVC system capable of classifying 6 different vehicle types using geometrical features and probabilistic classifier engine; the authors report an average classification rate of 83.6%. (Stroffek, Kuriscak & Marsalek, 2010) is another case of AVC system implemented using geometrical features and a neural network as classifier engine; here, the authors report a classification rate of 94.31%, however they do not mention how many types of vehicles this system can classify. (Sandhawalia, Rodriguez-Serrano, Poirier & Csurka, 2013) proposes a comparison between three different features but using a linear classifier engine; this work reports the following classification rates for each type of feature: Raw Profiles Features 79.93%, Fisher Laser Signatures 70.52%, and Fisher Image Signatures 83.04%. (Chidlovskii, Csurka & Rodriguez-Serrano, 2014) reports an AVC using Support Virtual Machine classifier using three type of features namely Raw Profile Features, Fisher Image Signatures and Dynamic Time Window; the classification average rates are 74.5%, 80.36% and 85.33 respectively. It is worth noting that our proposal has results comparable with current state of the art methods.
4. Conclusions
In this work, an AVC system was presented using 3D point clouds and based on a bag of visual words classifier. The AVC system was tested using different types of 3D global and local descriptors such as VFH, ESF, FPFH, SHOT, and NARF. By selecting different kind of descriptors, the performance of comparative tests was allowed and therefore registered in precision-recall curves. The precision-recall curves depicted in Figure 3b and 3c showed the favorable performance of the bag of visual words classifier considering range images captured in outdoors and non-controlled environments. In this work, the average rate classification performances for the FPFH, SHOT and NARF descriptors were 84.52%, 81.5% and 79.18% respectively, which are comparable with current state of the art methods. Other AVC systems focus on increasing feature descriptiveness or having powerful classifiers, which is the case of (Urazghildiiev, Ragnarsson, Ridderstrom, Rydberg, Ojefors, Wallin, Enochsson, Ericson, & Lofqvist, 2007), (Sandhawalia, Rodriguez-Serrano, Poirier & Csurka, 2013) and (Chidlovskii, Csurka & Rodriguez-Serrano, 2014). This work was conceived enhancing both using high descriptive point cloud features and high generalization capability on classifier.
The AVC proposed in this work was implemented using different types of 3D features, which enable us to compare the 3D features performance. Then, an important finding is that geometric properties such as normal surface vectors, the object's local curvature, and the method of computing interest points should be taken into consideration when comparing the precision-recall curves and the internal descriptor. Otherwise, descriptors as ESF will not perform accurately since they will lack of these specific data. Observing the precision-recall curves in Figure 3, the variability along the recall axis is a consequence of the diverse behavior in our AVC system when working with multi-class classification problems.
Finally, this work uses an off-line bag of word classifier, and then it is important proposing an on-line bag of words classifier. Our proposal was not evaluated in presence of occlusions and adverse weather conditions, especially rain. Then, these topics are interesting research challenges for future implementations.
5. References
Aldoma, A., Tombari, F., Rusu, R.B., & Vincze, M. (2011). CAD-model recognition and 6DOF pose estimation using 3D cues. In, International Conference on Computer Vision Workshops (ICCV Workshops) (pp. 585-592). Barcelona, España. [ Links ]
Aldoma, A., Vincze, M., Blodow, N., Gossow, D., Gedikli, S., Rusu, R.B., & Bradski, G. (2012). OUR-CVFH-Oriented, Unique and Repeatable Clustered Viewpoint Feature Histogram for Object Recognition and 6DOF Pose Estimation. In, Lecture Notes in Computer Science (pp. 113-122). Heidelberg, Germany: IEEE. [ Links ]
Aly, M., Munich, M., & Perona, P. (2011). Indexing in large scale image collections: Scaling properties and benchmark. In, Applications of Computer Vision (WACV), IEEE Workshop on (pp. 418-425). Kona, USA: IEEE. [ Links ]
Angeli, A., Filliat, D., Doncieux, S., & Meyer, J.-a. (2008). Fast and Incremental Method for Loop-Closure Detection Using Bags of Visual Words. IEEE Transactions on Robotics, 24 (5), 1027-1037. [ Links ]
Bentley, J.L. (1975). Multidimensional binary search trees used for associative searching. Communications of the ACM, 18 (9), 509-517. [ Links ]
Bielicki, J., & Sitnik, R. (2013). A method of 3D object recognition and localization in a cloud of points. EURASIP Journal on Advances in Signal Processing, 29 (1). [ Links ]
Bishop, C. (2006). Pattern Recognition and Machine Learning. New York, USA: Springer-Verlag. [ Links ]
Borenstein, J. (2002). Characterization of a 2D laser scanner for mobile robot obstacle negotiation. In, Proceedings 2002 IEEE International Conference on Robotics and Automation (Cat. No.02CH37292) (pp. 2512-2518). Wahington D.C., USA. [ Links ]
Buch, N., Velastin, S. a., & Orwell, J. (2011). A Review of Computer Vision Techniques for the Analysis of Urban Traffic. IEEE Transactions on Intelligent Transportation Systems, 12 (3), 920-939. [ Links ]
Chidlovskii, B., Csurka, G., & Rodriguez-Serrano, J. (2014). Vehicle type classification from laser scans with global alignment kernels. In, 17th International IEEE Conference on Intelligent Transportation Systems (ITSC) (pp. 2840-2845). Quingdao, China. [ Links ]
Guarnieri, A., Pirotti, F., Pontin, M., & Vettore, A. (2006). 3D Surveying for Structural Analysis Applications. In, 3rd IAG Symposium on Geodesy for Geotechnical and Structural Engineering/12th FIG Symposium on Deformation Measurement (pp. 1-6). Baden, Austria. [ Links ]
Holzer, S., Rusu, R.B., Dixon, M., Gedikli, S., & Navab, N. (2012). Adaptive neighborhood selection for real-time surface normal estimation from organized point cloud data using integral images. In, 2012 IEEE/RSJ International Conference on Intelligent Robots and Systems (pp. 2684-2689). Vilapuura, Portugal. [ Links ]
KaewTraKulPong, P., & Bowden, P. (2002). An Improved Adaptive Background Mixture Model for Real-time Tracking with Shadow Detection. In, R. Paolo, J. Graemea, P. Nikos, & R. Carlos (Ed.) Video-Based Surveillance Systems (pp. 135-144). New York, USA: Springer. [ Links ]
Ng, J.Y., & Tay, Y.H. (2012). Image-based Vehicle Classification System. Recovered 15/05/2015 http://arxiv.org [ Links ]
Papazov, C., & Burschka, D. (2011). An efficient RANSAC for 3D object recognition in noisy and occluded scenes. In, Computer Vision-ACCV 2010 (pp. 135-148). Queenstown, New Zealand. [ Links ]
Reid, I., & Term, H. (2001). Estimation II Discrete-time Kalman filter, Oxford, UK. 15/05/2015 http://www.robots.ox.ac.uk/ [ Links ]
Rusu, R.B. (2008). Learning informative point classes for the acquisition of object model maps. In, 2008 10th International Conference on Control, Automation, Robotics and Vision (pp. 643-650). Hanoi, Vietnam. [ Links ]
Rusu, R.B. (2010). Semantic 3D object maps for everyday manipulation in human living environments. KI-Künstliche Intelligenz, 24 (4), 345-348. [ Links ]
Rusu, R.B., Blodow, N. & Beetz, M. (2009). Fast Point Feature Histograms (FPFH) for 3D registration. In, Robotics and Automation, ICRA. IEEE International Conference on (pp. 3212-3217). Kobe, Japan. [ Links ]
Rusu, R.B., & Holzbach, A. (2009). Detecting and segmenting objects for mobile manipulation. In, Computer Vision Workshops (ICCV Workshops), IEEE 12th International Conference on (pp. 47-54). Kyoto, Japan. [ Links ]
Rusu, R.B., & Marton, Z.C. (2008). Persistent Point Feature Histograms for 3D Point Clouds. In, 10th International Conference on Intelligent Autonomous Systems (pp. 1-10). Baden, Austria. [ Links ]
Sandhawalia, H., Rodriguez-Serrano, J.A., Poirier, H., & Csurka, G. (2013). Vehicle type classification from laser scanner profiles: A benchmark of feature descriptors. In, 16th International IEEE Conference on Intelligent Transportation Systems (ITSC 2013) (pp. 517-522). Tha Hague, The Netherlands. [ Links ]
Sivic, J. & Zisserman, A. (2003). Video Google: A text retrieval approach to object matching in videos. Computer Vision, 2003. Proceedings. ..., (Iccv), 2 (1), 1470-1477. [ Links ]
Sokolova, M., & Lapalme, G. (2009). A Systematic Analysis of Performance Measures for Classification Tasks. Information Processing and Management, 45 (4), 427-437. [ Links ]
Steder, B., & Rusu, R.B. (2010). NARF.: 3D Range Image Features for Object Recognition. In, IEEE/RSJ Int. Conf. on Intelligent Robots and Systems (IROS) (pp. 1-6). Taipei, Taiwan, pp. 1-6. [ Links ]
Stroffek, J., Kuriscak, E., & Marsalek, P. (2010). Highway Toll Enforcement. IEEE Vehicular Technology Magazine, 5 (4), 56-65. [ Links ]
Tomasi, C., & Kanade, T. (1991). Detection and Tracking of Point Features. Recovered 15/05/2015 at http://www.csie.ntu.edu.tw/ [ Links ]
Tombari, F., Salti, S. & Stefano, L. D. (2010). Unique Signatures of Histograms for Local Surface Description. In, 11th European Conference on Computer Vision (ECCV) (pp. 347-360) Hersonissos, Greece. [ Links ]
Urazghildiiev, I., Ragnarsson, R., Ridderstrom, P., Rydberg, A., Ojefors, E., Wallin, K., Enochsson, P. et al. (2007). Vehicle Classification Based on the Radar Measurement of Height Profiles. IEEE Transactions on Intelligent Transportation Systems, 8 (2), 245-253. [ Links ]
Velizhev, A. (2012). Implicit shape models for object detection in 3D point clouds. ISPRS Annals of Photogrammetry, Remote Sensing and Spatial Information Sciences, 1 (3), 179-184. [ Links ] [ Links ]

Revista Ingeniería y Competitividad por Universidad del Valle se encuentra bajo una licencia Creative Commons Reconocimiento - Debe reconocer adecuadamente la autoría, proporcionar un enlace a la licencia e indicar si se han realizado cambios. Puede hacerlo de cualquier manera razonable, pero no de una manera que sugiera que tiene el apoyo del licenciador o lo recibe por el uso que hace.
