


 English (pdf)
 Article in xml format
 Article references
 Send this article by e-mail
 Cited by SciELO
  Cited by Google
  Similars in
SciELO
Similars in
SciELO  Similars in Google
 Permalink
1. Introduction
In recent years, discussions about implementing wireless metering as the fundamental unit for Smart Grids leads to the question of how to quantify any progress achieved with that application. Advanced technologies such as smart metering requires a substantial capital investment in order to replace the existing equipment, yet such investment brings new jobs, reduction in energy consumption, and waste decrease among other benefits. Therefore, an economic analysis is required to determine if a project of such magnitude brings benefits that justify any arisen cost induced by implementing Advanced Metering Infrastructure (AMI).
Many countries and regions have begun deploying new energy metering infrastructure, in most cases, the smart meters are implemented for all customers in the energy business. The problem has been rooted in the initial investment, which is the highest cost for bringing this advanced technology. On the other hand, the implementation of AMI has proven to be a mechanism for energy savings and cost reduction due to automation and remote management offered by the meter (Ahmad, 2011).
In the local context, Cali-Colombia, the main driver of Smart Grid is the efficient management of non-technical losses of energy, which would be the main factor for recovering such a large investment. In addition, smart metering would enable utilities to become more efficient and therefore, to drive a decrease in per capita consumption. Due to particular conditions of each country or region, various methodologies have emerged for helping with the estimation of the socioeconomic and environmental impact. The purpose of those methods is to determine with higher certainty, the needs for each project. The methodology adopted in this paper was proposed by the European Union and tailored to local conditions, in order to estimate costs and benefits of implementing smart metering in Cali city. This research identified social and economic benefits for the case where the local utility, would implement AMI for all of their customers, which would be the most extreme case of a possible implementation. Actually, the “Unidad de Planeación Minero Energética -UPME”, the Inter-American Development Bank -IDB, utilities and research groups around the country, are developing the Colombian Smart Grid Roadmap. It seeks to measure the socio-economic and environmental impact of the integration of different Smart Grid pilot projects, with reference to the European methodology.
It should be noted that in future work, a further study would be the implementation of AMI by sections in order to identify places where potential benefits are better utilized. Section 2 and 3 of this paper show the methodology adjusted and implemented, where the project´s characteristics, the estimation of potential benefits, and a comparison between costs and potential benefits are described. Finally, conclusions from this work are presented.
2. Methodology application
The methodology used in this study was taken from (Giordano et al., 2012). This methodology provides a clear step-by-step guidance for Cost-Benefits Analysis of a Smart Grid project. Then each stage of the proposed methodology was applied to a local smart-metering project in Cali city.
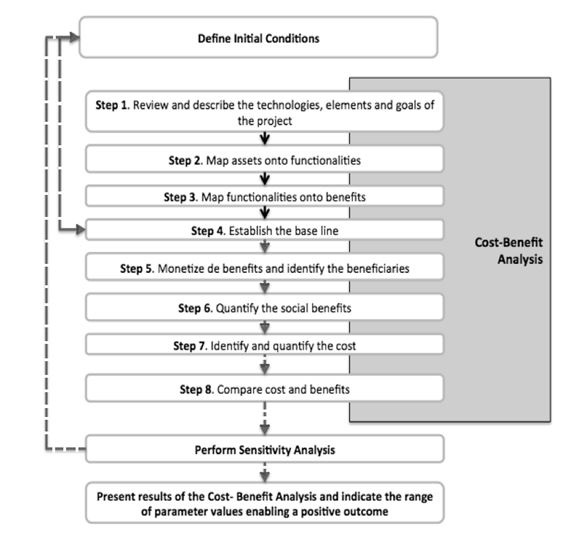
Figure 1 shows the methodology used in the study in order to obtain the socioeconomic and environmental impact of smart meter integration into an electricity network in Cali city. The analysis was divided into the following three stages: Project descriptions, estimate of the potential benefits, and costs-benefits analysis.
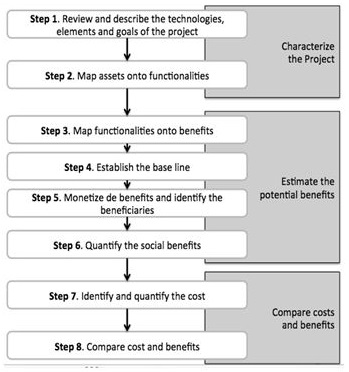
Figure 1 Cost-benefits Methodology for implementing Advanced Metering Infrastructure. Diagram taken from Giordano et al. (2012) and modified.
2.1 Step 1: Project characteristics
This project involves the installation and subsequent operation of 529,292 smart meters for a local utility residential customers. The equipment would be required to work under TWACS AMI communication infrastructure (Mak & Reed, 1982; Mak & Moore, 1984), which is based on two-way Automatic Communication System. Such a system uses electrical distribution lines to send data from the meters to equipment located at the substation, where then, other communication systems are used for the flow of information to the control centers. The AMI TWACS infrastructure is composed by three levels, shown in Figure 2.
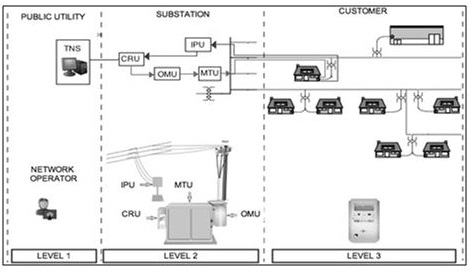
Level 1: Central Control Equipment
TNS: TWACS Net Server
Level 2: Substation Communications Equipment
CRU: Control and Receiving Unit; IPU: Inbound Pickup Unit; OMU: Outbound Modulation Unit; MTU: Modulation Transformer Unit
Level 3: Remote Communications Equipment
In this case, a 6-year for roll out of all meters is assumed, based on the implementation plans of many countries at the European Union, in which the average deployment is in this range (Eurelectric, 2013).
2.2 Step 2 and 3: Map functionalities onto benefits
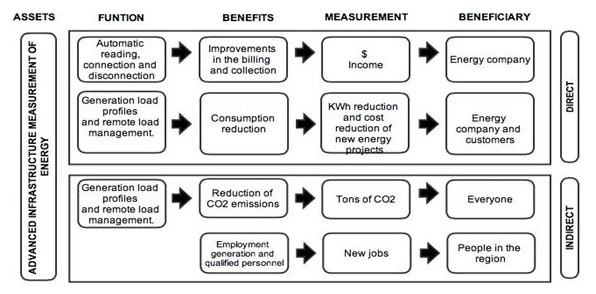
In this study, the process of transforming functionalities into benefits starts with general aspects that are involved in smart metering and have socioeconomic and environmental impact that are described in the next list: Energy price; Load management; Management demand curve; Energy losses; Annual employment; Reduction of CO2 emissions.
Figure 3 shows the map of functionalities onto benefits developed in this work. Each benefit points out to an indicator that quantifies success and the beneficiaries.
2.3 Step 4: Establishing the baseline
The objective of establishing the Project baseline is to compare de new scenarios with the current scenario, and find the difference between the generated costs and benefits. In this work, three scenarios were included, where the baseline scenario is the traditional measurement system based on electromechanical meters. The following describes each of them:
Scenario A: Current status (energy consumption measured with electromechanical meters).
Scenario B: Implementation of smart meters: Reading, remote load connection and disconnection, detection of unauthorized tampering.
2.4 Step 5: Monetize benefits
The benefits presented in Figure 3 were monetized by a numerical simulation tool, which was performed by Smart Region (SR, 2013) and adjusted to the local context. The tool calculates new scenarios of energy measurement considering a hybrid communication infrastructure composed by meter and data concentrator via PLC/GSM, and communication from data concentrator to utility via GSM. The tool was modified to consider AMI TWACS system infrastructure as the system adopted by local utility.
Table 1 and 2 shows the most relevant parameters, equations and assumptions used to monetize benefits and quantify the costs of implementing the new energy measurement technology in the Cali city. Regarding the annual costs and benefits estimation, an increase in both the number of customers and inflation rate were considered.
Table 1 Input parameters.
| Cost of smart meter | 250 U.S. dollars * |
| Cost of electromechanical meter | 20 U.S. dollars |
| Annual increase in number of electricity customers | 3%(SUI- Sistema Único de Información, 2013) |
| Daily cost to employ a manual meter reader | 27 U.S. dollars /day |
| Average percentage electricity loss due to fraud -local utility | 12% * |
| Average reduction in the level of electricity fraud due to the use of smart metering | 7% * |
| Average reduction of electricity consumption in Scenario B | 2% |
| Discount rate | 13.9 % (Álvarez, 2012) |
| Energy fee per kWh | 0.1557 U.S. dollars /kWh |
| Average monthly consumption of customers | 265 kWh (SUI- Sistema Único de Información, 2013) |
*Information provided for a local utility contractor for analysis and control of Losses Reduction Project.
Table 2 General equations considered in the model
| Variable | See | Equation |
|---|---|---|
| Annual cost per meters reading | Figure 4 | Value (US$) = (# of existing electromechanical meters) * (Annual frequency reading)*(Cost per manual reading of each electromechanical meter) Where: Cost per manual reading of each electromechanical meter = (daily cost of technical staff)/(daily average number of meters read by a technician staff) |
| Annual energy cost due to non- Technical losses | Figure 5 | Value (US$) = energy fee (US$/kWh) * ((Total average annual consumption (kWh) * ( Estimated Average percentage of non- Technical losses)) |
| Customer annual saving | Figure 6 | Value (US$) = (total energy consumption billing of customers before using smart meters (US$)) - (total energy consumption billing of customers with smart meters (US$)) |
| Annual job creation | Figure 7 | Value (# employment) = (# of jobs created due to the electromechanical meter reading remaining) + (# of jobs created by the installation of new smart meters) + (# of jobs created by the installation of equipment at the substation) + (# of jobs associated with new services) |
| Technology cost | Figure 9 | Value (US$)=( # of meters to be replaced by year) * (meter cost(US$))+(# of AMI TWACS substations) * (equipment AMI TWACS cost (US$/year)) |
| Annual Installation costs of equipment and maintenance | Figure 10 | Value (US$)= (annual installation substation AMI TWACS costs (US$/year))+(annual installation Smart meters costs(US$/year))+(Annual maintenance cost (US$/year))= (annual maintenance substation AMI TWACS costs (US$/año))+((annual maintenance Smart meters costs (US$/year))+(annual electromechanical meters replacement costs (US$/year)) |
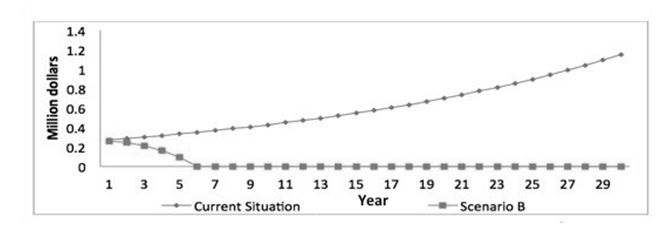
Remote meter reading saving
As shown below in Figure 4, costs, associated with meter reading, drops significantly with new advanced metering technology if compared to the current situation. The main reason is due to the ability to perform tasks remotely through distant communication with these devices. Another interesting feature of this technology is the ability to remotely disconnect and reconnect users when the situation requires it. The graph shows that implementation costs get to the minimum value in the sixth year, which is when the entire implementation is deployed. It is worth to point out that in a competitive environment, the cost reduction (savings) can be transferred to the customer.
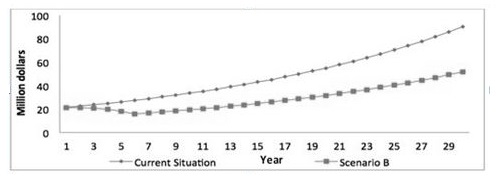
Non-Technical losses reduction
One of the main reasons for the local utility to adopt the new smart metering infrastructure is the high non-technical losses in its network. The results from conducted analysis showed that in the first model year, economic losses were in the order of 21.5 million dollar per year (Carrillo, 2011), which concluded that fraudulent connections meant 1.82 million dollar monthly.
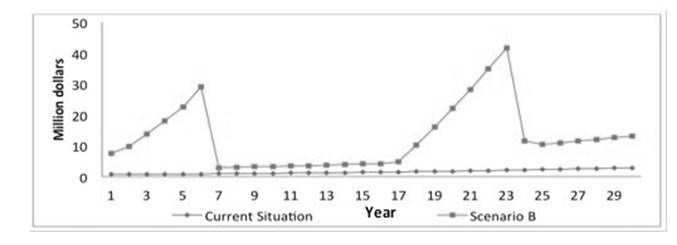
Figure 5 shows a significant cost reduction in annual operations due to the elimination of non-technical losses when compared with the current situation. Consequently, implementing smart meters has a direct relationship with growing revenue. The analysis estimates that after six years of such implementation, which is the point where smart metering is fully deployed, savings from recovered losses are $ 15.7 million dollar. Figure 5 also shows a slight increase in costs at the end of the implementation period, due to three important factors: market growth, annual inflation, and increased energy price while keeping the percentage of non-technical losses stable.
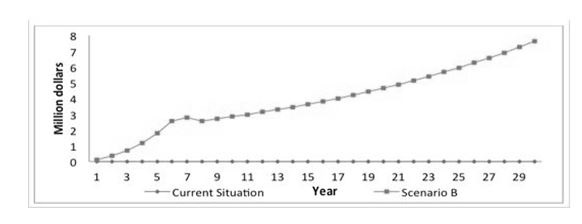
Customers annual saving
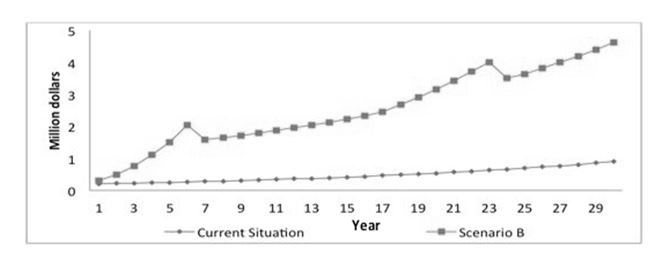
Figure 6 shows savings that could be passed through to customers in the event of implementing smart meters. The perceived savings in Scenario B was about $7 dollar per year for each customer. Although customers’ savings is observed in the new scenario, it is considerable low, and that is because per capita electricity consumption in Colombia is relatively low if compared with other countries.
2.5 Step 6: Social and environmental assessment
In order to assess social and environmental aspects of smart metering implementation, an analysis was performed considering four aspects: Jobs creation, social acceptance, gap in personnel’s skills, and reduction of CO2 emissions.
Job creation
One task that brings great challenges is evaluating the impact on employment while executing this project. Figure 7 shows a negative impact on job creation when comparing the new Scenarios versus the current situation. The main reason is that AMI eliminates manual readings as well as the need for personnel to do local connection and reconnection, which in the case of smart meter technology can be done remotely. Such implementations allow utilities to reduce labor requirements while reducing operating costs.
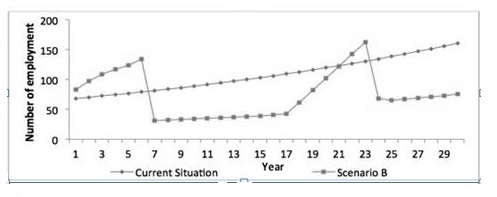
Figure 7 shows that only in the first 6 years of the model and in years 23 to 24, there is more job creation under the new Scenarios when compared to the current situation. Those incremental peaks observed in the graph are driven by a large number of installations that might be required in order to deploy the new technology. Although there is a negative impact on society from job creation/elimination prospective, there is an economic benefit to utilities due to process automation.
Social acceptance
Consumer resistance toward implementation of smart meters can be the major barrier in developing an advanced metering infrastructure. This happens because users do not perceive an added value from smart grids. In addition, customers may fear for the safety and privacy of their data since those meters can track and control their energy use (He et al., 2011).
In the context of Cali city, and especially in low-income communities, whom are satisfied with the current measurement system, there have been difficulties in the roll out of advanced metering infrastructure. Consequently, it is necessary to communicate the benefits that smart metering brings to customers as well as explaining the economic impact AMI projects generate in order to dissipate opposition from costumers.
Gap in skills and personnel in Cali city
Another important aspect to consider is the impact in terms of creating new skilled labor force that increases knowledge and competitiveness. Since 2009, the local utility began with extensive research to define the most appropriate AMI technology for their purposes. After selecting the most suitable for them, AMI TWACS technology, the company started to train personnel and hired “Proyectos de Ingeniería S.A” (private sector company) to install equipment and operate measurement devices. Additionally, there has been academic research and some progress has been made in the subject by different research groups in the country. Researchers from High Voltage Research Group (GRALTA from Spanish) and other research groups at Universidad del Valle have developed different projects about assessment of socioeconomic and environmental impact from AMI implementation. Table 3 shows the qualified personnel for handling the Advantage measurement infrastructures for the three entities mentioned (local utility, Universidad del Valle y “Proyectos de Ingeniería S.A”).
Table 3 Qualified personnel to handle the AMI technologies in Cali city.
| Institution | # People |
|---|---|
| Academy | 15 |
| Public Sector | 7 |
| Private Sector | 12 |
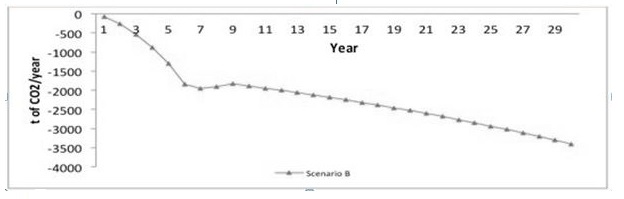
Reduction of CO 2 emissions for the case study
To determine reduction of CO2 emissions due to the use of smart meter technology in Cali city, a methodology for calculating emissions that is specified in (Oficina Catalana del Canvi Climátic, 2011) was used. Such methodology considered the annual electricity consumption by customers, the smart meter consumption, and average emission factor of 126 gCO2/kWh (XM, 2012) associated to electricity generation in Colombia. Figure 8 shows the expected annual reduction of CO2 emissions for the new scenario. The consumption information in Cali comes from the National Interconnected System, and therefore, decreasing CO2 emissions will not only benefit the city but the whole country, especially those regions where electricity come from thermo-plants. It is important to highlight that CO2 emissions in Colombia are very low in comparison with other countries.
2.6 Step 7: Economical quantification of benefits
The cost analysis included the meters´ and equipment in substations acquisition, as well as other costs associated with the installation and maintenance of those advanced technology devices thereafter.
Meters and substation equipment costs
As in the case study, a 30-year model implies the periodical investment for upgrading, replacing, and acquisition of components for AMI technology. Figure 9 illustrates cyclic expenditures in order to maintain optimal functionality of the system to be implemented in Cali city. As shown in the graph, there are two replacement periods: the first, during the first 6 years (2016-2021), representing the smart meters roll out to all end users; and a second, that begins on the 18-year model and ends in (2038), corresponding to the renewal of previously installed equipment.
During the first year of implementation (2016), it can be observed a progressive increase in costs due to the fact that implementing smart meters is massive. For the period of time involving equipment renewal, the years 2032-2037, the behavior is similar to 2016-2021.
In this model, a decrease of 5% smart meters costs is assumed as found in the literature, since by the passing of the years, the electronic devices are often adversely affected.
It is important to notice that utility’s smart meter price is higher than the reference price found in the market, due to the particularities of Colombian public companies as this utility is.
Installation equipment and maintenance costs
To estimate costs associated with installation and maintenance for new smart meter technology, information provided by “Proyectos de Ingeniería S.A” company was collected. That company won the public bidding carry out by local utility for the implementation of advanced metering technology in Cali city.
The results for annual installation and maintenance costs are shown in Figure 10 shown below.
To determine maintenance cost, this study relied in failure rate found in the literature which is 1.5 % for smart meters. For the current situation (Scenario A), it is assumed 1% as reported by the local utility. The cost difference between the current situation and the new scenario is mainly due to two aspects: first, cost while deploying AMI for the first 6 years of the program (2016-2021) and during equipment upgrade (2032-2037). The second aspect is due to the cost difference between electromechanical and smart meters, and that the latter has a higher probability of failure.
2.7 Step 8: Compare the costs and benefits
Figures 11 show the stakeholders’ total economic benefits (Customers and utility) for the new scenario considered.
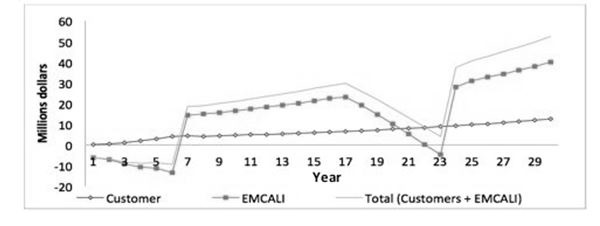
Once costs and benefits have been estimated, the methodology suggests three ways to compare them in order to evaluate the cost-benefit of the project. The three methods are the following: Annual comparison, cumulative comparison, Net Present Value (NPV). In this research, the net present value method was applied.
Table 4 shows a positive net present value for customers due to savings. Those savings are counting on customers having better management on their consumption habits. Nevertheless, it is important to note that saving is relatively low and is strongly conditioned by customers´ sociocultural education. A negative NPV for the local utility would be observed in the first 15 years of this model, due to the implementation cost. After that period, a larger collection can be seen in relation to the implementation cost, bringing a profit gained during the rest of the model. The above is supported by strong reduction of non-technical losses. According to engineers at the local utility, the project would not be viable if the investment recovery is not within the first 5 years of implementation. For this case study, such recovery occurs only after the first 15 years.
Table 4 shows net present value for 10, 20 and 30 years’ projects.
3. Sensitivity analysis
The goal of the sensitivity analysis is to find the range of variables that may lead to a positive result in the cost-benefit analysis. For this, it is necessary to identify the critical variables commutation values, i.e., the value that it would occur for the NPV to be zero, or more generally, that the project´s result is not under certain minimum acceptability level. A flow chart of sensitivity analysis loop (in red) application is shown in Figure 12.
For this study, the full or sectorized implementation as well as smart meter lifetime were considered as the most important variables. The main reasons for these variables to be selected are: in the previous study, full implementation was evaluated leaving the sectorized for evaluation. The local utility has as a main goal to reduce the energy losses, which means they have identified certain geographic places at the city there, where there is a high tendency for this to occur. In the previous study, a lifetime of 20 years was considered, being the most convenient for the company. However, in the literature a lifetime for smart meters is linked to software update, which is not longer than 12 years.
3.1 Installation zone determination
For this study, a detailed information for energy consumption and losses characteristics is required for those zones where the smart meters will be installed. This information is scarce for the local utility; however, having into consideration certain assumptions about the sectors where the highest energy consumption and losses are presented, would help to determine the optimal zones of installation. This could be done using georeferenced systems.
For the actual project, it was possible to identify certain customers who might be potentially responsive to a smart meter implementation. A certain zone is more convenient if meets the following:
Residential customers having an energy consumption level above the urban average (about 1000kWh/year per capita) and a sector with the highest socio economic level, since there is a correlation between these two variables.
Implementation of the smart meter technologies in low income socio economic zones, where a highest non-technical losses are presented.
3.2 Sensitivity analysis results
The obtained results considering the previous assumptions are:
Quantifiable benefits
The economic quantifiable benefits applied to the analysis of sensitivity were divided into: savings from meter remote readings, non-technical losses reduction and customers’ economic savings.
The results show that the cost for remote meter reading is 54% lower than with full implementation model. At the same time, energy fraud is also reduced in 6% in those zones with high-energy losses, which is positive from the economic point of view. Finally, and taking into consideration the case where there is a full implementation (year 20), there is a perceived economic savings for all customers of about 1.15 million dollars (an average of 4.97 dollars) with the smart meters (scenario B).
Social and environmental assessment
From the four social factors assessed in section 4.4., only those related to job generation and CO2 emissions will change due to the sensitivity analysis, which it is expected since there are social aspects like the skills gap, qualified personnel and the social acceptance are not altered by the analysis. From the analysis related to the job generation, it is concluded that the impact is negative. For the CO2 emissions is also observed a reduction year by year as in the full implementation.
Cost quantification
The results showed that the associated costs related to the smart meter installation, the substation equipment and installation and maintenance, present a significantly important reduction compared to the situation where there is a full implementation. Compared to both scenarios, in the first 6 years of implementation, a 54% reduction on the installation and maintenance, and the smart meter infrastructure costs is presented.
Costs and benefits comparison
The cost comparison was done using the NPV method as in the analysis where there is a full implementation. The results for the different years are shown in Table 5.
Table 5 Financial analysis for the costumers and local utility with sensitivity analysis.
| Year | NPV Customers | NPV (Retail Energy supply company and Distribution System Operator) |
|---|---|---|
| Scenario B (Million dollars) | Scenario B (Million dollars) | |
| 5 | 2.7 | -10.7 |
| 10 | 12.0 | 36.7 |
| 15 | 23.5 | 75.9 |
| 20 | 38.4 | 120.3 |
In the previous tables, it is shown that the sectorized implementation has a better economic scenario for the stakeholders (customers and local utility) in the energy smart metering. For the customers, a positive NPV for all years is observed; the main reason to support this is the savings from a better energy consumption management. For the local utility, the economic scenario improves considerably having a positive balance in the seventh year, a year after the full implementation finishes.
The analysis for both cases in this research is shown in Table 6. It shows the economic and social impacts for all stakeholders related to smart metering in Cali.
Table 6 Social and economic impact.
| Advanced metering infrastructure | |
|---|---|
| Variable social | Social Impact |
| Jobs created | Negative |
| Gap in skills and personnel in Cali city | Positive |
| Social acceptance | Negative |
| CO2 Emissions | Positive |
| Variable economical | Economic Impact |
| Cost for roll out, operation and maintenance of the meters | Negative |
| Remote Meter Reading Saving | Positive |
| Non-Technical losses | Positive |
| Customer cost savings | Positive |
| NPV Total implementation | Negative |
| NPV sectorized implementation | Positive |
In this case, two factors are considered negative and two positive for the social scenario. It is important to say that despite that the job generation variable has a negative impact, it will present a positive economic impact for the company. From the skills gap perspective and qualified personnel, it is appreciated a positive impact due to the new job opportunities for the energy smart metering implementation. Finally, it is evident a positive impact in the annual CO2 reduction. However, it is important to mention that total CO2 emissions in Colombia are still too low compared to those in other countries.
From the economic variables, it is observed that there is a positive benefit if a sectorized and a not a full implementation is carried out. The results for the sectorized implementation led to full NPV recovery in the seventh year, right after the full implementation for all customers.
4. Conclusions
Using the proposed methodology enables the plant engineer to quantify the costs and monetize the economic and environmental benefits that smart metering brings to Cali city.
On the full implementation scenario, the results showed that it is not feasible to conduct it since the return on investment was in the 18th year of the model. However, this may change if the potential benefits of a demand response program are considered, supported with advanced metering infrastructure.
From the social point of view, the benefits on the skills acquired by staff in the city are positive. However, employment may have a negative impact, due to technological advantages offered by the new metering infrastructure (remote reading, remote connection and disconnection), which considerably reduces the need for labor. A social acceptance negative assessment is presented due to social opposition in some areas of Cali, which might be reduced by possible economic investments in the technology socialization; this may be considered and further evaluated in a future study.
The results of a sectorized deployment scenario, let clearly to a recovery in the seventh year of the stage using as decision method the NPV, just one year after the full implementation. Social and environmental benefits had the same effect as in the full implementation scenario.
The sectorized scenario leads to the conclusion that full implementation is not justified in Cali, focusing on those areas of the city where maximum benefit can be arisen; in this case, these areas correspond to those where highest consumption occurs in the city and where there is a high occurrence of energy losses (high level of poverty and social problems).

