


 Inglês (pdf)
 Artigo em XML
 Referências do artigo
 Enviar este artigo por email
 Citado por SciELO
  Citado por Google
  Similares em
SciELO
Similares em
SciELO  Similares em Google
 Permalink
1. Introduction
According to current projections, the current world population of 6,000 million people would reach about 8,100 million by 2025 and about 9,600 million by 2050. At that time, the population of the developing world will probably be 8,200 million 1,2. Approximately 50 percent of potentially arable land is currently under annual and permanent crops. In addition, an area of 2,000 million hectares is degraded and land degradation is progressing through a series of processes related mainly to the mismanagement of land by man 2,3.
In this global context, many developing countries will face major challenges in achieving food security in a sustainable manner due to a number of reasons such as the land area available per inhabitant, the serious shortage of freshwater resources, and particular socio-economic conditions of the agricultural sector as well as their internal structures and conflicts 4.
That is why the significant increase in the world population in recent years has been demanding a constant challenge to agriculture to provide more food, both in quantity and quality.
Therefore, feeding a growing world population will be possible mainly if yields are increased by applying fertilizers, with rational application have been shown to produce higher quality products. However, increasing world production has brought an increase in the consumption of raw materials, among which phosphate resources, such as phosphoric rock, play a fundamental role.
Some countries do not have phosphate rock in their natural resources. The increase in prices in the world market, as well as the increase in demand in the last few years, has forced fertilizer producers to process several types of rocks available. These increases are causing technological difficulties some of which are due the different variables of operation that influence the process.
In Cuba, the situation of this phosphatic carrier for fertilizer production became even more acute in 1991, when imports originating almost entirely from the former Soviet Union ceased to be supplied. This forced an acceleration in the search for national sources that satisfy at least a part of the needs of the agriculture. Phosphate rock is a source that can be used for the formulation of fertilizers with some kind of benefit, and are found mainly in Holguin, Matanzas, Havana, Pinar del Rio and Sancti Spiritus. Thus by using existing reserves of this mineral throughout the country, a decrease in imports is achieved.
Single Superphosphate (SFS) is the oldest source of phosphorus for the manufacture of fertilizers. The first objective in producing it is the conversion of the phosphorus contained in the mineral to a more soluble form that is used by the plants, which contains between a 14% and 20% of P2O5 assimilable, this being largely dependent on the composition and characteristics of its fundamental raw material, which is phosphoric rock.
In Cuba a plant for the production of SFS by the carriage system DEN, discontinuous production method, was designed and built to work with phosphoric rock from the "La Pimienta" deposit in Pinar del Rio, as well as rock from other places, such as, Florida, Morocco and Algeria. The plant stopped producing due the problems of aging and deterioration.
The Trinidad de Guedes field, in Matanzas, offers the greatest prospects for the production of fertilizers, as it presents areas of clayey granular phosphorites with P2O5 contents that meet the minimum requirements for this industry 5-7.
This is why it is necessary to carry out the study of the determination of the optimal conditions of the process of obtaining SFS from the knowledge of the main characteristics of the Cuban phosphate raw material in order to determine the parameters or variables of operation that ensure the highest quality of the product. The need on the behalf of Chemical Industry to develop projects for the recovery of the Fertilizer Industry is the fundamental objective of the present work.
2. Methodology
The physical chemical characterization of the phosphoric rock was performed according to the following standards and / or methods shown in Table 1.
Table 1 Methods and norms for the physical-chemical characterization of cuban phosphoric rock.
| Determination | Method | Rule |
|---|---|---|
| P2O5 Total | Volumetric | NRIB 350: 81* |
| P2 O5 insoluble | Volumetric | NRIB 350: 81 |
| CaO | Volumetric | NRIB 350: 81 |
| SiO2 | Volumetric | NRIB 350: 81 |
| MgO | Volumetric | NRIB 350: 81 |
| R2O3 | Gravimetric | NRIB 350: 81 |
| Fe2O3 | Colorimetric | NRIB 350: 81 |
| CO2 | Volumetric | NRIB 350: 81 |
| F | Colorimetric | NRIB 350: 81 |
| Cl | Volumetric | NC 1118: 2016** |
| Mn | Colorimetric | NRIB 350: 81 |
| Na2O | Potentiometric | NRIB 350: 81 |
| K2O | Potentiometric | NRIB 350: 81 |
| SO4 | Gravimetric | NRIB 350: 81 |
| H2O | Gravimetric | NC 1119: 2016*** |
| Granulometry | Gravimetric | NC 631: 2008**** |
* Standard Branch of the Basic Industry. Phosphoric Rock. Chemical analysis.
** Cuban Standard. Fertilizers. Determination of Chlorides. Volumetric Method.
*** Cuban Standard. Fertilizers. Determination of Humidity. Gravimetric Method.
**** Cuban Standard. Minerals. Sieve analysis. General requirements.
Due to the simplicity of the process, the SFS can be produced in small and inexpensive plants. Its manufacture comprises the steps of mixing the phosphorite with the acid, then drying it to obtain a solid product in a reactor and finally a curing, which consists of stacking the product and allowing the acidification reaction to complete 8.
There are many variables that influence the process of obtaining SFS such as reaction time, sulfuric acid temperature and concentration, rock granulometry, setting time and temperature, curing time and acid/rock ratio 9,10. It is known from studies with rocks previously evaluated that in the intervals studied, which are relatively large, only the concentration of sulfuric acid and acid / rock ratio exert a significant influence in the process; therefore the execution of the laboratory tests was focused only on these two variables. Since these variables are independent of the process and were taken at the minimum allowable values, the product was obtained with minimal cost 4,9,11.
The chemical equations that predominate in the production process appear according to equations (1)-(2):
Ca10(PO4)6F2 + 10 H2SO4 + 5 H2O → 6 H3PO4 + 10 CaSO4·½H2O + 2 HF ( 1)
Ca10(PO4)6F2 + 14 H3PO4 + 10 H2O → 10 Ca(H2PO4)2·H2O + 2 HF ( 2)
The overall result of the process can be synthesized in equation (3):
Ca10(PO4)6F2 + 7 H2SO4 + 6 ½H2O → 3 Ca(H2PO4)2·H2O + 7 CaSO4·½H2O + 2 HF (3)
In addition to this fundamental reaction, other series of secondary reactions occur due to the presence of impurities in the phosphate ore. It follows that the amount of acid required for 100% acidification is difficult to predict by the effects of consumption and acid production due to the other constituents. In practice, estimates of stoichiometric requirements are made based on certain theoretical assumptions, which must necessarily be confronted in experiences derived from the acidification of the study source. In the case of the acid/rock ratio, the stoichiometric ratio (1.61) and higher were calculated on the basis of the impurities in the rock which consumed a certain amount of sulfuric acid (2.06) as explained previously.
The process-dependent variables were taken according to the quality indexes used in superphosphate manufactures, such as the assimilable phosphorus content, free acidity and humidity.
Apart from these quantitative determinations, the need to measure qualitative parameters of the reaction products was established, which is understood as the ease or difficulty of materials to form cakes or "cheeses", and friability as the ease of shredding of the "cheese" formed. For the latter, specific techniques are not determined, only visual inspection being used for their determination.
Table 2 shows the distribution or experimental plan used, the different levels for the variables studied and the volumes of sulfuric acid for the test concentrations, calculated on the basis of 100 g of phosphate resource.
Table 2 Experimental distribution and levels of variables.
| No. Exp. | Distribution % H 2 SO 4 | Experiment acid/rock Ratio | Concentrate of H 2 SO 4 (%) | acid/rock Ratio | Volume of H 2 SO 4 required (mL) |
|---|---|---|---|---|---|
| 1 | ?1 | ?1 | 65 | 1.61 | 43 |
| 2 | + 1 | ?1 | 75 | 1.61 | 35 |
| 3 | ? 1 | + 1 | 65 | 2.06 | 55 |
| 4 | + 1 | + 1 | 75 | 2.06 | 45 |
| 5 | +α | 0 | 77 | 1.83 | 38 |
| 6 | ?α | 0 | 63 | 1.83 | 47 |
| 7 | 0 | +α | 70 | 2.15 | 52 |
| 8 | 0 | ?α | 70 | 1.51 | 36 |
| 9 | 0 | 0 | 70 | 1.83 | 44 |
| 10 | 0 | 0 | 70 | 1.83 | 44 |
| 11 | 0 | 0 | 70 | 1.83 | 44 |
| 12 | 0 | 0 | 70 | 1.83 | 44 |
| 13 | 0 | 0 | 70 | 1.83 | 44 |
For the processing of the results the data were adjusted to a rotational centered design 22 with stars in which the effects of 2 factors in 13 experimental runs were studied, based on the uniformity of the precision, by the use of Statgraphics Centurion XVI. A Variance Analysis (ANOVA) was performed to verify if the variables in study were statistically significant and then we proceeded to search for mathematical expressions or models, which represent the relation of functionality between the dependent and independent variables, looking in all cases that this relationship is as appropriate as possible. For this, statistical methods based on multiple regression are used, applying their respective analysis of variance to the models obtained in order to evaluate their correlation coefficients and to certify with them the degree of correlation between the experimental data and the data calculated by the Model, in order to finally optimize the results 12.
2.1 Obtaining SFS at laboratory scale
The finely ground phosphate rock (85% <0.15 mm) is weighed so that 100 g of sample can be obtained and emptied into a reaction vessel. Similarly, sulfuric acid, previously prepared at the concentration (65% to 75%) and required temperature (30°C) and specified by experience, is measured volumetrically so as to obtain the amount calculated from the acid / rock reaction To use (1.61 to 2.06). It is then poured onto the phosphate sample by applying a manual stirring for one minute to homogenize the sample; This process was carried out inside a hood due to the evolution of gases during the reaction.
Once the mixing time is reached, the maximum reaction temperature is measured and then the reaction vessel is placed inside a stove, inside which the sample continues its reactions that started in the previous step. There it remains for 30 minutes, and is then extracted and cooled to room temperature. So far the process allows us to have a product called crude superphosphate, and it is necessary to follow its reaction process. At this stage, the physical characteristics of the product obtained are analyzed visually, with a view to having a global idea of the differences to which they give rise, depending on the variables used. Likewise, the percentages of loss produced in the reaction processes are determined by removing gases and water vapor by weighing the sample obtained before and after setting.
The product obtained is emptied into suitable containers, leaving it under normal laboratory conditions for a period of twenty-one days to complete its reactions, at which time a totally stationary state is not reached but is very close to it.
Sampling in order to characterize them chemically is verified in two stages, one after the setting, which is taken as day zero and another after the cure time, at 21 days, proceeding in each case to the analytical determination of the quality parameters of interest in duplicate, with the aim of obtaining a reliable result. 9,13
2.2 Process constants
The operational parameters were taken constant for the experiment. In this way, the fixed parameters of these variables are established the normal operational data that is reported in the bibliography is consulted, and the specific technology that is analyzed is adjusted (Table 3).
Table 3 Constant operational parameters.
| Operational parameter | Set level | Observations |
|---|---|---|
| Granulometry of the rock | 85% < 0.15 mm | Determined by the "Wet Mesh Analysis" |
| Sulfuric acid temperature | 30ºC | Room temperature |
| Setting temperature | 105ºC | In stove |
| Mixing time | 60 s | Manual operation |
| Setting time | 30 min | In stove |
| Curing time | 21 days | Outdoor piles |
| R2O3/P2O5 ratio in the rock | 31.8% | Permissible until 35% (5) |
3. Results and Discussion
The results obtained by analyzing the sample in duplicate are shown below in Table 4.
Table 4 Average results of the physical chemical characterization of the cuban phosphate rock benefited.
| Determination | Average values |
|---|---|
| P2O5 Total | 26.78 |
| P2O5 Insoluble | 23.30 |
| CaO | 38.92 |
| MgO | 0.49 |
| SiO2 | 7.58 |
| R2O3 | 8.92 |
| Fe2O3 | 3.09 |
| CO2 | 1.94 |
| F | 1.57 |
| Cl | 0.16 |
| Mn | 0.06 |
| Na2O | 0.96 |
| K2O | 1.36 |
| SO4 | 0.11 |
| H2O | 5.26 |
| Granulometry | |
| > 0.5 mm | 5.0 |
| 0.5 - 0.3 mm | 16.5 |
| 0.3 - 0.15 mm | 39.0 |
| < 0.15 mm | 39.5 |
As can be seen, phosphoric rock has a lower total P2O5 content than rocks traditionally used in the fertilizer industry, presenting a percentage of it in an insoluble form 7. The presence of a considerable amount of clays is highlighted in the sample, which is demonstrated by the iron, aluminum, magnesium, silica, sodium and potassium contents, which corroborates the results of mineralogical analysis. Also the presence of fluorine and carbonate reaffirm that the fundamental component of the granular rock is the apatite fluorocarbon.
As for the granulometric composition, it is possible to be detected by means of its analysis as the benefit process that is carried out with the fundamental objective of decreasing the clay content has been quite effective, since originally the sample from the deposit has about 70% under 0.15 mm mesh. To perform a cut in the wash at a larger particle size implies a decrease of the clay content, but higher losses of P2O5, so that the value of 0.15 mm was established to obtain a compromise between both variables 14.
The CaO/P2O5 ratio was 1.45 which is adequate for the acidification of the phosphoric rock to be an economically profitable industrial scale process, since when this ratio is greater than 1.6 a large excess of sulfuric acid is required to guarantee a good conversion of calcium phosphate to SFS 15.
On the other hand, the results obtained are shown in Tables 5 and 6, which describe the analytical results obtained during all the experiments, including measurements of the maximum reaction temperature and percentage losses, which originate during the reaction and the Setting of the fertilizer. In table 5, it was possible to conclude that the qualitative characteristics evaluated show that from the phosphoric rock beneficiation used in this work, it is possible to obtain SFS. It should be noted that those experimental points where an excess of liquid phase is observed can not be processed by the simulated DEN carriage technology, since this prevents the formation of the "cheese" described above.
Table 5 Qualitative appraisals.
| Experiment | Property analyzed | |||
|---|---|---|---|---|
| Consistency of the mixture | Degree of porosity | Friability | Gas evolution | |
| 1 | Compact | Micropore | high | Little |
| 2 | Little. Liquid phase | Micropore | Half | Little |
| 3 | Fluid liquid | Micropore | Half | Good |
| 4 | Compact | Micropore | high | Good |
| 5 | Compact | Micropore | Half | Good |
| 6 | Fluid liquid | Micropore | Half | Little |
| 7 | Compact | Micropore | high | Good |
| 8 | Little. Liquid phase | Micropore | Half | Little |
| 9 | Compact | Micropore | high | Good |
| 10 | Compact | Micropore | high | Good |
| 11 | Compact | Micropore | high | Good |
| 12 | Compact | Micropore | high | Good |
| 13 | Compact | Micropore | high | Good |
Table 6 Experimental results.
| Independent variables | 0 day | 21 days | |||||||
|---|---|---|---|---|---|---|---|---|---|
| Exp. | H 2 SO 4 (%) | acid/rock Ratio | T (ºC) | P 2 O 5 Assim. | Acidity Free | Humidity | P 2 O 5 Assim. | Acidity Free | Humidity |
| 1 | 65 | 1.61 | 70 | 10.98 | 6.58 | 15.14 | 11.52 | 3.45 | 9.88 |
| 2 | 75 | 1.61 | 73 | 9.81 | 3.21 | 15.11 | 11.90 | 2.95 | 9.26 |
| 3 | 65 | 2.06 | 74 | 11.79 | 6.18 | 14.50 | 12.06 | 2.90 | 8.97 |
| 4 | 75 | 2.06 | 75 | 11.73 | 4.43 | 15.08 | 12.39 | 2.02 | 8.09 |
| 5 | 77 | 1.83 | 99 | 10.21 | 7.46 | 13.80 | 12.21 | 2.84 | 9.11 |
| 6 | 63 | 1.83 | 70 | 9.73 | 6.37 | 14.26 | 11.75 | 3.28 | 9.76 |
| 7 | 70 | 2.15 | 76 | 11.11 | 7.28 | 15.71 | 12.16 | 2.21 | 8.64 |
| 8 | 70 | 1.51 | 78 | 8.97 | 4.72 | 11.26 | 11.59 | 3.31 | 9.23 |
| 9 | 70 | 1.83 | 79 | 9.56 | 5.06 | 13.41 | 11.95 | 2.53 | 8.31 |
| 10 | 70 | 1.83 | 79 | 9.59 | 5.19 | 13.53 | 12.03 | 2.26 | 8.28 |
| 11 | 70 | 1.83 | 78 | 10.80 | 6.18 | 14.50 | 12.12 | 2.14 | 8.52 |
| 12 | 70 | 1.83 | 79 | 9.85 | 5.39 | 13.70 | 12.27 | 2.12 | 8.32 |
| 13 | 70 | 1.83 | 78 | 9.85 | 5.70 | 13.81 | 12.25 | 2.10 | 8.43 |
Table 6 shows the influence of the studied parameters, such as concentration and acid/rock ratio, on the experimental results, varying the reaction temperature between 70ºC and 99ºC and the analytical determinations carried out to characterize the crude product and cured.
In this case, it was also possible to observe that in some experimental runs the free acidity at 21 days maintained high values in some cases greater than 2.4%, so that the possibility of increasing the curing period for a few more days could be taken into account. In order to determine whether the relevant reactions in superphosphate continue to occur in order to increase the assimilable phosphorus and therefore the conversion rate, by continuing to interact the free acidity present with the insoluble phosphorus of the product. Likewise, moisture in all experiments was greater than 8%, a standard value according to international quality specifications. For this reason, it is also considered to carry out a more in-depth study of the kinetics of the reaction, since it plays a decisive role in the quality of the final product obtained, as well as in the overall technical-economic efficiency of the system, despite being considered the cuban phosphoric rock as a reactive material.
It should be noted that the assimilable phosphorus obtained at all experimental points yield results lower than those reported internationally. This is due to the fact that it is part of a mineral considered of low law, since the phosphoric materials recommended for this production present at least 32% of P205. During the curing period an increase of this parameter is observed, which causes an increase of the conversion close to 80%, similar to that reported by other international rocks 16-17.
However, there are references from other countries that also follow the current tendency to take advantage of national resources and from them produce and market lower-grade fertilizers 18-19.
When performing the ANOVA, the following results are obtained, as shown in Figures 1, 2 and 3 and in Tables 7, 8 and 9.
P 2 O 5 assimilable (21 days)

Table 7 Analysis of Variance for % P2O5 Assimilable.
| Source | Sum of squares | Gl | Middle Square | Reason-F | P-value |
|---|---|---|---|---|---|
| A: Concentration Sulfuric Acid | 0.231383 | 1 | 0.231383 | 18.33 | 0.0020 |
| B: Acid / Rock Ratio | 0.421408 | 1 | 0.421408 | 33.39 | 0.0003 |
| BB | 0.0801371 | 1 | 0.0801371 | 6.35 | 0.0328 |
| Total error | 0.113595 | 9 | 0.0126216 | ||
| Total (corr.) | 0.846523 | 12 |
R-square = 86.581 percent
R-squared (adjusted by g.l.) = 82.1081 percent
Standard error of est. = 0.112346
Mean Absolute Error = 0.0747679
Durbin-Watson Statistic = 0.764387 (P = 0.0025)
Free acidity (21 days)

Table 8 Analysis of Variance for Free Acidity.
| Source | Sum of squares | Gl | Middle Square | Reason-F | P-value |
|---|---|---|---|---|---|
| A: Concentration Sulfuric Acid | 0.501127 | 1 | 0.501127 | 16.08 | 0.0039 |
| B: Acid / Rock Ratio | 1.15189 | 1 | 1.15189 | 36.95 | 0.0003 |
| AA | 1.0854 | 1 | 1.0854 | 34.82 | 0.0004 |
| BB | 0.417569 | 1 | 0.417569 | 13.40 | 0.0064 |
| Total error | 0.249386 | 8 | 0.0311733 | ||
| Total (corr.) | 3.25271 | 12 |
R-square = 92.333 percent
R-squared (adjusted by g.l.) = 88.4995 percent
Standard error of est. = 0.176559
Mean Absolute Error = 0.114326
Durbin-Watson Statistic = 1.32562 (P = 0.0570)
Humidity (21 days)

Table 9 Analysis of Variance for Humidity.
| Source | Sum of squares | Gl | Middle Square | Reason-F | P-value |
|---|---|---|---|---|---|
| A: Concentration Sulfuric Acid | 0.731589 | 1 | 0.731589 | 17.75 | 0.0029 |
| B: Acid / Rock Ratio | 1.0617 | 1 | 1.0617 | 25.76 | 0.0010 |
| AA | 1.72352 | 1 | 1.72352 | 41.82 | 0.0002 |
| BB | 0.426997 | 1 | 0.426997 | 10.36 | 0.0123 |
| Total error | 0.329734 | 8 | 0.0412168 | ||
| Total (corr.) | 4.08309 | 12 |
R-square = 91.9244 percent
R-squared (adjusted by g.l.) = 87.8866 percent
Standard error of est. = 0.203019
Mean absolute error = 0.129272
Durbin-Watson Statistic = 2.34862 (P = 0.6578)
As can be observed, in all cases it is observed that the variables acid/rock ratio and sulfuric acid concentration, have a statistically significant effect on the studied variables % P2O5, Free Acidity and Humidity, since the P-value is less than 0.05 with a confidence level of 95.0%. As it is known, an increase of the latter two variables is negative in the quality of the product, since they constitute restrictions to be fulfilled in its quality specifications.
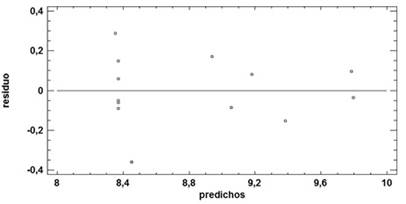
Tables 7, 8 and 9 show that the R-square statistic reflects that the obtained model describes a suitable behavior of the % P2O5, Free Acidity and Humidity of the process, respectively. The Durbin-Watson (DW) statistic examines the residuals to determine if there is any significant correlation based on the order in which the experimental data are presented. This is shown in Figures 4, 5 and 6 as shown below.


The models obtained are the following:
P2O5 assimilable (21 days)
% P2O5 assimilable = 0.750347 + 0.0340134·A + 8.73426·B - 2.10196·B2 ( 4)
Free Acidity (21 days)
Free Acidity = 102.544 - 2.2605·A - 19.4474·B + 0.0157999·A2 + 4.83949·B2 ( 5)
Humidity (21 days)
Humidity = 129.614 - 2.84787·A - 19.5794·B + 0.0199099·A2 + 4.89381·B2 (6)
When the optimization process is carried out, the maximum assimilable phosphorus of 12.28% is reached when the sulfuric acid concentration is 72% and the acid/rock ratio is 2.02. This result is considered acceptable, since the cuban phosphate rock is low phosphorus content, but high reactivity. With this result, a minimum humidity of 8.21% and a minimum free acidity of 2.05% are obtained, the latter complying with international product specifications of less than 2.4%, but not for moisture, which exceeds 8%. In order to achieve greater concentration in the SFS, it is recommended to study the possibility of mixing with other imported rocks of higher concentration.

Figure 7 shows the combination of factor levels that maximizes the desirability function in the indicated region, in addition to the combination of factors at which the optimum is reached, where the value at which the above results are obtained is 0.87.
4. Conclusions
The optimum parameters were reached in the interval studied for the beneficiated cuban rock, determining that it is possible to obtain SFS from the Trinidad de Guedes deposit, despite not being as high % P2O5 as in the case of other international rocks that are processed for this purpose.

