


 English (pdf)
 Article in xml format
 Article references
 Send this article by e-mail
 Cited by SciELO
  Cited by Google
  Similars in
SciELO
Similars in
SciELO  Similars in Google
 Permalink
1. Introduction
Direct discharges into the sewerage system and the treated effluents of wastewater treatment plants are the major pollution sources in urban environments 1. In Bogotá the main concerns in water quality are wastewater discharges, flow regulations, changes in land use and geomorphological alterations. The estimation of pollutant load is recommended to evaluate the impact in water quality, load may be defined as the mass of a pollutant that passes in a particular point in a specified amount of time (kg / year) or as the mass of a pollutant per capita (g / capita day). Water resource management is possible through the assessment of the maximum pollutant load a waterbody can accept before becoming impaired and the implementation of potential sanitation solutions 2.
The impact of a pollutant depends on the concentration and the water flow of the point of observation. Pollution loads can be estimated with information collected in field, the flow should be measured in the waterbody and the concentrations are obtained from laboratory analysis of the water samples collected.
Pollutant concentration in wastewater varies with time, in the case of domestic wastewater, the variation is daily; in the case of industrial wastewater can be daily, weekly or hourly depending on the production pattern. The fluctuations in concentrations may be useful to predict the impact on water quality, to estimate the volume of a discharges regarding the time of day, or for the design, operation and control of wastewater treatment plants 3.
Obtaining the regular flow and concentration in wastewater sampling is a challenge due to the variations in flow and its components. There are several techniques to minimize the effect of daily fluctuations in wastewater sampling 4:
Composite samples - time proportional: a number of discrete samples are set during a specific time and at the end the samples are mixed, for example, one sample is collected per hour and by the end of the sampling they are mixed in a single final sample. This type of sampling is acceptable when the variations in the components concentrations in wastewater are low.
Composite samples - flow proportional: the sample is collected by varying the volume of each individual aliquot proportional to the flow, maintaining a constant time interval between the aliquots. This type of sampling gives a more reliable estimate of the wastewater quality.
24-hours variation: samples are collected every hour and analyzed separately in order to understand the behavior and variation in the concentrations. It is more frequently used for modeling exercises.
Weekly samples: samples are taken proportional to time or flow, in order to determine the weekly pattern of waterbodies or discharges.
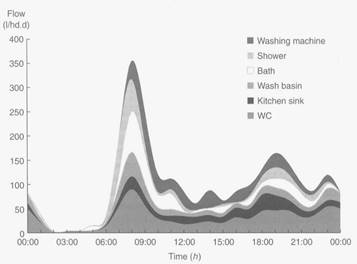
According to Butler and Davies 5, discharges from different appliances go to make up the general wastewater diurnal pattern. Usually, low flow occurs at night with peak periods during the morning and evening (Figure 1), this pattern can be reflected in rivers as they receive domestic wastewater discharges; however, the time for wastewater to travel in the sewerage system is variable which could cause a distortion of the pattern.
The flow patterns, in general, follow a diurnal pattern; however, each discharge has its own characteristics 6. Generally, two peaks are generated in the day, one in the morning and another in the afternoon, but this pattern will depend on the observation point. Figure 2 illustrates the impact of three main effects; the inflow hydrograph (pattern A) represents the temporal variation of wastewater production, which is similar throughout the catchment area. If wastewater is collected at one point and then transported from the end of one long pipe to another, flow attenuation will occur due to temporary storage in the pipeline, causing a reduction in peak flow, a lag in time and a distortion of the basic flow pattern (pattern B).
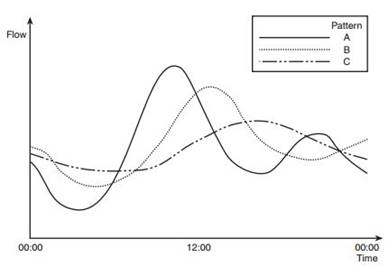
Usual sewerage systems are not like this, and consist of many connected networks, with inputs both at the most distant point of the catchment and adjacent to the outfall. Therefore, the time of wastewater to travel from the point of input to the point of measurement is variable and this effects causes a reduction in the peak and a distortion in the flow pattern (pattern C) 5.
The Tunjuelo River is the largest river in Bogotá; the total length is at least 73 km. About two fifths of the total population of the city is located in the Tunjuelo basin, including Tunjuelo, Usme, Ciudad Bolívar, Bosa and Sumapaz localities. The present study aims to evaluate wastewater patterns in the discharges and at different points along the river, using multiplying factors for BOD and TSS load. These loads are used for the formulation of a discharge tax, which is an economic instrument that charges users (domestic or industrial) for the pollutant load discharged into waterbodies.
2. Methodology
2.1 Selection of sampling points
The 24-hour sampling was used to understand the dynamic pattern of the most important wastewater discharges and different points in the Tunjuelo River. To minimize the effect of daily variations the samples were collected every two hours and analyzed separately. The discharges selected represent the largest contribution of load into the river, while the points in the river were selected by the location: upstream, midstream and downstream, along the four sections the river is divided for water management.
2.2 In-situ monitoring
The procedure of in-situ measurements covers the following activities: 1. 24-hours sampling planning. 2. In-situ measurements every 15 minutes (pH, temperature, dissolved oxygen, level and conductivity). 3. Daily cleaning and calibration of the probes and sensors. 5. Daily field data processing.
2.3 Sampling and laboratory analysis
Composite samples were taken every two hours from different points of the river and wastewater discharges during 24 and 20 hours, respectively. The samples collected in field were analyzed in the laboratory, therefore study the intraday variation of the water quality parameters. The parameters analyzed for each type of sample (river or discharge) are summarized in Table 1.
2.4 Multiplying factors
The multiplying factors were estimated using field information of the 24-hour sampling, which allowed the valuation of the water quality of the priority discharges and of different points on the main stream. The collected information was analyzed following the next steps:
The flow calibration curves were determined by potential regressions (Figure 3). Thus, the volumetric flow rate can be related to the corresponding level measurement.
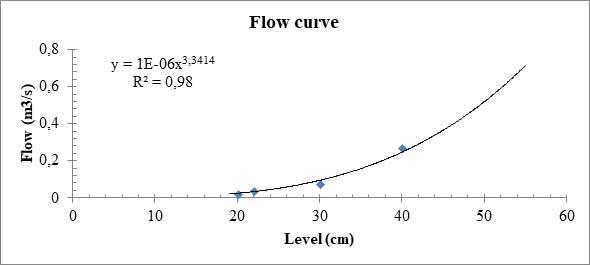
Flow was estimated for each level data measured in field from the equation obtained by the regression (see Eq 1), for the case of the example is:
For the first level measurement (23 cm), the calculation was:
Flow was estimated from each level data (Table 2):
Loads were calculated as a result of the concentration data obtained from the composite samples every two, and the flow for each concentration value which was the average of the different flows measured in the two-hour period.
The flow data series were flattened, using a simple exponential smoothing method that allowed attenuating the values in a series of time, in order to display a clear trending pattern; and forecast data to show changes in flow over time. Forecasts are calculated using weighted averages where the weights decrease exponentially as observations come from further in the past. The expression used to calculate the smoothing method was:
Where,
Yt Series value in time i
Pt+1 Forecast for time t+1
Pt Smoothed value for time t
α Attenuation factor (0<α<1)
Multiplying factors were estimated, determining the participation of each value in the average of the values.
3. Results and discussion
The results and the analysis of multiplying factors are presented in the Figures 4 and 5.
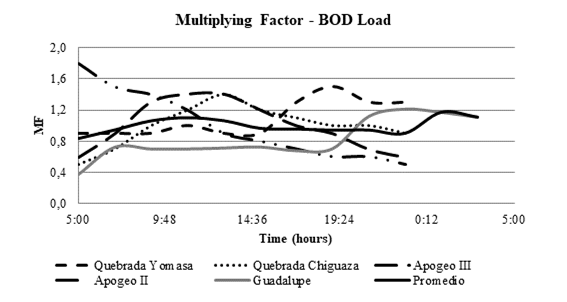
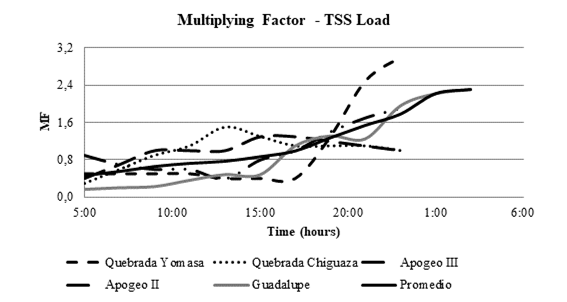
The multiplying factors for BOD and TSS load of the most important discharges in the Tunjuelo River are shown in Figure 2 and Figure 3. The results display that, except for Guadalupe, the discharges present a distortion in the flow pattern for both parameters (pattern C) 5, this may be due to the fact that these discharges have interconnected networks with different inputs before discharging directly into the river. On the other hand, the multiplying factor curve for BOD of Guadalupe shows a stable pattern and two peaks, one in the morning and the other at dawn. This is attributable to different inputs, at night or dawn, into the sewerage from the cleaning activities of numerous butcher shops and a slaughterhouse. The pattern of the multiplying factors for SST at this point shows an increase throughout the day reaching its peak in the early hours of the morning as well as for BOD. The results for the Tunjuelo River sampling sites, divided in four sections, are presented below.
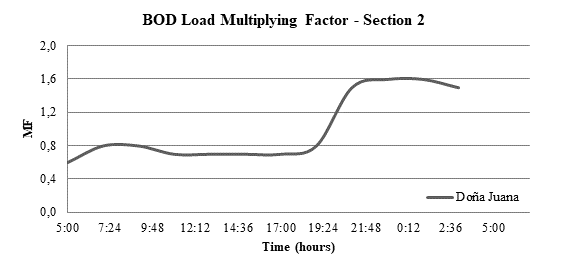
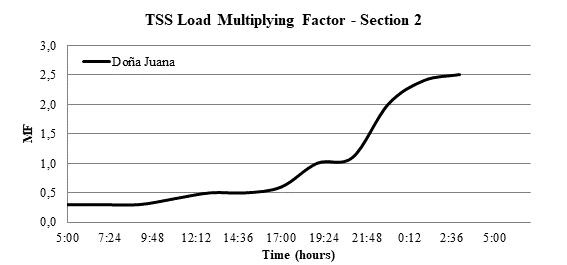
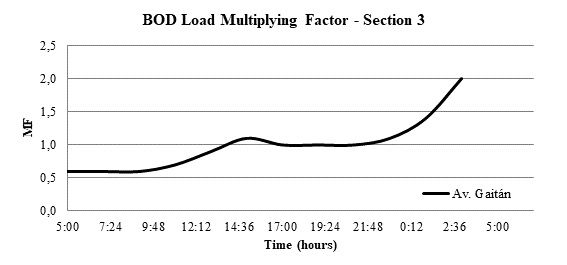
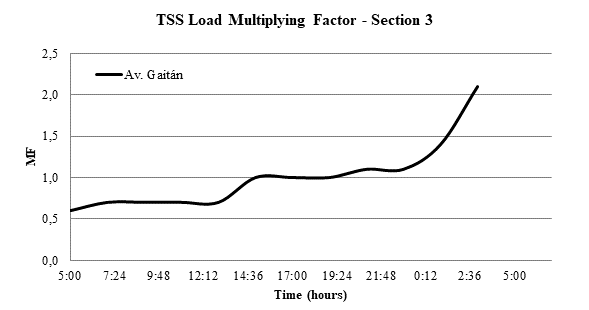
The results for BOD and TSS multiplying factors of the Tunjuelo River sections 2 and 3 are shown in Figures 6 thro ugh 9 . The pattern of the two parameters is similar and shows how the discharges travel along the river, being Quebrada Yomasa and Chiguaza the greatest contributors of load. Two BOD peaks were identified in section 2, a minor one between 7:00 am and 9:00 am and the other at 11:00 pm. The water mass distributions, from the streams to the river are show in section 3, through the peaks for BOD at 11:00 am and 1:00 am. The TSS pattern was similar for the two sections; the peaks between sections have a temporary difference that replicates the water mass transport coming from the tributaries. In section 2 there was a peak for TSS at 11:00 am and from 9:00 pm an increase until 3:00 am, and in section 3 the peaks were at 3:00 pm and 1:00 am increasing also until 3:00 a.m.
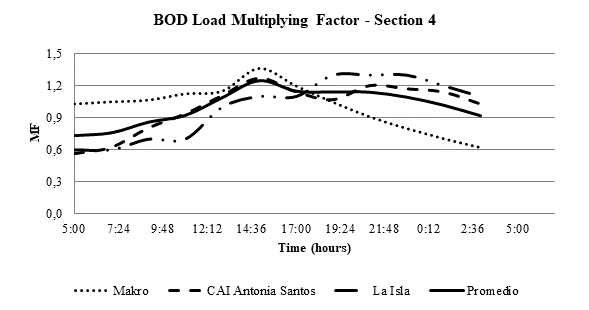
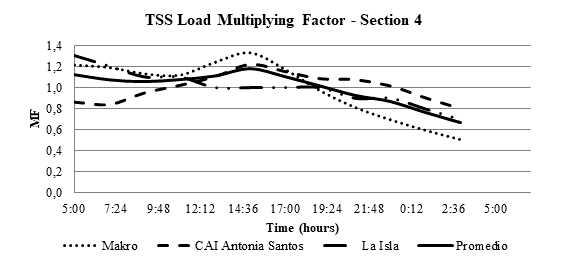
The results for river section 4 of BOD and TSS multiplying factors are observed in Figure 10 and 11. This section receives the largest contribution of load throughout the river. The dynamics of the curves were similar for the two parameters in all section 4 monitoring sites. However, Makro and CAI Antonia Santos sites show a similar behavior with a peak at approximately 3:00 pm, evidencing a pattern B where the river, as a pipe, attenuates the flow due to temporary storage 5. Finally, La Isla site has a distorted flow pattern, being near the river mouth it has received all the discharges, which produces oscillations throughout the day due to travel times.
4. Conclusions
The results shown in the present study exposed how the water quality of Tunjuelo River is affected by the wastewater discharges received throughout the four sections of the stream. Although there are typical patterns for wastewater flows depending on the water use, each discharge has its own characteristic that impacts the flow river pattern downstream in different ways, resulting in a distortion of the flow pattern in most of monitoring sites. Finally, is demonstrated the importance of calculating the multiplying factors before calculating water quality indexes or making decisions on sanitation actions in rivers, since each one behaves in a specific way throughout the day and should not be assumed the typical patterns found in literature.

