


 English (pdf)
 Article in xml format
 Article references
 Send this article by e-mail
 Cited by SciELO
  Cited by Google
  Similars in
SciELO
Similars in
SciELO  Similars in Google
 Permalink
1. Introduction
Throughout the world, most of public and private investments are addressed to the modernization of the conventional energy grids, especially for the implementation of smart public service networks, whereas microgrids have low funding options 1. Some investors are preparing suitable conditions for microgrids by including solar PV and small wind energies operating in alternate current (AC) at 60 Hz; requirements for the synchronization with the existing electrical grids. New inverters allow solar PV systems to operate even when conventional grids are down, reducing the time without electricity available. Historically, some engineers in the public service area have against the concept of microgrids, claiming lack of security and control over the distribution network. Meanwhile, the Institute of Electrical and Electronics Engineers (IEEE) developed a technical manual about microgrids. Ninety percent of the committee accepted this document in 2009 because it offers the security protocols for microgrid creation and the guidelines for reactive power. This fact allows microgrids to sell auxiliary systems in the same way providers do in the current established markets.
The experimental studies about voltage problems caused by PV solar systems are required because measured data can describe any system better. The voltage problems, synchronism and real produced power need to be analyzed rigorously before a massive implementation of PV solar systems. According to the NTC-5001 2 standard, the admissible voltage variation is ± 10 % for 230 V. In a three-phase network, the voltage imbalance occurs when each phase magnitude or phase angle between two phases are different. However, the fundamental principles of a three-phase system show that a small imbalance is necessary when a load condition is attended. This condition is accomplished only when non-linear monophasic loads are used, for instance in a supply change. The imbalance can cause the unnecessarily increment of the temperature in induction electric motor coils, reducing the performance and life cycle. Then, the imbalance could also be a problem in renewable energy generation when monophasic networks connect to distribution networks 3.
Generally, medium- and high-voltage networks present more fluctuations due to the use of electric arc furnaces, welding equipment, rolling mills and others 4,5. On the other hand, the short and long-term flicker are not common in low-voltage networks, but when it occurs it takes a short time; this is because it is caused by the start-up of large electric motors, X-ray equipment, hydraulic pumps and cooling systems. The flicker levels are no significant, but if their occurrence is relatively high, the start-up torque of electric motors can change, increasing the electric power and affecting the efficiency and life cycle. Other negative effects of voltage imbalance include the variation in the luminosity levels of light sources 6, malfunction in electronic equipment, and the unnecessary activation of Uninterruptible power supply (UPS) units, which reduce the battery life 7.
In distributed generation systems, the final customer can supply energy to any low-voltage system; this increases the system clearance and reduces the losses in the transmission/distribution stages and then the dependency of centralized generation. Distributed generation is desirable to identify the technical conditions for the interconnection between new energy suppliers, keeping the reliability in established levels. The Act 1715, as of 2014 by the Colombian government established the framework and legal instruments to promote and explore sources of non-conventional energy, mainly renewable. This act also encourages the investment, research and development of clean technologies for energy generation. Other topics dealt with are the connection procedures and surplus delivery to the network, to make possible the use of self-generation in the residential sector. The application of law 1715 of 2014 is of special relevance but offers more doubts than answers. The point is that while there are advances in deploying generators distributed around the world, they still have problems at the points of connection to the network and in the way the large generators distribute the resources. The objective of this work is to install an experimental network of 1,000 kWh / month using solar energy as a form of distributed generation at the University of Ibagué, Colombia. Among the factors analyzed is the characterization of the low voltage system considering the quality of the energy before and after the installation of the experimental network.
2. Electrical power quality
The quality of electric power systems aims to verify physical properties such as the amplitude, frequency, waveform, current and voltage. The most important standards about electrical power quality in Colombia include: the standard IEC 61000-4-7 for the electromagnetic compatibility; the IEEE Recommended Practices and Requirements for Harmonic Control in Electrical Power Systems ; the Colombian standard NTC-5001 for electric power systems; the Colombian standard NTC-1340 for voltage and nominal frequency in electric power systems of service networks; the Technical regulations for electrical systems RETIE; and the following series of regulations of the Colombian Energy and Gas Regulatory Commission (CREG), 070 (1998), 069 (2000), 084 (2002) and 024 (2005).
2.1. Disturbances of electrical power systems quality
Supply voltage and current suffer different alterations in frequency, amplitude and waveform produced by electromagnetic disturbances of non-linear loads: voltage imbalance, flicker, harmonic distortion and others defined in Table 1.
Table 1 Classification of disturbances in electrical power systems quality.
| Length | Disturbance |
|---|---|
| Long-term or permanent | Steady-state voltage variations |
| Voltage imbalance | |
| Flicker | |
| Long-term interruptions (t ≥1 min) | |
| Voltage harmonics | |
| Current harmonics | |
| Notches | |
| Long-term voltage variations | |
| Slow | Short-term interruptions (t<1 min) |
| Sags | |
| Swell | |
| Frequency variations | |
| Rapid | Transient overvoltage |
3. Assessment methodology
In electrical power quality, the accuracy in all measurements will determine the effectiveness of the proposed solutions. The methodology presented here follows the basic aspects of Dugan et al.5, and the Colombian standard NTC 5001 (2008). The data measurement took a week, taking 10 minutes of aggregation period for long-term (or permanent) imbalances and 10 seconds for the slow/rapid ones.
4. Software and measurement equipment
During the system monitoring, a Power analyzer HIOKI (model PW 3360-21) registered all measurements; subsequently, all data were loaded and processed in the accompanying software SF1001 for further analysis. The power analyzer specifications are presented in Table 2.
Table 2 Technical specifications of the power analyzer.
| Specification | Characteristic |
|---|---|
| Dielectric strength | 4.29 kV RMS |
| Number of channels | Voltage: 3 channels, Current: 3 channels |
| Measurement type | Monophasic 3-cable (1P3W, 1P3W1U) |
| Three-phase 3-cable (3P3W2M, 3P3W3M) | |
| Three-phase4-cable (3P4W) | |
| Measured frequency | 50/60 Hz |
| Measurement method | Digital sampling, Syncronized zero-cross |
| Effective range | Voltage: 90V a 780V; peak: ±1,400 V |
| Current: 5 % a 110 % of Full range | |
| Power: 5 % to 110 % of Full range | |
| Frequency: 45 Hz to 66 Hz | |
| Accuracy | 45 Hz to 66 Hz: ±2.3 % rdg. ±0.4 % f.s |
| Above 1 kHz: ±3 % rdg. ±0.2 % f.s. | |
| Above 3 kHz: ±10 % rdg. ±0.2 % f.s. |
5. Results and analysis from the electrical power quality measurements in the common connection point
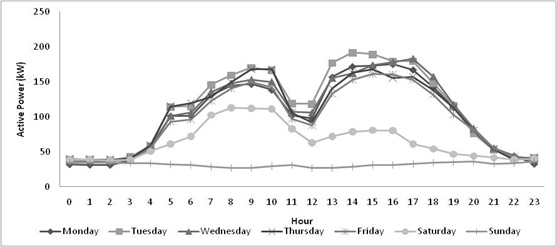
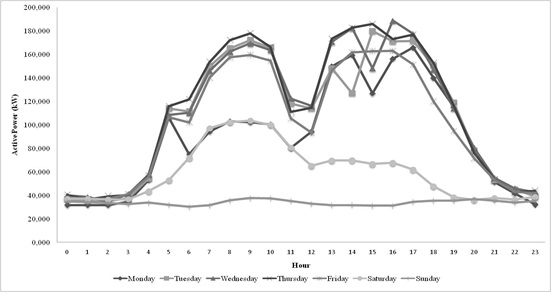
The daily measurements of active power obtained before and after the installation of the experimental PV solar system did not show significant changes, Figure 1 and Figure 2. During the academic period, the maximum energy consumption was 190 kW, but decreased to only 30 kW on vacation time. On Sundays, the academic activities do not affect the energy consumption during the operation of the PV solar system from 10 h to 15 h, except for an average decrease of 8 kW. A similar analysis from 10h to 12h suggested a 10-kW reduction. Conversely, the consumption of reactive power increased 7 % due to the operation of the PV solar system in comparison to the maximum value before the installation; if compared with the minimum value, the increase is 40 %.
5.1. Voltage variation in steady-state
The connection of the experimental PV solar system to the low-voltage network does not present negative impacts over the voltage variations in the three phases as stated in the standards NTC 5001, IEC 038 and EM 50160.This fact was verified after the analysis of the related information of the electrical power quality in steady state before and after the operation of the system, Table 3.
Table 3 Comparison of the voltage variations in steady-state.
| Phase | Before | After | Standard | |||
|---|---|---|---|---|---|---|
| Maximum | Minimum | Maximum | Minimum | Maximum | Minimum | |
| U1 | 102.61% | 95.90% | 101.67% | 97.38% | 110% | 90% |
| U2 | 102.87 % | 96.19% | 102.61% | 97.05% | 110% | 90% |
| U3 | 100.58% | 94.08% | 100.02% | 96.09% | 110% | 90% |
Additionally, the measurements did not register swell (overvoltage values), except an increment of 2 % in the voltage level. This increment was expected and it was covered by the standard as mentioned by Stetz et al. 8, and Stetz et al9.
5.2. Voltage imbalance
After the PV solar system startup, the voltage imbalance continued within the limits established by the NTC 5001 standard; however, the voltage imbalance reduced 3.5 to 70 % regarding the maximum and minimum values in Table 4. It is possible to obtain an increment in voltage imbalance as some authors suggested Von & Banerjee 10, but this was not the case.
5.3 Flicker
The measurements of short-term flicker indicate that all values, after the operation of the solar PV system, are within the recommended levels established by the NTC 5001 and EM 50160 standards, Table 5. The standards point out a maximum of 1.0 p.u. ; the measurements are in the range of 0.10 to 0.35 p.u. for the three phases. A similar value (0.38 p.u.) is reported for a solar 7.2 kWp PV system by Jianhuiet al11.
Table 5 Comparison of short-term flicker (PST).
| Phase | Before | After | Standard | |||
|---|---|---|---|---|---|---|
| Maximum | Minimum | Maximum | Minimum | Maximum | Minimum | |
| U1 | 0.30 p. u | 0.10 p.u | 0.30 p.u | 0.10 p.u | 1.00 p.u | 1.00 p.u |
| U2 | 0.32 p.u | 0.10 p.u | 0.35 p.u | 0.15 p.u | 1.00 p.u | 1.00 p.u |
| U3 | 0.27 p.u | 0.10 p.u | 0.25 p.u | 0.10 p.u | 1.00 p.u | 1.00 p.u |
Similarly, the measurements of long-term flicker are in agreement with the levels of the NTC 5001 standard. The maximum value of 0.65 p.u. is not exceeded by the measured values in the range of 0.09 to 0.20 p.u, Table 6. Also, the values of short and rapid flicker are smaller than the values reported by Jianhuiet al11 in the case of the 7.2 kWp PV solar system.
Table 6 Comparison of long-term flicker.
| Phase | Before | After | Standard | |||
|---|---|---|---|---|---|---|
| Maximum | Minimum | Maximum | Minimum | Maximum | Minimum | |
| U1 | 0.19 p. u | 0.09 p. u | 0,19 p. u | 0.09 p. u | 0.65 p. u | 0.65 p. u |
| U2 | 0.19 p. u | 0.10 p. u | 0,20 p. u | 0.10 p. u | 0.65 p. u | 0.65 p. u |
| U3 | 0.20 p. u | 0.10 p. u | 0,20 p. u | 0.09 p. u | 0.65 p. u | 0.65 p. u |
5.4. Long-term interruptions
According to the collected data, and considering the NTC 5001 standard, no long-term interruptions were identified during the measurement campaigns, before and after the operation of the PV solar system.
5.5. Voltage harmonics
All the total harmonic distortions (THD) comply with the NTC 5001 standard; that is, lower than 5 %. In this case, the maximum value of 3.75 % was found on the phase U2. However, the THD values increased with the operation of the PV solar system as follows: 7 % in the phase U1, 0.8 % in the phase U2 and 3 % in the line U3, Table 7. Some authors explain this fact by including the effects of the electromagnetic emissions and the harmonics over the existing electrical structure 12. Another reference reported a similar increase between 0.7 %-2.5 % in an 8 kWp PV system 13.
5.6. Current harmonics
In this case, the total distortion of demand current harmonics (TDDI) present values exceeding the limits of the NTC 5001 standard in all phases, Table 8; this condition is present regardless whether the PV system is operating. The maximum record of 17.8 represents an excess of 356 %. The values between the phases U2 and U3 do not differ significantly; the phase U1 shows an increment of 22 % in comparison to the previous measurements and it is similar to the reported values by Elkholy et al. 13, between 2 and 38 % in an 8 kWp PV solar system. Other authors report the existence of such increments 14.
5.7. Notches
According to the collected data, no significant changes were identified after the connection of the experimental PV solar system.
5.8. Slow perturbations
No slow perturbations were identified in the system caused by short-term interruptions, sags, swells or frequency variations.
5.9. Rapid perturbations
No transient swells were identified during the measuring period, neither before nor after the operation of the PV solar system. The active power presents increment of 66, 45 and 37 % in the phases U1, U2and U3, respectively, Table 9. This issue can be associated to the power availability in the system. On Sundays, the active power does not have consumption in the phases U2 e U3, 100 % smaller than previous values, whereas the phase U1 remains constant.
Table 9 Comparison of the values of active power in kW.
| Phase | Before | After | Standard | |||
|---|---|---|---|---|---|---|
| Maximum | Minimum | Maximum | Minimum | Maximum | Minimum | |
| U1 | 6.80 | 1.00 | 11.30 | 1.00 | NA | NA |
| U2 | 7.80 | 1.00 | 11.30 | 1.00 | NA | NA |
| U3 | 9.00 | 1.00 | 12.30 | 1.00 | NA | NA |
NA: Not available in the standard.
The total active power in the common connection point grew in 58 % due to the operation of the PV solar system, Table 10; this result corresponds to the increment in each phase. However, values of the total active power were not recorded during the operation of the solar system on Sundays because it generated all the energy cover the demand.
Table 10 Comparison of the total active power in kW.
| Parameter | Before | After | Standard | |||
|---|---|---|---|---|---|---|
| Maximum | Minimum | Maximum | Minimum | Maximum | Minimum | |
| Total active power | 21.50 | 4.00 | 33.88 | 3.00 | N. A | N. A |
NA: Not available in the standard.
On the other hand, the reactive power experienced an increment of 17 % in the phases U1 and U3, in the phase U2 was 62.5 %, Table 11; all values regarding the previous measured values. According to the IEEE 1547 standard, section 3 15, the inverter sizing must include a power factor close to 1.0 during operation. Thus, the reactive power delivered to the grid decreases, which is also recommended by other authors as Smith et al16.
Table 11 Comparison of the reactive power in kVar.
| Phase | Before | After | Standard | |||
|---|---|---|---|---|---|---|
| Maximum | Minimum | Maximum | Minimum | Maximum | Minimum | |
| U1 | 2.50 | 1.00 | 3.00 | 1.00 | NA | NA |
| U2 | 1.50 | 0.80 | 4.00 | 1.00 | NA | NA |
| U3 | -0.50 | -2.50 | -0.50 | -3.00 | NA | NA |
NA: Not available in the standard.
As shown in Table 12, the total reactive power increased in 42 % regarding the previous measures; the maximum record occurred during the operation of the experimental PV solar system.
Table 12 Comparison of the total reactive power in kVar.
| Phase | Before | After | Standard | |||
|---|---|---|---|---|---|---|
| Maximum | Minimum | Maximum | Minimum | Maximum | Minimum | |
| Total reactive power | 5.50 | 1.50 | 9.50 | 1.50 | N. A | N. A |
NA: Unavailable in the standard.
The power factor remained unchanged during the operation of the experimental PV solar system.All measurements are within the NTC 5001 17 standard levels; that is, ranging from 0.90 to 0.98, Table 13. These values are in agreement with the utility regulations, which state that PV solar systems must operate with a minimum power factor of 0.85 (inductive or capacitive) if the output power is 10 % higher than the installed capacity 18-20.
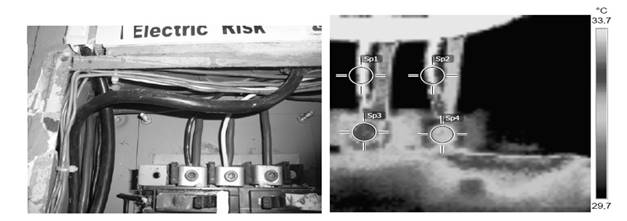
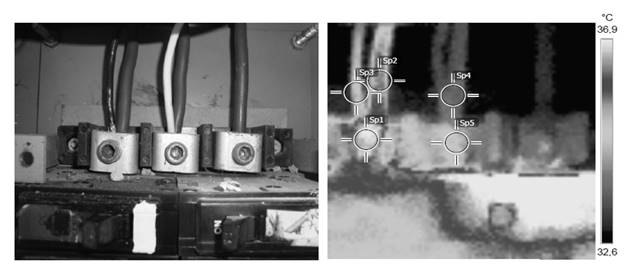
5.10. Thermographic analysis
The heat transfer to the ambient air limits the conductor capacity, so the insulation temperature must be lower than the service value. Figures 3 and 4 show the temperature distribution before the operation of the PV solar system, respectively. The measurements followed the ANSI/IEEE C037.010-4.4.3 (21) standard for electrical installations. The FLIR-I5 thermographic camera has an emissivity of 0.8, thermal sensibility of 0.1º C and accuracy of ±2 %. The data analysis took into consideration the Colombian standard NTC 2050, which defines the ambient and system operation temperatures. The standard also contains the circuit dimensioning rules, but has no information about its operation temperature; this issue was found in the FLUKE operation manual, in which reference values are offered for transformers and low-voltage circuits.
Warning levels in electrical circuit boards are established when the operating temperature is 40° C higher than the ambient temperature or when there is a temperature difference of 15° C with another element in the circuit. For electric transformers, the maximum ambient temperature must be 40° C; if the temperature of the insulating oil exceeds 10° C, there will be a 50 % of life reduction. According to the results presented in Table 14, the minimum and maximum temperature of the whole system is 31.4° C and 34.4° C, respectively, before the operation of the solar PV system. The temperature increases 7.5 % after the operation, which corresponds to maximum and minimum values of 36.3° C and 33.7° C, respectively. Anyway, this increment is within the limits of the standards NTC 2050 and BWG.
6. Conclusions
In accordance with the requirements established by the Colombian standard NTC 5001, the long-term perturbations increased 2 %, the voltage imbalance decreased 3.5 and 70 % in the maximum and minimum values, respectively. Similarly, the total harmonic distortion raised in 7, 0.8 and 3 % in the phases U1, U2, U3, respectively. In the phase U1 the current harmonics also increased 22 %, so the rapid perturbations in 66, 45 and 37 % in the phases U1, U2, U3, respectively. The reactive power increased 17 % in the phases U1and U3, and 62.5 % in the phase U2; but the total active and reactive values of power increased to 58 and 42 %, respectively. After the operation of the experimental PV solar system, no significant differences in the short- and long-term flicker, notches and long-term interruptions were identified. The slow perturbations did not suffer any change, so the short-term interruptions remained stable. The thermographic analysis showed a growth of 7.5 % in the temperature of the common connection point to the grid; with minimum and maximum values of 33.7° C and 36.9° C, respectively. The change in each monitored variable must be studied to improve the low-voltage network operation, making this renewable energy a more attractive business opportunity

