


 Inglês (pdf)
 Artigo em XML
 Referências do artigo
 Enviar este artigo por email
 Citado por SciELO
  Citado por Google
  Similares em
SciELO
Similares em
SciELO  Similares em Google
 Permalink
1. Introduction
The study of catalytic reactions is motivated by their many industrial applications. In particular, the transformation of raw materials into fuels or highly demanded precursors is currently drawing much attention. The conversion of syngas to ethanol 1 and the hydration of ethylene to ethanol 2-9 stand out among the catalytic reactions of increasing industrial interest 10. Ethanol has become a highly demanded product, presently being obtained mostly from fermentation processes 11,12, which require a careful implementation and control. However, for almost 70 years, the direct catalytic hydration of ethylene has been the alternative choice to obtain ethanol in the petrochemical industry 13-16.
The main disadvantage of the petrochemical route is that the yield and selectivity of the hydration reaction depend strongly on the kind of solid catalyst used to carry out the reaction, so that the performance of some catalysts can turn out to be economically unfavorable. The capability to improve the economics of the hydration process depends on the knowledge of the microscopic variables that determine the performance of the catalysts. As a complement to the experimental methods, it is advisable to perform computer simulation studies of the catalysts, with the aim of exploring and understanding the fundamental phenomena that occur on a catalyst at the nanometric scale.
By means of the wet impregnation method 17-19, Salazar 20 synthesized two types of tungsten-based catalysts, one using titania (TiO2) as the support of the active phase and the other using zirconia (ZrO2). The catalyst with WO3 (active phase) supported on TiO2 (rutile) showed higher activity and selectivity toward ethanol production.
The tetragonal phase has been reported as the most common crystalline form of WO3 existing at the operating conditions used for the calcination stage that is performed after the wet impregnation of the catalyst. Such a tetragonal phase can be present in two kinds of symmetries 21: P4/ncc (at 1,173.15 K) and P4/nmm (at 1,443.15 K).
From the consideration of the computational cost, it is more convenient to perform simulations with the P4/nmm crystal because it has a primitive cell with 8 atoms (W2O6) whereas the P4/ncc crystal has a cell with 16 atoms (W4O12). Therefore, for the present work, the experimental data reported by Locherer et al. 21 for the P4/nmm crystal were chosen as the starting point for the computation of the structure of the WO3 unit cell.
With regard to previous studies of the ethylene hydration reaction using computational catalysis, two works can be mentioned. Nakagawa et al.22, performed DFT-B3LYP calculations with Gaussian orbitals to study two reaction paths for the ethylene hydration catalyzed by metal cations and oxoacids. Van Erp & Meijer 23 used the Carr-Parinello approach to study the hydration of ethylene in protonated water clusters.
The present work was focused on the active phase of WO3. After the optimum values of the computational parameters that are required to carry out accurate density-functional-theory (DFT) calculations in a periodic system of the tetragonal P4/nmm WO3 crystal were defined, the structure of the catalyst was studied by determining its electronic and energetic characteristics.
To date, no works have yet been published on the hydration of ethylene over WO3 surfaces by means of DFT periodic calculations.
2. Methodology
2.1. Computational details
The Quantum Espresso (QE) package 24,25 was used to perform all the spin-polarized DFT calculations in the generalized-gradient approximation (GGA) with the Perdew-Burke and Ernzerhof (PBE) 26 exchange and correlation functional and the van der Waals dispersion forces (vdW) 27. A plane wave expansion was used to represent the electronic states of the valence electrons and Vanderbilt ultra-soft pseudopotentials were used to represent the interactions of the valence electrons with the ions. The k-point grid was generated through the Monkhorst & Pack method 28. All the crystalline structures were generated using the XCrysDen program 29.
2.2. Convergence study of the simulation parameters
In ideal DFT periodic calculations for crystalline solids, it is desirable to use the largest possible k-points grid and also high values for the kinetic energy cutoff for the wave-functions (E cut) and the kinetic energy cutoff for the charge density and potential (E cutrho), with the aim of representing the system in the most realistic way possible. Nevertheless, given the time constraints of simulation research works and the computational limitations of the current numerical processors, a balance should be found between the quality of the results and the efficiency of the calculations. This is the motivation for a parameter convergence study, which seeks to reduce the relative error of the results by calculating the energy differences between two crystalline phases of the solid as a function of a specific parameter.
In this work, the energy differences between the tetragonal P4/nmm and the simple cubic phases of WO3 were calculated. The E cut value was started at 5 Ry and increased by 5 Ry at each step up to a maximum value of 120 Ry. E cutrho values of 8, 10, and 12 times the value of E cut were tried. The number of k-points for the x axis (k x ) was varied between 2 and 10, with successive increments of 2, and the number of k-points for the y and z axes (k y and k z ) were obtained from k x , depending on the conventional crystal size.
If the lattice parameters of a unit cell obey the constraints a=b<c where c=2a, then the number of k-points for the x, y, and z axes can be written as k x , k x , and k x /2, respectively. Otherwise, if the parameters obey the constraints a=c<b where b=2a, then the number of k-points can be written as k x , k x /2, and k x , respectively.
The optimal values of the parameters were found by means of an iterative process in which the parameter values that were obtained at the end of the first convergence test were used as the starting values for the second convergence test, and the values obtained from that second test were used as the starting values for the third test, and so on until the parameters reached stable values.
The iterative process used to obtain the optimal values of the parameters is comprised of the following steps:
Step 1. The value of E cut is varied until convergence is achieved while using the values of E cutrho and k x that were obtained in the previous cycle. For the first cycle, the starting values of E cutrho and k x are 10 and 2, respectively, and k y and k z are defined by following the rules explained above.
Step 2. The value of E cutrho is varied until convergence is achieved by keeping unchanged the value of k x that was obtained from the previous cycle and using the value of E cut obtained from step 1.
Step 3.The value of k x is varied until convergence is achieved while using the values of E cut and E cutrho obtained from steps 1 and 2, respectively.
Step 4. The values of E cut , E cutrho , and k x obtained from steps 1 to 3 are compared with the values obtained at the end of the previous cycle. If the two sets of values are in disagreement, another iterative cycle (steps 1 to 3) is started. If the two sets of values are in agreement, the iterative process is terminated.
A similar parameter optimization method has previously been implemented by one of the authors of the present work 30. For WO3 (tetragonal P4/nmm), the optimization of the parameters required two iterative cycles and the corresponding results are given in Table 1.
Table 1 Values of the converged parameters.
| WO 3 (first iteration) | WO 3 (second iteration) | ||||
|---|---|---|---|---|---|
| E cut (Ry) | E cutrho /E cut | n k | E cut (Ry) | E cutrho /E cut | n k |
| 50 | 10 | 8 | 50 | 10 | * |
* A second iteration of the number of k-points was not required because the values of E cut and E cutrho had already converged.
The optimal values of the parameters are as follows: E cut= 50 Ry, E cutrho = 10 E cut y n k= 8. These values were used in all subsequent calculations for the tetragonal phase of WO3.
2.3. Surface energy
The surface energy, E surf , was calculated from the following expression 31-35:
where A is the area of the slab perpendicular to the z axis, E
slab
is the total energy of the slab, E
bulk
is the energy of the structure as a bulk, n
slab
is the number of formula units of the slab and n
bulk
is the number of formula units in the bulk. When the structure is stoichiometric, there is no loss or gain of energy by removing or adding atoms to the slab; in consequence, the summation term
Where
3. Results and discussion
3.1. Tetragonal (P4/nmm) WO 3 bulk
Based on the optimal values of the parameters, a full relaxation of the tetragonal P4/nmm WO3 unit cell was performed. All atomic positions and lattice parameters of WO3 were relaxed by using the variable-cell command of the QE package. The starting values of the lattice parameters and atomic coordinates were taken from the study by Locherer et al. 21.
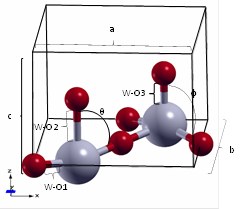
The WO3 structure has three different W-O bonds, designated as W-O1, W-O2 y W-O3. Also, two angles, designated as θ and (, are required to describe the structure’s geometry. The results obtained in this work agree with those reported in the open literature (see Table 2 and Figure 1).
Table 2 Lattice parameters, bond distances and angles of the tetragonal (P4/nmm) WO3 bulk.
| Variable | a,b (Å) | c (Å) | W-O1 (Å) | W-O2 (Å) | W-O3(Å) | θ (º) | ( (º) |
|---|---|---|---|---|---|---|---|
| Locherer et al. 21 | 5.294 | 3.928 | 1.8899 | 2.2015 | 1.7269 | 82.067 | 97.933 |
| Chatten et al.35 | - | - | 1.897 | 2.336 | 1.73 | - | - |
| This work | 5.322 | 3.918 | 1.8989 | 2.1566 | 1.7612 | 82.238 | 97.762 |
| ε r (%)* | 0.526 | 0.255 | 0.474 | 2.082 | 1.948 | 0.208 | 0.175 |
* Relative percentage error between the experimental values reported in 21 and the results of this work.
3.2. Density of states and band gap of the P4/nmm WO 3 bulk
A density of states (DOS) calculation for the bulk was performed by taking into account the geometry described in Section 3.1. Figure 2 shows that the 2p states of the oxygen atoms are predominant in the valence band and the 5d states of the tungsten atoms are predominant in the conduction band.
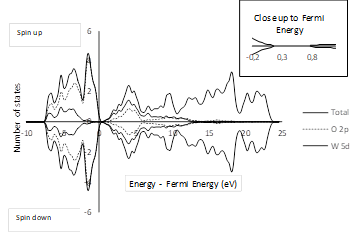
The band gap value obtained in this work is similar to the values reported in other theoretical studies (see Table 3). As far as the authors’ knowledge is concerned, no experimental values have been reported for the band gap of tetragonal P4/nmm WO3. However, Wang et al.36 suggested that the band gap of the tetragonal phase should be similar to that of the cubic phase because the tetragonal phase is just a deformation of the cubic phase. Indeed, several computational methodologies applied to these phases yield similar results 36. Even so, the band gap of 2.6 eV reported by Hjelm et al. 37 for the cubic phase is quite different from the values listed in Table 3 for the tetragonal phase. Such discrepancies are common in DFT studies for solids and are related to the fundamental aspects of the theory at the physical interpretation of the bands and orbitals 38. A possible way of elucidating such discrepancies is by implementing a specific hybrid functional to emulate the band gap 39. In this work, the widely used functional known as PBE was chosen because it has been already optimized using ultrasoft pseudopotentials, which ensures the reliability of the geometry and energy calculations.
Table 3 Band gap values for the bulk as obtained in this work and other theoretical studies.
| XC Functional | WO 3 phase | Band gap (eV) | |
|---|---|---|---|
| This work | sp*-PP-PBE+vdW | Tetragonal P4/nmm | 0.60 |
| Chatten et al. 35 | PP**-RPBE | Tetragonal P4/nmm | 0.66 |
| Wang et al. 36 | B3LYP | Tetragonal P4/nmm | 1.85 |
| Alvarez-Quiceno et al. 40 | PP-PBEsol | Tetragonal P4/nmm | 0.97 |
*Spin polarized
** Ultrasoft pseudopotential
3.3. Tetragonal P4/nmm (001) surfaces
The plane (001) is most frequently mentioned in the work by Salazar 20. The (001) surface is equivalent to the WO3 bulk with a vacuum space in the z axis.
In Figure 1, there are two protruding oxygen atoms; this could be a problem during the adsorption of electronegative molecules such as water and ethylene (the reactants for the production of ethanol) due to the electrostatic repulsion between negative point charges 41,42. Also, it is convenient to work with structures without dipoles because these can be troublesome for the calculations 43.
From these considerations, two surface models are proposed. Model I has no protruding oxygen atoms on the surface but it is not stoichiometric with regard to the WO3 unit. Model II has the same number of oxygen atoms at both sides of the surface and it is stoichiometric with regard to the WO3 unit. The layers are defined for each model as shown in Figure 3.
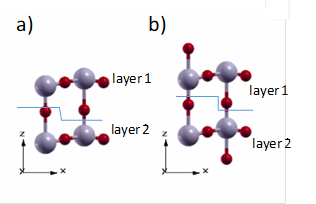
Figure 3 Models proposed for the (001) surface of the tetragonal P4/nmm WO3 a) Model I. Non-stoichiometric and non-dipole structure b) Model II. Stoichiometric and non-dipole structure.
A proposal similar to model II has been reported for the monoclinic WO3 (001) surface by taking into account superficial reconstructions of experimental works 44.
3.4. Surface energy expressions for the tetragonal P4/nmm WO 3 (001) surface
Suitable values for both the number of layers and the vacuum distance between the slabs have to be chosen in order to represent the nanostructures with a modest computational cost and achieve an appropriate model of the surface.
By following a procedure similar to the parameter convergence tests for the bulk described in Section 2.2, the optimum number of layers and the vacuum distance between the slabs were found by searching for the values of those parameters that turn out to be associated to consecutive calculations with a surface energy difference less than a prescribed tolerance. In this work, we used a tolerance of 0.5 meV/ Å2, which looks much lower than the one used in similar works 44,45.
In contrast to the parameter convergence tests for the bulk (in which total energies are involved), the convergence of the surface model is determined from the computation of surface energies.
As model I can be obtained from model II by removing two oxygen atoms (one atom at each end of the slab, see Figure 3), the summation term for model I is not null and the energy for model I should be larger than the energy for model II. Therefore, for model I, Eq.(1) takes the following form:
For a convenient calculation of E 0, the easiest choice for the molecular species i x in Eq.(2) is the molecular oxygen (triplet) O2. In that way, Eq.(2) takes the following form:
Where the chemical potential change
In Eq.(5), R is the universal gas constant, T is the absolute temperature,
Where n stands for the number of oxygen molecules, and
Taking all of the above into account and the fact that
The summation term in Eq.(1) vanishes for model II because this is stoichiometric. Therefore, for model II, Eq.(1) takes the following form:
3.5. Layer and vacuum convergence for the tetragonal P4/nmm (001) WO 3 surface
The procedure used to obtain the number of layers and the vacuum distance between the slabs can be summarized as follows. Firstly, the number of layers was converged using an arbitrary vacuum distance (16 Å), i.e., the number of layers was successively increased until the surface energy E surf did not change more than a prescribed tolerance of 0.5 meV/Å2. By using the resulting number of layers, the vacuum distance was changed until the surface energy did not change more than the same prescribed tolerance. This procedure differs from the one previously used for the parameter convergent tests because it is not iterative. These kinds of calculations are computationally more costly, and the assumption is made that changes will not occur in a second iteration because as shown in Figure 4b, no significant changes occur by varying the vacuum distance.
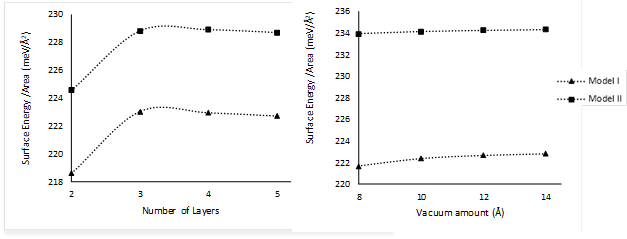
Figure 4 a) Surface energy as a function of the number of layers and b) surface energy as a function of the vacuum distance between slabs for the tetragonal P4/nmm (001) WO3 surface.
Both models of WO3 can be represented accurately by four layers and at least 10 Å of vacuum. However, in order to avoid the self-interaction between periodic slabs, a final value of 14 Å was chosen for all subsequent calculations.
3.6. Relaxation of the tetragonal P4/nmm WO 3 (001) surface
A full relaxation of only the atoms inside the slabs was performed for both models by using the values of the number of layers and vacuum distance found previously. This relaxation process is similar to the relaxation of the bulk (vc-relax), except for the avoidance of supercell movements.
As shown in Figure 5, the structural changes of both models due to such a relaxation are quite drastic. The surface model I turned into a tungsten coplanar structure with respect to the z axis (W1-W2, W3-W4, etc.). On the other hand, in the relaxed surface model II each column with a WO end is pulling along its length.
With regard to the bond distances (Table 4), surface model I has symmetric W-O bonds along the z axis, and surface model II simultaneously exhibits very short and long bonds. That model II changes more than model I by relaxation follows from the fact that the sum of the absolute values of the bond length differences before and after relaxation of model II is about three times the corresponding sum for model I.
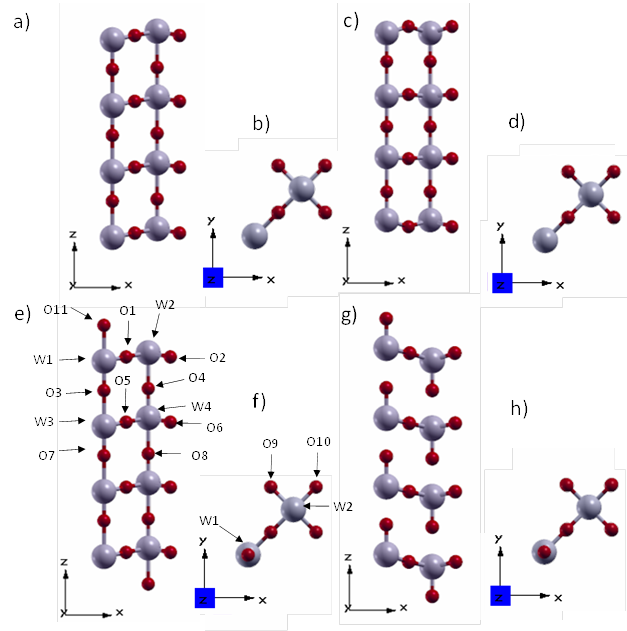
Figure 5 Views of the tetragonal P4/nmm WO3 (001) surface: (a, b) and (e, f) model I and model II before optimzation, respectively. (c, d) and (g, h) model I and model II after optimization, respectively.
Table 4 Tungsten-oxygen bond lengths before and after structural relaxation.
| Before relaxation | After relaxation | |||
|---|---|---|---|---|
| Bond | Model I | Model II | Model I | Model II |
| W1-O1(Å) | 1.8989 | 1.9248 | 1.9384 | |
| W1-O3(Å) | 1.7612 | 1.7347 | 2.3067 | |
| W1-O11(Å) | - | 2.1566 | - | 1.7061 |
| W2-O1(Å) | 1.8989 | 1.9248 | 1.8943 | |
| W2-O2(Å) | 1.8989 | 1.9248 | 1.8943 | |
| W2-O4(Å) | 2.1566 | 1.7347 | 1.7353 | |
| W2-O9(Å) | 1.8989 | 1.9248 | 1.8943 | |
| W2-O10(Å) | 1.8989 | 1.9248 | 1.8943 | |
| W3-O3(Å) | 2.1566 | 2.1331 | 1.7537 | |
| W3-O5(Å) | 1.8989 | 1.8843 | 1.9058 | |
| W3-O7(Å) | 1.7612 | 1.8644 | 2.2148 | |
| W4-O4(Å) | 1.7612 | 2.1331 | 2.2042 | |
| W4-O5(Å) | 1.8989 | 1.8843 | 1.9034 | |
| W4-O6(Å) | 1.8989 | 1.8843 | 1.9034 | |
| W4-O8(Å) | 2.1566 | 1.8644 | 1.7506 | |
3.7. Surface energy of the tetragonal P4/nmm WO 3 (001) surface
The relaxation or geometry optimization of the surface models not only yields a change of structure but also a change of surface energy, which decreases for both models, and the larger decrease occurs for model II.
The decrease in surface energy is related with the stability of the slab and the rearrangement of the superficial atoms, mainly. This result is as expected: more stability in exchange with geometrical distortions.
The relaxed surface model II turns out to be energetically more favorable than the relaxed surface model I because all the tungsten atoms in model I are penta-coordinated (instead of hexa-coordinated as in the bulk), and in consequence, surface model I has a larger energy.
Model II turns out to be more suitable to represent the WO3 catalyst because of its lower surface energy and correspondingly greater stability. This model has a surface energy comparable to that of the same plane of the monoclinic phase of WO3 (Table 5). Despite being different crystalline phases, the monoclinic (001) surface is similar to surface model II of the tetragonal phase. To date, no other works have been published to report the energy of a WO3 surface without protuberant oxygen atoms. This could be due to the additional difficulty involved in the implementation of the mathematical expression, Eq. (1), for the calculation of the surface energy of non-stoichiometric slabs.
Table 5 Surface energy of the WO3 (001) surfaces.
| XC Functional | WO 3 surface | E surf (meV/ Å 2 ) | |
|---|---|---|---|
| This work | sp-PP-PBE+vdW | Tetragonal P4/nmm (001) - Model I | 135.01 (222.96)* |
| sp-PP-PBE+vdW | Tetragonal P4/nmm (001) - Model II | 40.55 (228.92)* | |
| Wang et al. 36** | PP-PW91 | ε- Monoclinic (001) | 20.6 |
Calculated with six free layers.
* Slab before relaxation.
3.8. Projected density of states and band gap of the tetragonal P4/nmm WO 3 (001) surface
Figure 6 shows the projected density of states (PDOS) of the tetragonal WO3 surfaces. As in the bulk, in surface models I and II the presence of 2p states for the oxygen atoms in the valence band and 5d states for the tungsten atoms in the conduction band is remarkable; however, in the surface models the additional contribution of 5d states of tungsten in the conduction band and 2p states of oxygen in the valence band can be noticed.
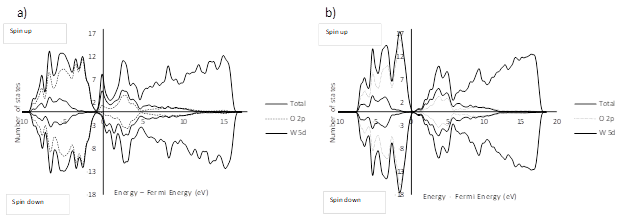
In both cases the band gap is practically zero, which indicates a migration of the semi-conductor character toward a semimetal character 47. For model I, a shift occurs for the PDOS of electrons with the same energy but different spin.
The PDOS reported in similar studies show a band gap which tends to be small (but not vanishing) for the WO3 (001) surfaces (Table 6); this feature seems to be peculiar for the tetragonal P4/nmm WO348.
Table 6 Band gap values for the (001) surface of the tetragonal and monoclinic phases of WO3.
| XC Functional | WO 3 surface | Band gap (eV) | |
|---|---|---|---|
| This work | sp-PP-PBE+vdW | Tetragonal P4/nmm (001) Model I | 0 (approx) |
| sp-PP-PBE+vdW | Tetragonal P4/nmm (001) Model II | 0 (approx) | |
| Wang et al. 44 | B3LYP | ε- Monoclinic (001) | 2.71 |
| Lambert-Mauriat et al.49 | PP-PBE | ɤ- Monoclinic (001) | 0.30 |
| Jin et al. 50 | PP-PW91 | ɤ- Monoclinic (001) | 0.40 |
4. Conclusions
In this work, we studied the tetragonal P4/nmm WO3 crystal which is of particular interest for the catalytic hydration of ethylene to ethanol. The lattice parameters obtained from periodical DFT calculations turned out to be close to the experimental values previously reported. Also, the calculated band gap was found to be in agreement with the values obtained in similar studies by using other methods for the bulk of the tetragonal P4/nmm phase or the (001) surface of the monoclinic phase.
Two models of the tetragonal P4/nmm WO3 (001) surface were proposed with the aim of studying the structure before and after relaxation and calculating the surface energy. In order to represent the solid surface accurately, a convergence procedure was implemented to obtain suitable values for the number of layers and the vacuum distance between slabs. A number of four layers and a distance of 10 Å were found to be appropriate. A difference of approximately 95 meV/Å2 between the two proposed surface models, indicates that surface model II is more stable than surface model I. The surface energy of model II happens to be somewhat larger than the surface energy of the ε-monoclinic phase of WO3.
The electronic behavior of the slabs (models I and II) looks very interesting, because they lose the semiconductor character of the bulk to acquire a semimetal response. This behavior is in agreement with previous studies, in which a band gap decrease for the surface relative to the bulk has been reported

