


 English (pdf)
 Article in xml format
 Article references
 Send this article by e-mail
 Cited by SciELO
  Cited by Google
  Similars in
SciELO
Similars in
SciELO  Similars in Google
 Permalink
1. Introduction
The environmental policies generated around the world seek to create systems for the reuse of resources. One of the resources to take advantage of is rainwater, in activities such as irrigation, washing communal areas, domestic uses, among others 1. However, rainwater runoff has a sediment load that could also be exploited according to its characteristics for purposes such as construction, soil restoration 2, gardening or road construction 3. Commonly the sediments drained of different water systems (channels, wetlands, streams, etc.) are arranged in sanitary landfills, confined for aquatic disposal or discharges into the sea. These practices are considered as the most applied management strategies in the world 4.
Around the world, sediments extracted from different water sources have been analyzed to determine their physical and chemical characteristics, amount of metals, organic matter, and polycyclic aromatic hydrocarbons. Some developed countries have regulations concerning the load of pollutants contained in sediments 4. However, these standards are not always met. Research has shown that concentrations of pollutants in sediments vary significantly according to the size of the sediment particles 5. Likewise, said concentrations might vary according to the type of land use, whether residential or industrial 6 or the contact surface of rainwater (roads, parking lots, roofs of different materials) 7.
On the other hand, several authors have studied the accumulation of sediments on roads in dry weather to determine the variation of sediment concentrations according to the climatic conditions and thus determine the pollutants concentrations such as heavy metals (HM) 8. Particulate loading on the roads increases as the number of dry days tending to a maximum equilibrium. Part of this load is washed during the rain event, and this amount can vary according to the slope of the road, the total height of precipitation and the particle size 9.
Additionally, in tropical cities, not much research has been done in urban basins, where particular climatic regimes are observed, which could have an influence on the physical and chemical characteristics of the sediments (for example, precipitation with high intensities in short time periods) 10. The objective of this work was to establish possible relationships between hydrological, physical and chemical characteristics of sediments in an experimental basin located in Bogota city (tropical high Andean region).
2. Material and methods
In Bogotá, until 2014 the entity responsible of managing the rainwater system of the city was the Empresa de Acueducto y Alcantarillado de Bogotá (EAB), which directly disposed the sediments from the maintenance of channels, streams and in general the sewage system on the Gibraltar site. This site is located in the south of the city 11, and the sediments arrive without any treatment 12. Since 2014, the management of the Bogotá’s rainwater system has been in charge of Instituto Distrital de Gestión de Riesgos y Cambio Climático, promoting the reuse of rainwater in several activities 13.
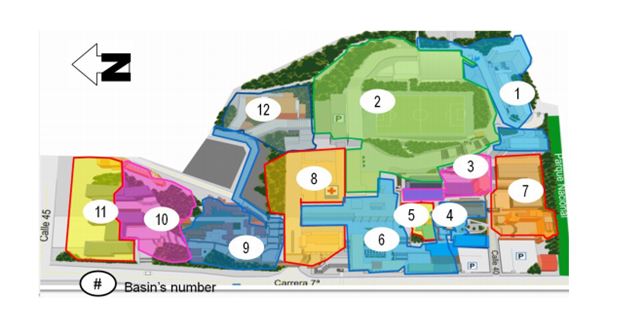
To study the sediments retained in rainwater harvesting system the experimentation was carried out in the constructed-wetland/storage-tank (CWST) of Pontificia Universidad Javeriana Bogotá (PUJ) (Fig. 1). This system has two sand traps. The Eastern Sand Trap (EST) receives the water runoff from the catchment corresponding to the parking lot building (0.81 ha). The Western Sand Trap (WST) receives the water runoff from the catchment corresponding to the soccer field and the surroundings (2.73 ha) 14 (Fig. 2).
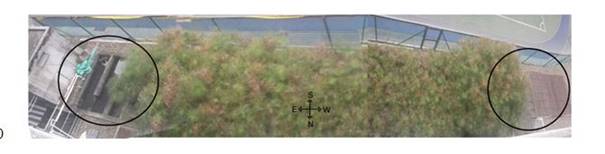
Figure 1 Constructed-wetland/storage-tank. On the right western sand trap, on the left, eastern sand trap (indicated with circles).
The sediment samples were taken every fortnight for five months in each sand trap. We installed four traps in the WST and six traps in the EST (Table 1). Samples 5 and 16 correspond to traps installed to collect sediments in periods more extended than the fortnight for each sand trap, from April 13 to May 25, 2016, for the WST and from August 3 to September 29, 2016, for the EST.
Table 1 Sampling campaigns from April 13 to September 29, 2016.
| Campaign | Date | Sample | Sand Trap |
|---|---|---|---|
| 1 | 13-Apr-2016 | 1 | W |
| 27-Apr-2016 | 2 | E | |
| 2 | 27-Apr-2016 | 3 | W |
| 11-May-2016 | 4 | E | |
| 3 | 11-May-2016 | 5 | W |
| 25-May-2016 | 6 | E | |
| 4 | 25-May-2016 | 7 | W |
| 8-Jun-2016 | 8 | E | |
| 5 | 8-Jun-2016 | 9 | W |
| 22-Jun-2016 | 10 | E | |
| 6 | 3-Aug-2016 | 11 | E |
| 18-Aug-2016 | |||
| 7 | 18-Aug-2016 | 12 | E |
| 1-Sep-2016 | |||
| 8 | 1-Sep-2016 | 13 | W |
| 15-Sep-2016 | 14 | E | |
| 9 | 15-Sep-2016 | 15 | E |
| 29-Sep-2016 | 16 | E |
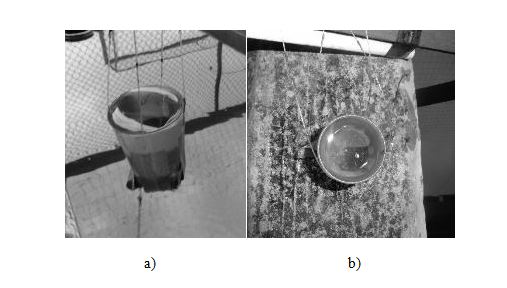
The necessary sediment traps for the experiment at the site had to meet the following characteristics: they should not alter the water flow, they must be easy to submerge and extract and must be stable. After reviewing different types of traps available in the market, and according to the characteristics stated, we concluded that they should be specially constructed for the study case. Henceforth, 1.5 oz capacity plastic containers were used and adapted to reach the bottom plate of each of the sand trap. As a counterweight, the bottom of the container was filled with sand and sealed with duct tape to avoid leaks. The development of the sediment traps contemplated some final tests in the experimental site to determine the sediment collection capacity and system stability (Fig. 3).
A laser diffraction analysis was carried out to determine the particle size distribution (PSD) of the sediments. This analysis was done with the Mastersizer 3000E in a range of 0.1 μm to 1,000 μm. The equipment measures the intensity of the light that is scattered when the laser beam passes through a sample of scattered particles 15. This information is analyzed to calculate the size of the particles that create the dispersion pattern and determine the percentage equivalent to the particle size to each sample.
For the determination of HM concentrations, a semi-qualitative analysis was carried out on each sample to determine the elements present by an Inductance Coupled Plasma (ICP) and then quantitatively analyzing the HM detected. Initially, we wanted to determine the presence of HM and their quantity, especially those that generate health hazards. Within this classification are Cadmium (Cd), Chromium (Cr), Copper (Cu), Nickel (Ni), Lead (Pb) and Zinc (Zn) 16. For sediments digestion, we applied the method established in the standard EPA 3051A.
We used the Total Organic Carbon (TOC) as an indicator of the presence of one of the chemical components of the organic matter in the sediment. The TOC is the sum of inorganic carbon which is derived from geological sources or from materials of soil and organic carbon which comes from the decomposition of plants and animals 17. For the analysis, the TOC-L equipment is used together with the solid sample combustion unit SSM-5000A of Shimadzu. The previously weighed dry sample is added to this equipment. The equipment uses the combustion oxidation method at 680 °C developed by Shimadzu for performing the reading 18.
To characterize the hydrological data, we used El Granizo rainfall station (PA - 036) of the EAB located at latitude 04°37'29" N and longitude 74°03'30" W. This station is located a few meters from the sampling point. Also, we used the weather station located at the School of Engineering's building in the PUJ. For campaigns 6 and 7 (Table 1), there was not enough data reported in any of the two stations consulted, so we discarded the corresponding data for the hydrological analysis.
We carried out the analysis of the precipitation data categorically, that is, assigning the following categories to the numerical values: low, medium and high. We selected the following variables from previous studies in which the quality of runoff water was related to hydrological characteristics 18,19,21,22): total height of precipitation (Htot), average intensity (Iprom) , Maximum intensity (Imax), dry time which corresponds to the number of dry days prior to rain during the 15-day period (tseco), rain time which corresponds to the number of days with rain during the 15-day period (tlluvia) and average intensity (Iprom-net) as reported in Table 2.
Table 2 Precipitation data for each campaign in numerical and categorical form. Htot: total precipitation height, Iprom: Average intensity, Imax: Maximum intensity, Tseco: Dry weather, Rainfall: Rainy weather, Ipromneta: Average intensity
| Campaign | Htot (mm) | Iprom (mm/día) | Imáx (mm) | Tseco (day) | tlluvia (day) | Ipromneta (mm/day) | ||||||
|---|---|---|---|---|---|---|---|---|---|---|---|---|
| 1 | 28 | Low | 2 | Low | 10 | Medium | 5.0 | Medium | 10 | Low | 3 | Low |
| 2 | 32 | High | 2 | Low | 10 | Medio | 6.0 | Medium | 9 | Low | 4 | High |
| 3 | 65 | High | 4 | High | 22 | High | 2.0 | Low | 13 | High | 5 | High |
| 4 | 46 | High | 3 | High | 12 | Medium | 3.0 | Low | 12 | High | 4 | High |
| 5 | 30 | Low | 2 | Low | 5 | Low | 3.0 | Low | 12 | High | 2 | Low |
| 8 | 44 | High | 4 | High | 24 | High | 9.0 | High | 6 | Low | 5 | High |
| 9 | 15 | Low | 1 | Low | 4 | Low | 11.0 | High | 4 | Low | 2 | Low |
To determine the main components of the parameters and to find relationships, we applied Multiple Correspondence Analysis (MCA) using the ade4 library 23 with R 24. The relationships explored were the following ones: between PSD and hydrology, and between HM concentrations, TOC, and hydrology.
The categorization of the PSD and quality data was done using the median values for the diameters, TOC and HM for each sample. We divided the values into two categories: High and Low, where Low corresponds to values lower or equal than the median and High the values higher than the median for each variable.
3. Results and discussion
The aim is to identify the relationship between the hydrological characteristics of the sector and the physical and chemical characteristics measured in the laboratory for the sediments collected in the sand traps of the CWST. For the results obtained during the experimentation, the Wilcoxon test is carried out per campaign to determine if there is a significant difference between the sediments collected by each sand trap.
Figure 4 shows the results of the PSD for the collected sediments, where is possible to identify a PSD variation between the samples analyzed.

According to the Wilcoxon Test for the median values of the PSD, a p-value = 0.16 was obtained between the comparison of the measured in the WST and the EST, so we can conclude that there is no significant difference in the PSD of the two sand traps. The above allows the analysis without the need to separate the samples spatially.
Different authors have analyzed the PSD of sediments taken in different zones, and they have found a wide variation in the diameters of the sediments measured, demonstrating that a standard of sediment diameters cannot yet be established. Most studies have been carried out in areas with vehicular traffic. One of them 25 reported the following variations for runoff samples taken at the edge of the pavement in eight different highways in North Carolina (USA): D10 between 9 µm and 31 µm, D50 between 32 µm and 167 µm, D90 between 72 µm and 594 µm. In the same way Monrabal et al.26 analysed the sediments in the roads of Trondheim city (Norway) showing average values for D10, D50 and D90 of 1.16 µm, 7.37 µm and 80 µm respectively. Additionally, Selbig 27 took samples in rainwater drainage systems for different areas, finding in a rainwater collector a median diameter (D50) of 8 µm, in a parking lot, a residential area and a mixed-use land the values of 32 µm, 80 µm, and 95 µm respectively for D50. For samples in sinks, Ma and Zhu 28 reported D10 less than 100 µm and between D25 and D60 diameters vary between 100 µm and 400 µm, while the particles with diameter higher than 400 µm represent the 40% to 70% of the total sample. On the other hand, Faram et al. 6 in a study conducted in Scotland, England, and Ireland in rainwater systems found values of D50 between 11 µm and 112 µm, in urban areas including parks and residential passages. According to the above, the median diameters (D50) of the analyzed sediments vary between 8 μm and 400 μm, range in which are the median diameters found in the present study, where the D50 varies between 48 μm and 241 μm with a median value of 128 μm.
We estimated the concentrations in mg/kg of Cr, Cu, Pb and Zn measured by ICP, as well as the concentration of organic matter in mg/kg for the samples (Fig. 5).
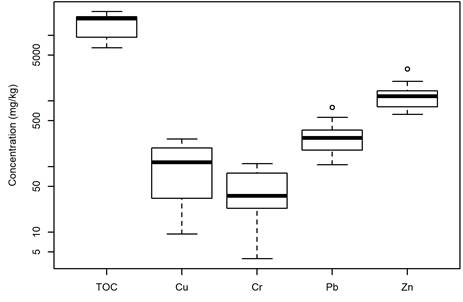
From the Wilcoxon test applied to the results in each sand trap, we obtained the following p-values: 0.3 for TOC, 0.01 for Cu, 0.25 for Cr, 0.06 for Pb and 0.1 for Zn. The previous indicates that, excepting for the Cu results, in general, it is possible to analyze the chemical characteristics of the sediments of both sand traps together.
To compare our results with those obtained in different parts of the world, we collected literature information of sediment concentrations measured in roads, natural wetlands, and rainwater collection systems, finding very variable concentrations among the studies as shown below. The variation of pollutants may be due to climatic, anthropogenic and morphometric variations 29. Karlsson et al. 30 conducted a study of HM concentrations (Cd, Cr, Cu, Ni, Pb, Zn) in a pond conceived for the removal of sediments in the rainwater basin in Gothenburg, Sweden, in 1998 and 2006. They found that there are no temporal variations of Cd, Ni, and Zn (mean concentrations around 2 mg/kg, 50 mg/kg, and 1200 mg/kg respectively), while for Cr, Cu and Pb the concentrations varied over time: Cu and Pb concentrations decreased by 100 mg/kg, whereas Cr ones increased by 80 mg/kg (mean concentrations in 2006: 140 mg/kg for Cr, 500 mg/kg for Cu and 120 mg/kg for Pb). Nasirian et al. 31 evaluated the sediments contents of HM in the bed of two wetlands in Iran; finding mean values of 30.36 μg/g, 19.12 μg/g, 9.07 μg/g and 28.30 μg/g for Cu, Cr, Pb and Zn respectively. Lu et al. 32 analyzed the sediments of a wetland in China to determine the presence of nutrients including TOC to determine possible eutrophication processes, finding TOC concentrations between 3.81 g/kg to 15.6 g/kg. HM concentration values found by the authors mentioned above and those found in the present research in most cases are not of the same order of magnitude. In the case of Cu, the concentrations measured in the roads and in the pond are about 2.5 times higher than those measured in the EST and 15 times higher than those found in the WST, which coincide with the values found in the natural wetlands of Iran. These differences could be due to differences in land uses and climatic conditions, especially concerning the precipitation.
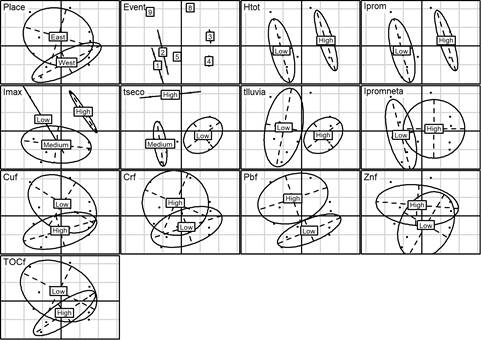
From MCA applied to physical and chemical characteristics measured (Fig. 6) we can conclude that the EST has higher values for D10, D20, D30 and D40 diameters (<100 μm) while the WST has higher values for D50, D60, D70, D80 diameters (between 100 μm and 450 μm). That is to say that the particles of the WST can be considered thicker. Regarding the concentrations, the EST presents higher concentrations for Pb and Cu, and in turn are related to the fine particles of the sample, i.e., those with a smaller diameter than 75 μm (D10, D20, and D30). These results agree with the study carried out by Gunawardana et al. 33 whose found that 60% of the metal concentration is contained in particles smaller than 150 μm and 40% is associated with the thickest particles. In the same way, highest TOC concentrations are associated with the smallest particles.
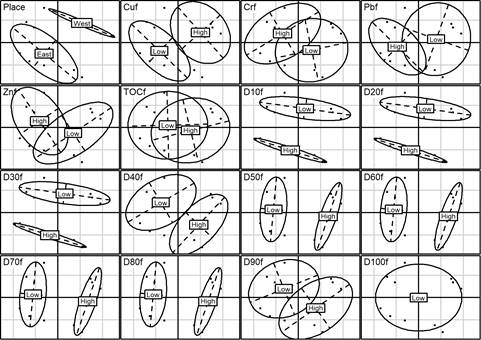
Figure 6 Analysis of granulometric variables and quality together categorically by MCA. "f" means categorical variable, i.e., Cuf means categories of copper concentrations
Additionally, we analyzed the variation of the physical and chemical characteristics considering precipitation characteristics. According to the studies carried out by Barreiro et al. 8 and Monrabal et al. 26, the size and quantity of metals present in the sediment vary according to the climatic conditions of the study site. For the analysis carried out in this study, the PSD data discriminated by sand trap was used as shown in Figure 7. We observe that there is an inverse relationship between Htot, Iprom, Imáx, Ipromneta and the diameters of the particles corresponding to D50, D60, D70 and D80 (150 μm to 400 μm). That is to say, the higher the height of the total precipitation or the higher the intensity of the rain, the smaller the diameters of the particles that will reach the sand traps. The variables Imax in the high and medium categories, tsec in the low and medium categories and Ipromneta in the high category have a relationship with the low values of D10, D20, and D30. That is to say that low values of these diameters have a relation with the high and medium values of the maximum intensity, the low and medium values of the dry time and the high values of the net average intensity. One possible explanation of these relationships could be that if there is more washing of the sediments from the surfaces because of runoff, the accumulation of sediments is limited, especially for the thicker grains.
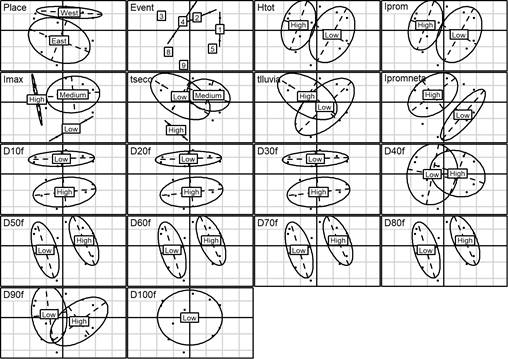
Figure 7 Analysis of rainfall and granulometric variables by MCA. "f" means categorical variable, i.e., D10f means categories of D10
According to the results obtained by Winston and Hunt 25 for sediments collected during 43 runoff events on asphalt roads, the median size of the sediments decreases with the increase of the rainfall duration, and in some occasions, they found a relationship between maximum precipitation and the maximum particle size.
Barreiro et al. 8 studied the relationship of Pb and Cu metals in road sediments, finding that there is a more significant accumulation of these metals in dry weather periods, while at the time of increased precipitation there is evidence of a metal removal produced by the surface runoff. Different authors have coincided with this behavior of pollutants in sediments, stating that the greater the dry period, the finer particles and the greater the pollutants' load 10. The above agrees with what we found in this work, where an analysis was carried out to determine the relationship between the quality of the sediments and the hydrology of the study site. Similarly, an analysis was carried out to determine the relationship between the quality of the sediments and the hydrology of the sector as shown in Figure 8. It is noticeable that higher values of the analyzed metals and low concentrations of TOC are present for high values of Tseco and Imax. The metals in sediments are related to higher periods of accumulation, especially for the sediments that have contact with vehicular traffic, mainly due to the wear of the tires.
4. Conclusions
The results obtained allow us to conclude that there are no significant differences in sediments' physical and chemical characteristics among the samples analyzed in the grit chambers of the constructed wetland. In consequence, it is possible to generate maintenance practices such as cleaning, collection and subsequent disposal of the sediments of both sand traps jointly. Additionally, we observed the following relationships between the variables analyzed. The chemical and physical analysis showed that the EST is the one with the highest amount of fine particles, and it has the higher Pb and Cu concentrations, which are associated with diameters smaller than 75 μm. This result agrees with other studies where the highest metal concentrations were found in particles below 150 μm 33. One possible explanation of these results is related to the vehicles that transit the area and its surroundings, taking into account that these metals come mostly from the wear of the tires, the brakes and the oils and lubricants used in the automotive industry 34. Consequently, the high concentrations of metals prevent the sediments from being arranged as material for activities related to agriculture since these generate intoxication in the plants and later in the whole food chain 35.
It was proven a relationship between the precipitation and sediments' physical characteristics, since the higher the rainfall intensity and total height, the smaller the coarse-grained particles that reach the sand trap: the sediments tend to be thinner and in turn have higher concentrations of metals. This parameter was also found in relation to metal concentrations, being higher for more days in dry weather, contrary to what happens with TOC concentrations, which tend to decrease these results in agreement with the studies made by other authors in road sediments 8,25. From the above it is necessary to emphasize that when there are summer seasons, concentrations of metals will increase in sediments, while those of TOC will be lower, decreasing the possibility of using sediments in activities such as gardening. So it is recommended to perform analysis of sediments in seasons in which there is a more considerable amount of rainfall.

