


 Inglés (pdf)
 Articulo en XML
 Referencias del artículo
 Enviar articulo por email
 Citado por SciELO
  Citado por Google
  Similares en
SciELO
Similares en
SciELO  Similares en Google
 Permalink
1. Introduction
The systems are an interconnection of components, devices or subsystems. In contexts ranging from signal processing and communications to electromechanical engines, automotive vehicles and chemical process plants, a system can be considered as a process in which the input signals are transformed by the system or cause it to respond in some way, which results in other signals as outputs 1.
A system can be defined as a set of elements linked by interaction or interdependence relationships. In the field of productive systems, these elements usually have a common goal. The systems can be classified into three general groups. The first is given by the relationship between the change of its variables over time: the static and dynamic systems; the second classification obeys to the nature of its components: deterministic and stochastic systems; and the third group for dependence over time: discrete and continuous systems 2.
SALI is a didactic environment design and assembled with Fischertechnik® technology at the New Granada Military University as a teaching and learning tool for engineering. These Fischertechnik® bricks allow a multitude of systems and 3D models to be created by slotting precision-engineered parts together and provide a hands-on approach to technology education 3. This construction, allows emulating the activities and functioning of a Logistic Distribution Center (DC) where the main four activities are 4:
SALI is an interconnection of six stations or subsystems that perform the previously mentioned activities; these are reception, classification, enlistment, transport system, AS/RS (Automated Storage and Retrieval System) and dispatch.
To be able of develop a continuous improvement of the systems, it is necessary to search tools that brought improving options for the systems and processes, that can be used both in the academic environment as well as in the productive one. By modeling the systems, it is possible to understand the specific behavior of the processes and activities that are executed within the system to obtain their result.
A model is a simplified representation of a system that will make it easier for us to explain, understand, change, preserve and, possibly, control its behavior. It can be the substitute of a specific physical system and must represent the knowledge that is had of a system so that it facilitates its interpretation, formalizing only the relevant factors to the objectives of the modeling 5.
Alvarado 6 presents a model as a mathematical abstraction of a system, which allows to replace it when studying the relationship between input and output signals.
It is understood that models are constructed through abstraction processes in order to facilitate the understanding of certain aspects of a given real system. In this way, part of the complexity of the real system is lost in the process of creating a model 7.
There are seven main steps to follow for the construction of the model 8:
Definition of the problem
Formulation of the preliminary model
Collection of empirical data
Calculation of parameters
Preliminary tests of the model
New tests of the model
Acceptance or modifying of the model.
Petri Nets, according to Murata 9, are a graphical and mathematical tool for system modeling. They serve to describe and study information-processing systems which main characteristic is being concurrent, asynchronous, distributed, parallel, non-deterministic and/or stochastic. Carl A. Petri created this method of study for dynamic systems of discrete events in his PhD thesis dedicated to communication between automats in 1962.
They allow an accurate visualization of discrete event systems and provide a graphic structure that enables the design of a model for the systems and their visualization through simulation with different configurations. A Petri Net is a particular kind of bipartite directed graphs populated by four type of objects. These objects are places, transitions, directed arcs and tokens 10.
This tool stand out in current engineering for the following qualities 11:
Capture precedence relationships and structural links of real systems
They are graphically expressive
Model conflicts and rows
They have a mathematical and practical foundation
Admit various relationships (Timed, colored, stochastic, reliability nets, etc.)
A net involves a broad mathematical theory that allows the analysis of the system's behavior, as well as different techniques for its optimization, such as the simplification of implicit places, the reduction of places, or the method of the source places. The analysis of a Petri Net usually consists of validation, verification and analysis of properties 12.
A large number of extensions of petri nets, termed high-level petri nets, have been proposed; among these, colored petri nets. In ordinary nets there is only one type of token, which do not allow differentiation of resources in one place, therefore, different places are necessary to express similar resources. Ordinary nets do not yet allow the model to be refined, so there is no an execution hierarchical order 13. Colored Petri Nets (CPN) are another powerful extension of standard Petri nets for coping with highly complex systems, where a group of structurally or functionally similar components are defined as a set of colors, each individual component is described and distinguished by one of the colors in the set 14. The graphical model becomes complex due to multiple parameter, such as parts. Each one will have its separate loop in the Petri net model wich not only exponentially increases the resultant elementary circuits but also the complexity of the graphical representation of the model. This graphical complexity has considerably been reduced by introducing the idea of colored tokens 15.
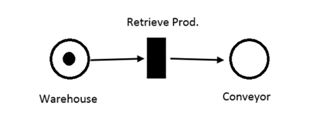
The basic elements that allow the definition of a Petri Net are polyvalent and largely can be freely interpreted. The places, represented by a circle, can be interpreted as a condition, a partial state, a wait, a set, a set of resources, a geographical position or a transport system. A transition, represented by a bar or rectangle, is associated with an event that occurs in the system. Finally, a token, presented by a dot in a place, indicates the condition associated with the place that is being verified 16.
In Figure 1, a breve example of a retrieval process is shown. The Warehouse and the conveyor are physical devices in the system, represented in the net as circles which are places; the retrieval process is the transition, represented as a rectangle; and a single product is been kept in the warehouse in the form of a dot that is a token.
2. Materials and methods
SALI works sequentially performing a purchase order that after being requested by a client start its processing in the system. The modeling of the system is going to be represented in to two individual models due to the behavior of the components that carries out different activities. The first model represents the carousel storage system loading activity, and the second model is the processing of a purchase order.
The first model has its first operation in the reception station, which is in charge of entering the products in the system in shapes of red, white and blue cylinders that are later on palletized and accommodated on the carousel storage system of the classification station. These two stations work independently from the other four, to ensure that the nine storage spaces, three for each color, are always properly stocked.
The second model has their operations form the moment in which a customer requests an order until its delivery. The first operation is a consolidation pallet entering the system, and then, the required products are requested to the classification station according to their color, to be later loaded by the delta robot of the enlistment station towards its position in the consolidation pallet that is on the conveyor. The next operation is taking the consolidated order towards the AS/RS where it awaits to be withdrawn for delivery at the dispatch station.
The objective of the model is to obtain a graphical representation of the SALI, where it can clearly be seen and understood the functioning of the components on the stations, the flow of material through the system, the transformation of the product and its status in each one of the representative places of the process, this, to be able to carry out a detailed analysis of the system identifying faults or possible points of improvement such as in the software programming, in the overall design of the system or in the activities execution order.
2.1 Colored Perti Net creating process
The CPN creating process will start after the analysis and recognition of the system, for which is necessary to make a close study of the activities of the system, the processes and the materials on it, as well as the overall functioning and precedence of the activities among the stations. To explain in detail the construction of a Colored Petri Net, the first model for fulfill the carousel storage system process will be made along.
⏺ Define the elements requiring color assignation
The first step is to identify the elements that require a color a color assignation. They represent the materials or products that are transported and transformed in the system; there are two types of pallets, on both its empty and full configuration, three types of products, and the default token necessary for the functioning of the state machines. This materials and products are going to be the tokens represented by dots on the colored Petri Net (Tabla 1).
Table 1 Token’s Color assignment, Author.
| Token name | Token color |
| Red product | Red |
| Blue product | Blue |
| White product | Grey |
| Empty pallet | Purple |
| Empty consolidation pallet | Violet |
| Red palletized product | Orange |
| Blue palletized product | Green |
| White palletized product | Yellow |
| Consolidated order | Pink |
| Default | Black |
⏺ Create the places that identify each device
The second step is to identify the places, that represent devices or components in the system that fulfill a representative function inside the process, whether be storage or transport. Represented by circles in the Petri Net they contain the tokens that move through the system.
⏺ Set up each place with capacity restrictions
For the third step, it is necessary to known each device capacity depending on its operation along the process, this capacity will represent the maximum amount of tokens that can be in one place at the same time and their specific color (Figure 2).
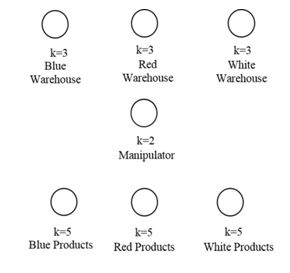
The places with the largest capacity are the warehouses or temporary storage devices, where product and pallets warehouses have a five tokens capacity, the red, blue and white warehouses have a three tokens capacity each, and the AS/RS have an eighteen tokens capacity. There’s also two special devices where the palletizing activity is carried out; for the first model is the manipulator with a two token capacity and for the second model is the conveyor section two, where the consolidate order is made and has a five token capacity. Finally, the ramps of the dispatch station have a two token capacity each. All the remaining places as well as the state machines have a one token capacity.
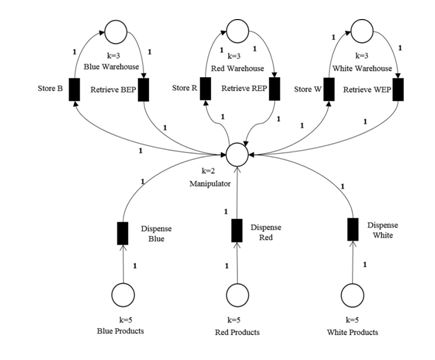
⏺ Define the transitions between places
The transitions, represented by black rectangles are the sub processes that are carried out between the places and where some materials or products change their state; in the CPN is where the tokens change their state by changing its color.
⏺ Create the arcs that connect the transitions with the places
In this step, all the places previously stablished are connected to the transitions to define the direction in which the tokens will move among the system. Each connection allows only one direction of movement (Figure 3).
⏺ Provide the weight to each arch according to the working conditions
The weight of each arch represents the amount of tokens that are allowed to pass through the arches towards transitions. For these models, the palletizing operation requires that two or more tokens merge into one, so on, the weight of the arch will depend of the type of order and will allow the pass of the desire amount of tokens.
At the end of the previous six steps, the graphic representation of the system is obtained, then, operating conditions such as the initial tokens in the warehouses and the state machines must be added. This are physically non-existent places in the system but that condition the activation of the transitions, for the automatic operation and the simulation of the process in the order of execution of the real system.
The first obtained model representing the loading of the carousel storage system (Figure 4.) (Figure 5) has an initial tokens configuration of three empty pallets in each color warehouse, five tokens in each color product warehouse and one token in the state manipulator machine.
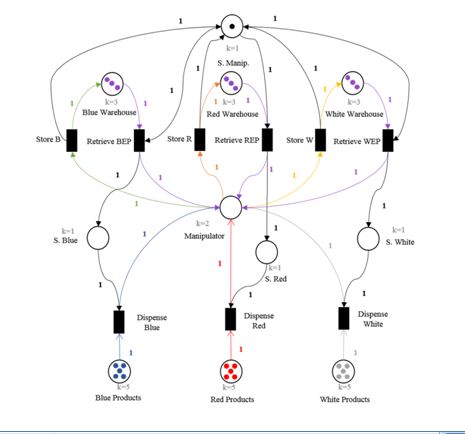
Figure 4 Colored Petri Ne for loading the carousel storage system process, Initial configuration, Author.
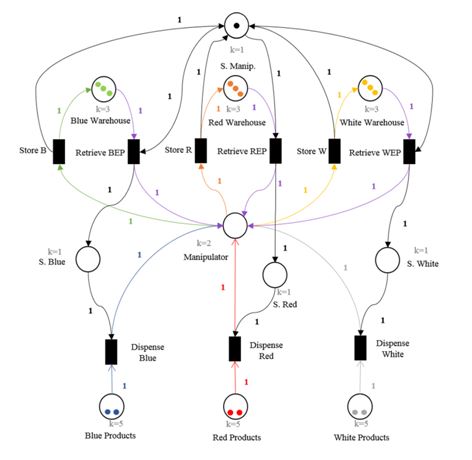
Figure 5 Colored Petri Net for loading the carousel storage system process, Final configuration, Author
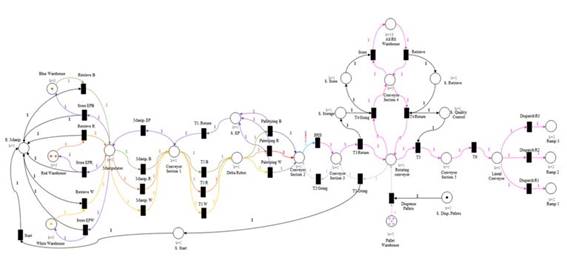
The second model (Figure 6) representing the processing of a 3,321 purchase order (meaning two red products and one both blue and withe products) have an initial tokens configuration of the requested products in each color warehouse, the empty consolidation pallets to be filled in the pallet warehouse and only one state machine to dispatch pallets with, with one token. The remaining places, including state machines, have a zero token initial configuration.
3. Results and Discussion
Through the analysis, of the first model and its software simulation is possible to obtain a clear identification of the critical device, which is the manipulator. Its activity among the process is extremely important for being the main device and the one that transport the products among the stations.
The second model analysis and simulation, allows identifying the transport system as the restrictive station of the process and both the conveyor section two and the rotating conveyor as critical devices. This station is connected with three other stations (Enlistment, AS / RS and dispatch) and is the largest one in the system, as well as having the most representative amount of places in the SALI CPN.
With the CPN second obtained model, is also clearly seen the flow of materials among the devices, where, in order to complete the palletizing process, a huge amount of resources is required, as well as making a loop kind of process instead of a flow one, because when a palletized product is took from the color warehouses for making an order, an empty pallet must came back for the product being replaced after, and meanwhile the process this operation is repeated as many times as needed for the enlistment of a purchase order. Once the order is ready it clearly have a flow kind processing where only the pass through the rotating conveyor is repeated, and only to connect the transport system with the AS/RS and the dispatch station.
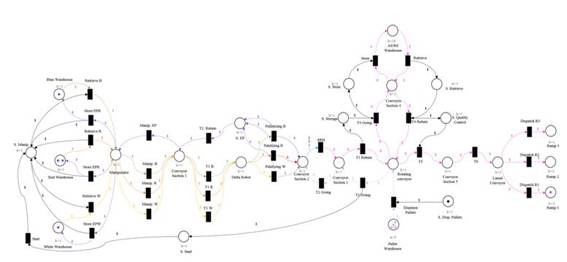
Figure 7 presents the second CPN model after the processing of a purchase order; it will have a final tokens configuration of four empty pallets on each color warehouse, four empty consolidation pallets on the pallet warehouse and the consolidated order on the first ramp of the dispatch station.
For a new order processing, it is necessary to restart the initial conditions of the model including, if is type of order different from 3,321, modify the amount of products on the warehouses and the weight of the arch that leads to the same named transition. So on, this model allows to process all type of orders from one till four products depending on clients request, according to the real SALI procedures, and represent an accurate representation of the system, being a digitalized and graphic form of it, that allows to analyze the amount of places needed for the actual process and if they will be longer need in a further configuration of it that will be considered having in mind the loop kind of process identified as a result.
4. Conclusiones
Colored Petri Nets are an efficient tool for modeling automated systems and obtaining graphical representations that allows making a detailed analysis of a production system or a process to establish critical points in the operation or points of improvement within the system. With these models, it was allowed to identify the transport system as the restrictive station of the process and both the conveyor section two of the enlistment station and the rotating conveyor of the transport system as critical devices, for their importance in the process.
The rotating conveyor is a multitasking element because it deliver the dispense the pallets into the transport system and carries the products in three different directions, toward the enlistment station, from or to the AS/RS to be stored or retrieved, and to be sent to the dispatch station and the conveyor section two is where the palletizing activity is made, the most important in the process that represents the greatest use of resources in the system. This activity also represent the biggest problem, making a loop process by having to return the empty pallets after the order preparation to its location on the carrousel storage system, because that conditions the process to a same repetitive activity several times.
These models are also going to be the theoretical base for a decision making process where an improvement has to be made on the design of the system and the overall plant distribution, in order to decrease the amount of activities carried out by the transport system and the loop processes, to be able to decrease the amount of non-value adding activities inside the purchasing order processing.
In terms of design of the stations, a valuable propose is increasing the amount of storage space in the classification station to be able to have a four of the same color products in an order, giving more variability and option choices for the costumer, because the actual design reduces it to only three of the same color products. Also in terms of design, in the transportation system, conveyor section 5 is an unused place that only extends the operation and process times, if it is not going to add value to the process a reducing or eliminating action must take place for this device.
At last, before the modeling of the system, it seemed to be a much more complex element but after the abstraction process that leads to the models, part of the complexity of the system was lost, giving specific points of improvement in all aspects desired in the objective of the investigation.

