


 English (pdf)
 Article in xml format
 Article references
 Send this article by e-mail
 Cited by SciELO
  Cited by Google
  Similars in
SciELO
Similars in
SciELO  Similars in Google
 Permalink
1. Introduction
In the last years (7.600 million people until 2017 1) have strongly influenced the natural dynamic equilibrium of ecosystems for the increase in agricultural production. Within the repercussions generated by this situation, the soil degradation has become evident, manifested in the disturbance of the natural hydrogeological cycle, the main water regulator. Therefore, this factor intensifies just like the climatic events the lack of water, making essential the development of research related to the study of soil hydrophysic properties that allow to comprehend the availability and behavior of water flow in this resource 2.
The analysis of water flow behavior in soil must consider the soil variability, the climatic diversity in the study area and the implemented systems for soil and crops management 3. This behavior estimated from the humidity retention curves, allows to determine the useful water reserve for a crop development, the depletion fraction and the net irrigation dose. However, the methodology commonly used in this estimation like the pressure plate apparatus, requires a considerable investment of time and economical resources. This situation has implied the pursuit of technological innovations that allow the studies about the capacity of water regulation in soil to be more efficient, there have been developed computational tools based on number methodologies, like Hydrus 2D, which facilitates the dynamic modeling of water flow from soil hydrophysical properties 4 allowing to generate the humidity retention curve in less time y with less money investments. In the case the estimations are adequate for the study soils, these can be used to calculate the available water content, that enable determine the optimal periods to realize agricultural labor.
The study realized by Carles Rubio 4 about the characterization of hydrodynamic properties, the humidity retention curve and the matrix potential modeling from the Hydrus 1D model, showed a delay in the hydrodynamics of middle mediterranean mountain soil in regard to the profile depth and humidity; it concluded that the model simulates in an acceptable way the water flow transmissions, tending to overestimate the matrix potentials and representing reasonably the hydric balance.
In 2010, Kandelous and Šimůnek 5, developed number simulations of wáter movement in an underground drip irrigation system in field and laboratory conditions using Hydrus 2D, obtaining the respective similarities between the modeling with laboratory data and field data in a clay loam soil.
On the other hand, the research made by Restrepo 6, about the dymanic of the physical and chemical properties related to the water regulation in an Andisol soil under an agroecological production system in the small urban land of Centella, Dagua, Valle del Cauca, through the implementation of Hydrus 1D program for the humidity retention curve, showed that the simulated values by the model and the values obtained in field and laboratory were successful in comparison to the modeling by Rosetta NRCS program.
For the interest in comprehending the water behavior in soils, this research determined the water regulation of a Typic Hapludands by two methodologies: Through the humidity retention curves obtained experimentally and through modeling by Hydrus 2D software from hydrophysic properties. The research was realized in cultivated soil with coffee-plantain and coffee-guamo associations, sugar cane and grass, in nine farms located in the micro watershed La Centella, in the high watershed of Dagua river, in Valle del Cauca national department.
2. Materials and methods
2.1 Study zone
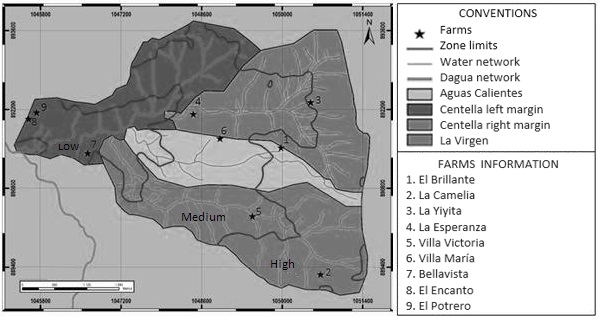
The research was carried out in the micro watershed Centerra (Figure 1), located in the high zone of the Dagua river watershed, west Valle del Cauca, in the Colombian Pacific Center with 3º38´45” North Latitude and 76º41´30” West Longitude. The micro watershed counts with an area of 1,814.1 ha, with average temperature of 20° C, average annual rainfall of 2,000 mm. Its main drainage network subdivides in three slopes: Centella, Aguas Calientes and La Virgen; which flow into the Dagua river 7. It is characterized for having a relief moderately uneven to moderately steep, with slight erosion, uneven and short gradients. Geomorphologically located on the hills in the mountain landscape, with altitudes between 1,050 msnm and 1,700 msnm approximately, with taxonomic classification of the soils belonging to Typic Hapludands 8.
The main crops presented in the micro watershed Centella are coffee (Coffea), plantain (Musa sp), coffee-plantain association (Coffea - Musa sp Association), bean (Phaseolus vulgaris) and sugar cane (Saccharum officinarum) 7.
2.2 Selection and description of study farms
Nine farms were studied (Table 1) distributed along the three slopes of the micro watershed Centella, defining as selection criteria the soil taxonomy, changes in the field elevation that divided the micro watershed in three zones: high, medium and low and the established crops of coffee-plantain and coffee-guamo associations, sugar cane and grass for livestock.
Table 1 Farms information
| Farm | Zone | Crop | Area (ha) | Coordinates | Altitude (m.s.n.m) | |
|---|---|---|---|---|---|---|
| Latitude | Longitude | |||||
| El Brillante | High | Shade-grown coffee | 1.5 | 3°36'54.3"N | 76°37'39.5"O | 1,517 |
| La Camelia | Sugar cane | 6 | 3°35'43.5" N | 76°37'16.6" O | 1,563 | |
| La Yiyita | Grass | 1 | 3°37'20.6"N | 76°37'22.8"O | 1,520 | |
| La Esperanza | Medium | Shade-grown coffee | 2 | 3°37'14.3" N | 76°38'25.8" O | 1,382 |
| Villa Victoria | Sugar cane | 1.5 | 3°36'12.5" N | 76°37'54.6" O | 1,395 | |
| Villa María | Grass | 5 | 3°36'59.7" N | 76°38'13.9" O | 1,436 | |
| Bellavista | Low | Shade-grown coffee | 2 | 3°36'48.5" N | 76°39'23.0" O | 1,260 |
| El Encanto | Sugar cane | 2 | 3°37'11.6"N | 76°40'07.4"O | 1,164 | |
| El Potrero | Grass | 1 | 3°37'14.7"N | 76°40'02.4"O | 1,205 | |
2.3 Determination of soil hydrophysical properties
The experimental design allowed to obtain 36 samples, two per farm, between altered and non-altered at two depths of 0 - 10 cm and 10-20 cm. The extracted samples were analyzed in the Water and Agricultural Soils Laboratory (LASA) of the Universidad del Valle with the methods presented in the Table 2.
Table 2 Methods for the hydrophysical properties determination
| Properties | Methods | Source |
|---|---|---|
| Texture | Bouyoucos’ hidrometer (with organic matter oxidation) | (9) |
| Apparent density | Beveled cylinder | (9) |
| Porosity | Tension table | (10) |
| Humidities | 0 and 0.33 Bar: Beveled cylinder | (9) |
| 3, 7, 10 and 15 Bar: Pressure plate | ||
| Hydraulic conductivity | Porchet’s method | (11) |
| Infiltration | Infiltrometer rings | (9) |
| Organic matter | Walkley - Black colorimetric method | (9) |
| Field capacity | On field |
2.4 Experimental estimation of the humidity retention curves
The humidity retention curves were estimated once the laboratory work finished, based on the study farms soil samples, using the beveled cylinder and the pressure plate corresponding to the pressures of 0, 0.33, 3, 7, 10 and 15 Bar. Then, the tabulation of humidity contents versus the pressures, represented in a curve through a spreadsheet.
2.5 Hydrus 2D estimation of the humidity retention curves
The humidity retention curves were estimated from the hydrophysical properties using the Hydrus 2D software, applying the Van Genuchten (VG), Brooks and Corey (B-C), Van Genuchten modified (VGM) and Kosugi (K) hydraulic models that involve two variable entrance options: The determined soils catalogue considering the textural class and the Rosetta module that allows to predict hydraulic parameters of the soil using pedotransfer functions (PTF) associated to the soil texture distribution (% Sand, % Silt and % Clay), the apparent density and two water retention point corresponding to 0.33 Bar and 15 Bar 12. The models results were compared through the medium error and the cuadratic mean error square root (RMSE) considering the two sampling depths.
Software Hydrus 2D individual licenced, is a finite elements model to simulate the water flow through porous mediums partially saturated, resolves numerically the Richard’s equation 13.
The equation (Eq.1) that rules the flow in porous mediums non-saturated in two dimensions, considering the movement of the air does not produce a noticeable effect in the water movement 14 will be:
Where:
θ: Volumetric water content [L3/L3]
h: Pressure altitude (L)
𝑥𝑖: Spatial coordinates (i=1,2) (L)
t : Time (T)
Z: Vertical coordinate
K =: Non-saturated hydraulic conductivity (L/T).
This equation is not lineal and for its solution the definition of the soil hydraulic functions is needed.
2.6 Verification of the correlation degree in the obtained data
The hydraulic model used in the humidity retention curves determination was compared with the obtained data in laboratory, through the medium error (ME), the cuadratic mean error square root (RMSE), the Pearson’s correlation coefficient (r) and the Lin concordance correlation coefficient.
3. Results and discussion
The results of the hydrophysic properties determined in the studied farms are presented in the Table 3.
Table 3 Farm hydrophysical properties
| Farm | Crop | Depth (cm) | Sand (%) | Clay (%) | Silt (%) | Textural class | OM (%) | AD (g/cm3) | P (%) | mp (%) | Mp (%) |
|---|---|---|---|---|---|---|---|---|---|---|---|
| El Brillante | Shade-grown coffee | 0 - 10 | 55.00 | 14.10 | 30.90 | Sandy loam | 10.51 | 0.69 | 65.29 | 43.70 | 21.59 |
| 10 - 20 | 49.00 | 12.10 | 38.90 | Loam | 9.82 | 0.80 | 64.27 | 56.63 | 7.64 | ||
| La Camelia | Sugar cane | 0 - 10 | 38.40 | 41.60 | 20.00 | Clay | 5.75 | 1.09 | 59.59 | 45.02 | 14.57 |
| 10 - 20 | 48.40 | 31.60 | 20.00 | Sandy clay loam | 2.65 | 1.25 | 57.65 | 50.73 | 6.93 | ||
| La Yiyita | Grass | 0 - 10 | 22.00 | 47.00 | 31.00 | Clay | 6.87 | 0.98 | 57.55 | 47.77 | 9.78 |
| 10 - 20 | 24.00 | 51.00 | 25.00 | Clay | 5.21 | 1.08 | 56.84 | 44.51 | 12.32 | ||
| La Esperanza | Shade-grown coffee | 0 - 10 | 16.00 | 55.00 | 29.00 | Clay | 8.89 | 1.16 | 54.49 | 48.18 | 6.32 |
| 10 - 20 | 12.00 | 61.00 | 27.00 | Clay | 3.09 | 1.18 | 53.27 | 47.87 | 5.40 | ||
| Villa Victoria | Sugar cane | 0 - 10 | 28.00 | 38.00 | 34.00 | Clay loam | 2.41 | 1.23 | 55.51 | 49.10 | 6.42 |
| 10 - 20 | 36.00 | 31.30 | 32.70 | Clay loam | 1.47 | 1.32 | 51.34 | 48.28 | 3.06 | ||
| Villa María | Grass | 0 - 10 | 24.70 | 49.30 | 26.00 | Clay | 4.03 | 1.27 | 44.92 | 40.85 | 4.07 |
| 10 - 20 | 22.70 | 51.30 | 26.00 | Clay | 3.93 | 1.29 | 40.85 | 32.39 | 8.45 | ||
| Bellavista | Shade-grown coffee | 0 - 10 | 54.00 | 18.00 | 28.00 | Sandy loam | 8.94 | 0.98 | 58.16 | 45.63 | 12.53 |
| 10 - 20 | 50.70 | 13.30 | 36.00 | Sandy loam | 6.97 | 0.92 | 60.91 | 54.49 | 6.42 | ||
| El Encanto | Sugar cane | 0 - 10 | 26.00 | 51.00 | 23.00 | Clay | 7.22 | 1.26 | 52.76 | 46.45 | 6.32 |
| 10 - 20 | 28.00 | 51.00 | 21.00 | Clay | 4.08 | 1.28 | 50.22 | 45.12 | 5.09 | ||
| El Potrero | Grass | 0 - 10 | 10.00 | 82.00 | 8.00 | Clay | 3.98 | 1.27 | 46.14 | 41.05 | 5.09 |
| 10 - 20 | 8.00 | 75.30 | 16.70 | Clay | 2.75 | 1.33 | 45.63 | 39.01 | 6.62 |
OM: Organic matter, AD: Apparent density, P: Porosity, mp: Micropores, Mp: Macropores
The soils with more sand percentage corresponded to La Camelia and Villa Victoria farms for the depth of 10 - 20 cm, whereas El Brillante and Bellavista farms for both depths, which implies low retention capacity and water availability, excessive airing and high drainage 15. Furthermore, the farm soils with the most clay content were La Camelia and Villa Victoria for the depth of 0 - 10 cm, whereas La Esperanza, La Yiyita, El Encanto, El Potrero and Villa María for both depths, expecting that their soils tend to retain more water and organic matter, and to present an insufficient drainage 15. Considering the climatic characteristics of the study zone already mentioned, and the reference values for the organic matter (OM) established by Castro and Gómez 16, the OM values found in the soils of study varied from high (more than 5%) to medium (3% to 5%), these values are considered normal for the Andisols in Valle del Cauca, resulting from the presence of allophones which form organic-mineral complex that limit its degradation and allow to increase the water absorption capacity 17,18. The OM presented variability and dependence on the type of plant cover 19. The cultivated soils with the coffee - plantain and coffee - guamo associations, presented the highest OM content in both depths (Table 3), which is related with high porosity values and low apparent density (AP), due to the constant organic waste deposition of the shadow-grown guamo and/or plantain. These values are similar to the obtained by Cardona 20; Paz and Sánchez, 21; Hincapié, 18; Hincapié and Tobón 22 in shadow-grown coffee. On the other hand, the lowest OM content and porosity were presented in the sugar cane and grass soils, this can be a reflection of the depletion processes attributed to the constant periods of grazing 23. However, the textural condition of the soils (high clay contents), gives them the susceptibility to present a density increase if the applied practices are not the adequate for an intensive pasturing system.
The crop management practices also have an effect on the previous properties, the high OM values and the low AD values can be related to the sowing of associated crops, the no removal of vegetal wastes and the mycorrhyza application, which mitigates the soil loss for the land gradient effect. While the inverse behavior of these properties can be influenced by the elimination of vegetal waste, leaving the soil exposed in the crop.
According to the Table 4 values, the majority of farms presented a saturated hydraulic conductivity (Ksat) slightly low (0.864 - 8.64 m/day) except for the farm El Brillante which is low. Nonetheless, there was no evidence of the texture influence in this property behavior, since the values of the sandy-loam soils were not higher than the clay soils values. Equally, it was found those values are difficult to compare, due to the Mariotte bottle method measures the Ksat on the surface, using different water volumes and soil during the measurement, in comparison to other methods used in field.
Table 4 Saturated hydraulic conductivity and basic infiltration of the study farms.
| Farm | Ksat (m/day) | BI (cm/hour) |
|---|---|---|
| El Brillante | 0.69 | 52.89 |
| La Camelia | 1.09 | 6.78 |
| La Yiyita | 0.98 | 0.79 |
| La Esperanza | 1.16 | 4.03 |
| Villa Victoria | 1.23 | 0.94 |
| Villa María | 1.27 | 0.69 |
| Bellavista | 0.98 | 27.99 |
| El Encanto | 1.26 | 0.63 |
| El Potrero | 1.27 | 5.60 |
Ksat: Saturated hydraulic conductivity, BI: Basic infiltration
The values of basic infiltration (BI) in El Brillante and Bellavista farms, considering the ranges reported by Montenegro 24 presented a fast infiltration velocity ( > 20 cm/hour), La Camelia, La Esperanza and El Potrero velocities were moderated to moderately fast ( 4.0 to 7.0 cm/hour) and La Yiyita, Villa Victoria, Villa María and El Encanto moderately slow (< 0.94 cm/hour). The farms cultivated with coffee - plantain and coffee - guamo association, presented most of the infiltrations, this allows to infer that these soils provide scenarios of higher water availability, unlike the sugar cane and grass soils.
The infiltration decline is related to the macropores decrease, resulting of the depth and the agricultural practices applied, which generate a severe reduction in water movement 25.
The volumetric water content (Table 5) obtained to saturation point (0 Bar) can be related to the OM contents and high porosity; similar results have been reported for Andisol soils 22,26. The El Brillante and Bellavista lands presented the highest values (58.16% to 65.29 %) in both depths, characterized by having established the association coffe - plantain and coffee - guamo, while the lowest humidity contents (40.85% to 46.14%) were presented in the grasslands of Villa Maria and El Potrero.
Table 5 Volumetric humidity values at different pressures and usable available water content.
| Farm | Depth (cm) | Volumetric Humidity | AWC (mm) | |||||
|---|---|---|---|---|---|---|---|---|
| Pressure (Bar) | ||||||||
| 0 | 0.33 | 3 | 7 | 10 | 15 | |||
| El Brillante | 0 - 10 | 65.29% | 43.70% | 27.72% | 26.18% | 24.41% | 23.70% | 20.00 |
| 10 - 20 | 64.27% | 56.63% | 31.40% | 30.10% | 27.69% | 25.49% | 31.14 | |
| La Camelia | 0 - 10 | 59.59% | 45.02% | 30.95% | 27.45% | 26.13% | 24.32% | 20.70 |
| 10 - 20 | 57.65% | 50.73% | 33.90% | 31.45% | 29.83% | 28.49% | 22.24 | |
| La Yiyita | 0 - 10 | 57.55% | 47.77% | 30.03% | 28.17% | 26.06% | 24.94% | 22.83 |
| 10 - 20 | 56.84% | 44.51% | 31.60% | 29.72% | 27.66% | 26.03% | 18.48 | |
| La Esperanza | 0 - 10 | 54.49% | 48.18% | 40.53% | 36.83% | 33.56% | 30.85% | 17.33 |
| 10 - 20 | 53.27% | 47.87% | 38.86% | 34.37% | 32.89% | 31.49% | 16.38 | |
| Villa Victoria | 0 - 10 | 55.51% | 49.10% | 34.61% | 30.52% | 28.20% | 25.69% | 23.41 |
| 10 - 20 | 51.34% | 48.28% | 35.71% | 31.17% | 27.76% | 20.10% | 28.18 | |
| Villa María | 0 - 10 | 44.92% | 40.85% | 39.03% | 35.96% | 34.15% | 33.00% | 7.85 |
| 10 - 20 | 40.85% | 32.39% | 39.90% | 34.86% | 32.29% | 29.41% | 2.98 | |
| Bellavista | 0 - 10 | 58.16% | 45.63% | 33.23% | 31.55% | 29.49% | 27.92% | 17.71 |
| 10 - 20 | 60.91% | 54.49% | 31.86% | 30.51% | 29.27% | 28.14% | 26.35 | |
| El Encanto | 0 - 10 | 52.76% | 46.45% | 37.65% | 34.21% | 31.05% | 28.28% | 18.17 |
| 10 - 20 | 50.22% | 45.12% | 33.56% | 31.57% | 28.39% | 27.13% | 17.99 | |
| El Potrero | 0 - 10 | 46.14% | 41.05% | 39.67% | 36.90% | 34.65% | 32.93% | 8.12 |
| 10 - 20 | 45.63% | 39.01% | 42.22% | 41.95% | 40.18% | 36.31% | 2.70 | |
AWC: available water content.
At 15 Bar high humidity contents were presented, increasing with depth, with a difference in the storage capacity from 0.21% to 5.59%. The highest humidity contents are showed in the lands of El Potreto, Villa María and La Esperanza, which present high percentages of loams and clays.
3.a Field capacity behavior
The farm soils with higher humidity value to field capacity (FC) (0.33 Bar), correspond to those presenting higher clay content, like La Camelia and Villa Victoria, followed by El Brillante and Bellavista with sandy-loam texture. This behavior is atypical in thick textures and can be related to the high OM contents and mostly, to the low apparent density values in these soils 27.
In general, there are differences in the humidity content at FC between the plant covers of study, being the farm soils with coffee - plantain and coffee - guamo associations the highest values of FC, followed by the soils cultivated with sugar cane and grass. These differences can be attributed to the fact that the guamo trees provide biomass that gives the soil the water regulation capacity under the coffee association, besides, it decreases temperature and water evaporation from soil. The farms with grass plant cover reported the lowest FC values at both depths, which can be related to highest apparent density values and low - medium OM content, influenced by the cattle trampling, and the lands being susceptible to superficial compaction, complicating water infiltration 27. For the sugar cane cultivated farms, it was found the FC values are adequate for the crop development.
3.b Available water content
The difference in the humidity contents between 0.33 and 15 Bar, reflects that the study soils have a great water retention capacity, which can be available for agricultural crops production. The largest usable available water content (AWC) have values between 17.33 to 23.41 mm for 0 - 10 cm depth and from 16.38 to 31.14 mm for 10 - 20 cm depth, presenting the lowest values Villa María and El Potrero farms (< 8.12 mm), as a consequence of the applied practices in pasture.
3.1 Humidity retention curves estimation in Hydrus 2D
According to the Table 6, the Van Genuchten and Van Genuchten hydraulic model modified with the Rosetta method presented the lowest medium error (ME) for most of the farms at both evaluated depths, with a value no higher than -0.11 cm3/cm3. On the contrary, the models Van Genuchten, Van Genuchten modified, Brooks and Corey and Kosugi for the soils catalogue present the highest values. The greatest water content underestimations are presented at the 10 - 20 cm depth, reaching values of -0.27 cm3/cm3 in Van Genuchten, Van Genuchten modified and Kosugi (with catalogue) and -0.22 cm3/cm3 in Brooks and Corey. The greatest dispersal were observed in the models Van Genuchten, Van Genuchten modified (with catalogue), Brooks and Corey and Kosugi for the soils catalogue with 0.28 cm3/cm3, 0.23 cm3/cm3 and 0.28 cm3/cm3 values, respectively. However, in the hydraulic models of Van Genuchten and Van Genuchten modified with Rosetta module a less dispersal no superior to 0.11 cm3/cm3 was presented. The obtained values in the ME and RMSE calculations for the hydraulic models that use the soils catalogue present the greatest underestimations and dispersals in comparison to the models of Van Genuchten and Van Genuchten modified with Rosetta module, since these involve each farm soil properties, generating a water retention model similar to the real conditions. Furthermore, Hincapie 18 reports that the Van Genuchten hydraulic model based on the soils catalogue appears to be limited for volcanic ashes-derived soils, since these present humidity values at saturations higher than 48.6 % (cm3/cm3), being these model obtained values not valid. In turn, Rubio 4 describes that the Brooks and Corey and Kosugi models present slightly acceptable values in the retention curve.
Table 6 Hydraulic models’ ME and RMSE values.
| ME (cm 3 /cm 3 ) | RMSE (cm3/cm3) | ||||||||
|---|---|---|---|---|---|---|---|---|---|
| Farm | Depth (cm) | VG- VGM | B-C | K | VG- VGM | B-C | K | ||
| Catalogue | Rosetta | Catalogue | Catalogue | Catalogue | Rosetta | Catalogue | Catalogue | ||
| El Brillante | 0 - 10 | -0.23 | -0.04 | -0.18 | -0.23 | 0.23 | 0.04 | 0.18 | 0.24 |
| 10 - 20 | -0.23 | -0.11 | -0.19 | -0.24 | 0.24 | 0.12 | 0.20 | 0.25 | |
| La Camelia | 0 - 10 | -0.05 | -0.07 | 0.03 | -0.04 | 0.10 | 0.07 | 0.13 | 0.10 |
| 10 - 20 | -0.22 | -0.10 | -0.18 | -0.22 | 0.22 | 0.11 | 0.18 | 0.23 | |
| La Yiyita | 0 - 10 | -0.05 | -0.07 | 0.03 | -0.04 | 0.09 | 0.08 | 0.12 | 0.09 |
| 10 - 20 | -0.05 | -0.06 | -0.03 | -0.05 | 0.09 | 0.07 | 0.05 | 0.09 | |
| La Esperanza | 0 - 10 | -0.10 | -0.08 | -0.08 | -0.09 | 0.11 | 0.10 | 0.08 | 0.10 |
| 10 - 20 | -0.12 | -0.09 | -0.10 | -0.12 | 0.15 | 0.10 | 0.12 | 0.15 | |
| Villa Victoria | 0 - 10 | -0.15 | -0.09 | -0.16 | -0.15 | 0.16 | 0.10 | 0.16 | 0.16 |
| 10 - 20 | -0.14 | -0.09 | -0.14 | -0.14 | 0.15 | 0.11 | 0.15 | 0.15 | |
| Villa María | 0 - 10 | -0.07 | -0.06 | -0.05 | -0.07 | 0.07 | 0.08 | 0.06 | 0.07 |
| 10 - 20 | -0.07 | -0.06 | -0.05 | -0.06 | 0.07 | 0.08 | 0.06 | 0.07 | |
| Bellavista | 0 - 10 | -0.25 | -0.07 | -0.21 | -0.25 | 0.26 | 0.07 | 0.21 | 0.26 |
| 10 - 20 | -0.27 | -0.09 | -0.22 | -0.27 | 0.28 | 0.10 | 0.23 | 0.28 | |
| El Encanto | 0 - 10 | -0.07 | -0.08 | -0.05 | -0.07 | 0.09 | 0.09 | 0.06 | 0.09 |
| 10 - 20 | -0.05 | -0.06 | -0.03 | -0.05 | 0.07 | 0.08 | 0.04 | 0.07 | |
| El Potrero | 0 - 10 | -0.08 | -0.05 | -0.06 | -0.07 | 0.08 | 0.08 | 0.07 | 0.07 |
| 10 - 20 | -0.12 | -0.07 | -0.10 | -0.12 | 0.13 | 0.08 | 0.11 | 0.12 | |
VG-MVG: Van Genuchten and Van Genuchten modified, B-C: Brooks and Corey, K: Kosugi
Therefore, these models were used to continue the humidity retention behavior analysis in the selected farm soils, through the evaluation of the uncertainty obtained in the experimental data and Hydrus 2D data.
3.2 Comparison between the experimental and the Hydrus 2D humidity retention curves
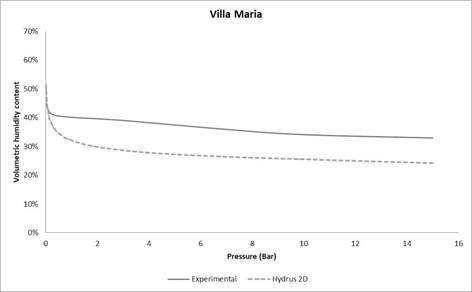
The Hydrus 2D retention curves obtained present underestimation for most of the humidity points in comparison to the experimental values obtained from the table 5. However, in the farms Villa María (Figure 2) and El Potrero (both depths), La Yiyita and La Esperanza (0 - 10 cm) and El Encanto (10 - 20 cm) was showed an overestimation in the saturation point. Although the values of the experimental and Hydrus 2D curves present variations between the farms, a similar behavior was noticed.
Between the 0.33 Bar and 4 Bar pressures it was observed that the curves of both methods show a pronounced slope change. However, the corresponding to Villa María and El Potrero (both depths) do not present this behavior from the saturation, since these soils have a smaller total porous space and a high apparent density, product of the applied agricultural labors. Subsequently, gradual changes in the humidity content were observed when the pressure increased. This result is similar to the research developed by Dirksen in 1991, which attributes to the characteristic properties of the Andisols related to high water retention capacity 18.
3.3 Correlation between the experimental and the Hydrus 2D humidity retention curves
The farms that presented overestimation in the saturation point (Table 7) were Villa María and El Potrero (both depths), La Yiyita and La Esperanza (0 - 10 cm) and El Encanto (10 - 20 cm), showing humidity differences from 0.05 to 0.08 cm3/ cm3, values that invert in the near FC zone.
Table 7 Study farms ME and RMSE values.
| Farm | Depth (cm) | ME (cm 3 /cm 3 ) | RMSE (cm 3 /cm 3 ) | |||||
|---|---|---|---|---|---|---|---|---|
| Pressure (Bar) | ||||||||
| 0 | 0.33 | 3 | 7 | 10 | 15 | |||
| El Brillante | 0 - 10 | -0.03 | -0.03 | -0.02 | -0.05 | -0.04 | -0.06 | 0.04 |
| 10 - 20 | -0.03 | -0.04 | -0.12 | -0.17 | -0.16 | -0.16 | 0.12 | |
| La Camelia | 0 - 10 | -0.04 | -0.04 | -0.08 | -0.09 | -0.09 | -0.09 | 0.07 |
| 10 - 20 | -0.05 | -0.05 | -0.09 | -0.13 | -0.13 | -0.15 | 0.11 | |
| La Yiyita | 0 - 10 | 0.02 | -0.04 | -0.07 | -0.10 | -0.10 | -0.11 | 0.08 |
| 10 - 20 | 0.00 | -0.04 | -0.07 | -0.09 | -0.08 | -0.09 | 0.07 | |
| La Esperanza | 0 - 10 | 0.02 | -0.05 | -0.12 | -0.13 | -0.11 | -0.11 | 0.10 |
| 10 - 20 | -0.10 | -0.13 | -0.09 | -0.08 | -0.08 | -0.09 | 0.10 | |
| Villa Victoria | 0 - 10 | -0.03 | -0.02 | -0.10 | -0.12 | -0.12 | -0.12 | 0.10 |
| 10 - 20 | -0.02 | -0.01 | -0.13 | -0.16 | -0.14 | -0.09 | 0.11 | |
| Villa María | 0 - 10 | 0.06 | -0.05 | -0.10 | -0.10 | -0.09 | -0.09 | 0.08 |
| 10 - 20 | 0.05 | -0.04 | -0.12 | -0.10 | -0.08 | -0.07 | 0.08 | |
| Bellavista | 0 - 10 | -0.01 | -0.06 | -0.07 | -0.09 | -0.09 | -0.09 | 0.07 |
| 10 - 20 | -0.02 | -0.04 | -0.08 | -0.12 | -0.12 | -0.14 | 0.10 | |
| El Encanto | 0 - 10 | 0.00 | -0.04 | -0.11 | -0.12 | -0.10 | -0.10 | 0.09 |
| 10 - 20 | 0.02 | -0.04 | -0.08 | -0.10 | -0.08 | -0.10 | 0.08 | |
| El Potrero | 0 - 10 | 0.08 | -0.03 | -0.10 | -0.10 | -0.08 | -0.08 | 0.08 |
| 10 - 20 | 0.01 | -0.05 | -0.09 | -0.11 | -0.10 | -0.08 | 0.08 | |
In the field capacity point was found the majority presented underestimation in the humidity content between -0.01 and -0.06 cm3/ cm3, except from La Esperanza (10-20 cm), which presented the greatest underestimation of 0.13 cm3/ cm3. For 3 Bar pressures between -0.02 and -0.13 cm3/ cm3, 7 Bar between -0.05 and -0.17 cm3/ cm3, 10 Bar between -0.04 and -0.16 cm3/ cm3 and between 0.06 and 0.16 cm3/ cm3 for permanent wilting point. The previous values are considerate slightly acceptable for being superior to 2.5% in accordance with Rajkai (1996) mentioned by Rubio 4.
The dispersal found in the humidity values is between 0.04 and 0.12 cm3/ cm3, whose values are high (>5%) indicating there are great errors in the prediction, which can be not only due to the estimation procedure by the Hydrus 2D software but also to the error that carries the application of an experimental method.
The humidity retention curves obtained with both methods were compared through the Pearson correlation coefficient and the Lin concordance coefficient (Table 8). In general, a Pearson coefficient of 0.96 (p<0.05) was found, indicating an elevated correlation degree, which can be result of its sensibility to opposite values, while the LIN coefficient of 0.80 corresponds to a poor concordance correlation.
Table 8 Pearson and Lin correlation coefficients.
| Correlation coefficient | |
| Pearson | 0.96 |
| Lin concordance | 0.80 |
Finally, according to the uncertainty analysis it is inferred that Hydrus 2D software presents humidity content values slightly acceptable, tending to an increasing underestimation as the pressures increase, for the study soil. This underestimation in the pressure range from 0 Bar to 0.33 Bar can be related to the particular physical and hydraulic properties of the Andisol soil like a low apparent density, high porosity and high organic matter content that increase the water retention capacity. However, at a 0.33 Bar pressure the program presents a better estimation, since the values are closer to the laboratory measurements. As the pressures increase, the humidity retention is less related to the structure and is more influenced by the clays texture and mineralogy, so they can be related to the greatest underestimations due to the high microporosity, characteristic of the volcanic ashes-derived soils and due to the high clay percentage that presents the largest specific area, allowing to form organic-mineral complex that increase the humidity retention.
4. Conclusions
The obtained results in this research show that the soils humidity retention capacity is high and is related to properties like texture, structure and organic matter content, the clay soils presenting the highest humidity followed by the sandy-loam soils.
The presence of a determined plant cover and the agricultural practices influence in the water regulation capacity, finding noticeable differences in the soils of study. The highest values are attributed to the coffee - plantain and coffee - guamo cover, with agricultural practices like associated crops sowing, no vegetal waste removal and mycorrhyza application.
The hydraulic models of Van Genuchten, Van Genuchten modified, Brooks and Corey and Kosugi based on the textural classification reference values, did not allow to estimate with a high acceptable adjustment degree the humidity content in soils presenting greater medium errors and dispersals. However, the estimations improved when the Van Genuchten and modified Van Genuchten models were applied, since these consider provided information like the soil texture distribution (% Sands, % Loams and % Clays), apparent density and two water retention points at 0.33 Bar and 15 Bar.
The humidity retention curves estimated by Hydrus 2D were slightly acceptable when being compared to the curves obtained in laboratory, presenting underestimations superior to 2.5% between the measured and estimated values. This behavior increased when distanced from the 0.33 Bar pressure, however in this point the less underestimations of volumetric humidity were presented. In addition, between the values obtained by the different methods a dispersal was presented (> 5 %) showing the presence of great estimation errors.
The correlation degree between the estimated and measured curves is high, however, the concordance reflects the humidity contents determined by both methods are not equivalent for the different pressures, presenting a poor coefficient, these results are related to the underestimations found in the study.

