


 English (pdf)
 Article in xml format
 Article references
 Send this article by e-mail
 Cited by SciELO
  Cited by Google
  Similars in
SciELO
Similars in
SciELO  Similars in Google
 Permalink
1. Introduction
Hydroclimatological changes associated with climatic variability and climate change, in addition to soil waterproofing in cities, have promoted the occurrence of urban floods. Colombia is a country where 90% of natural disasters are associated with hydrometeorological phenomena 1, a situation from which the department of Valle del Cauca, and its capital, the city of Cali, are not exempt.
In Santiago de Cali, 86.8% of natural disasters that occur within the urban perimeter are associated with floods 2. The effects of climate change in Cali are already a reality 3,4, being aggravated by the occurrence of the La Niña phenomenon, characterized by an increase in the amount and intensity of rainfall 5-7.
The east of Cali was initially designated for agricultural use, however between the 1960s and the 1990s; it was converted to urban land use, mainly due to the migration of people displaced by the intensification of the national armed conflict 8. This accelerated population growth, resulted in erratic planning of the urban management in this area of the city, which failed to allow for an orderly extension of the sewer networks, thereby making its operation, maintenance and operation complex.
In this context, the Storm Water Management Model (SWMM) 9,10 has been implemented to describe the response of the urban drainage system in the eastern sector of Cali, to the occurrence of maximum rainfall. Through hydrological simulation, different climatic scenarios have been evaluated, and in this way, potentially flood-prone points of the city have been idenjpgied. This represents a powerful tool for both planning mitigation measures, as well as for adapting to the challenges of climate variability and climate change.
2. Methodology
2.1 The Study Area
The Eastern Drainage Zone (EDZ) is an urban basin of 24.88 km2, located in the flat area of the Cauca River’s geographical valley, in the east of the city Santiago de Cali, Valle del Cauca, Colombia (Figure 1).
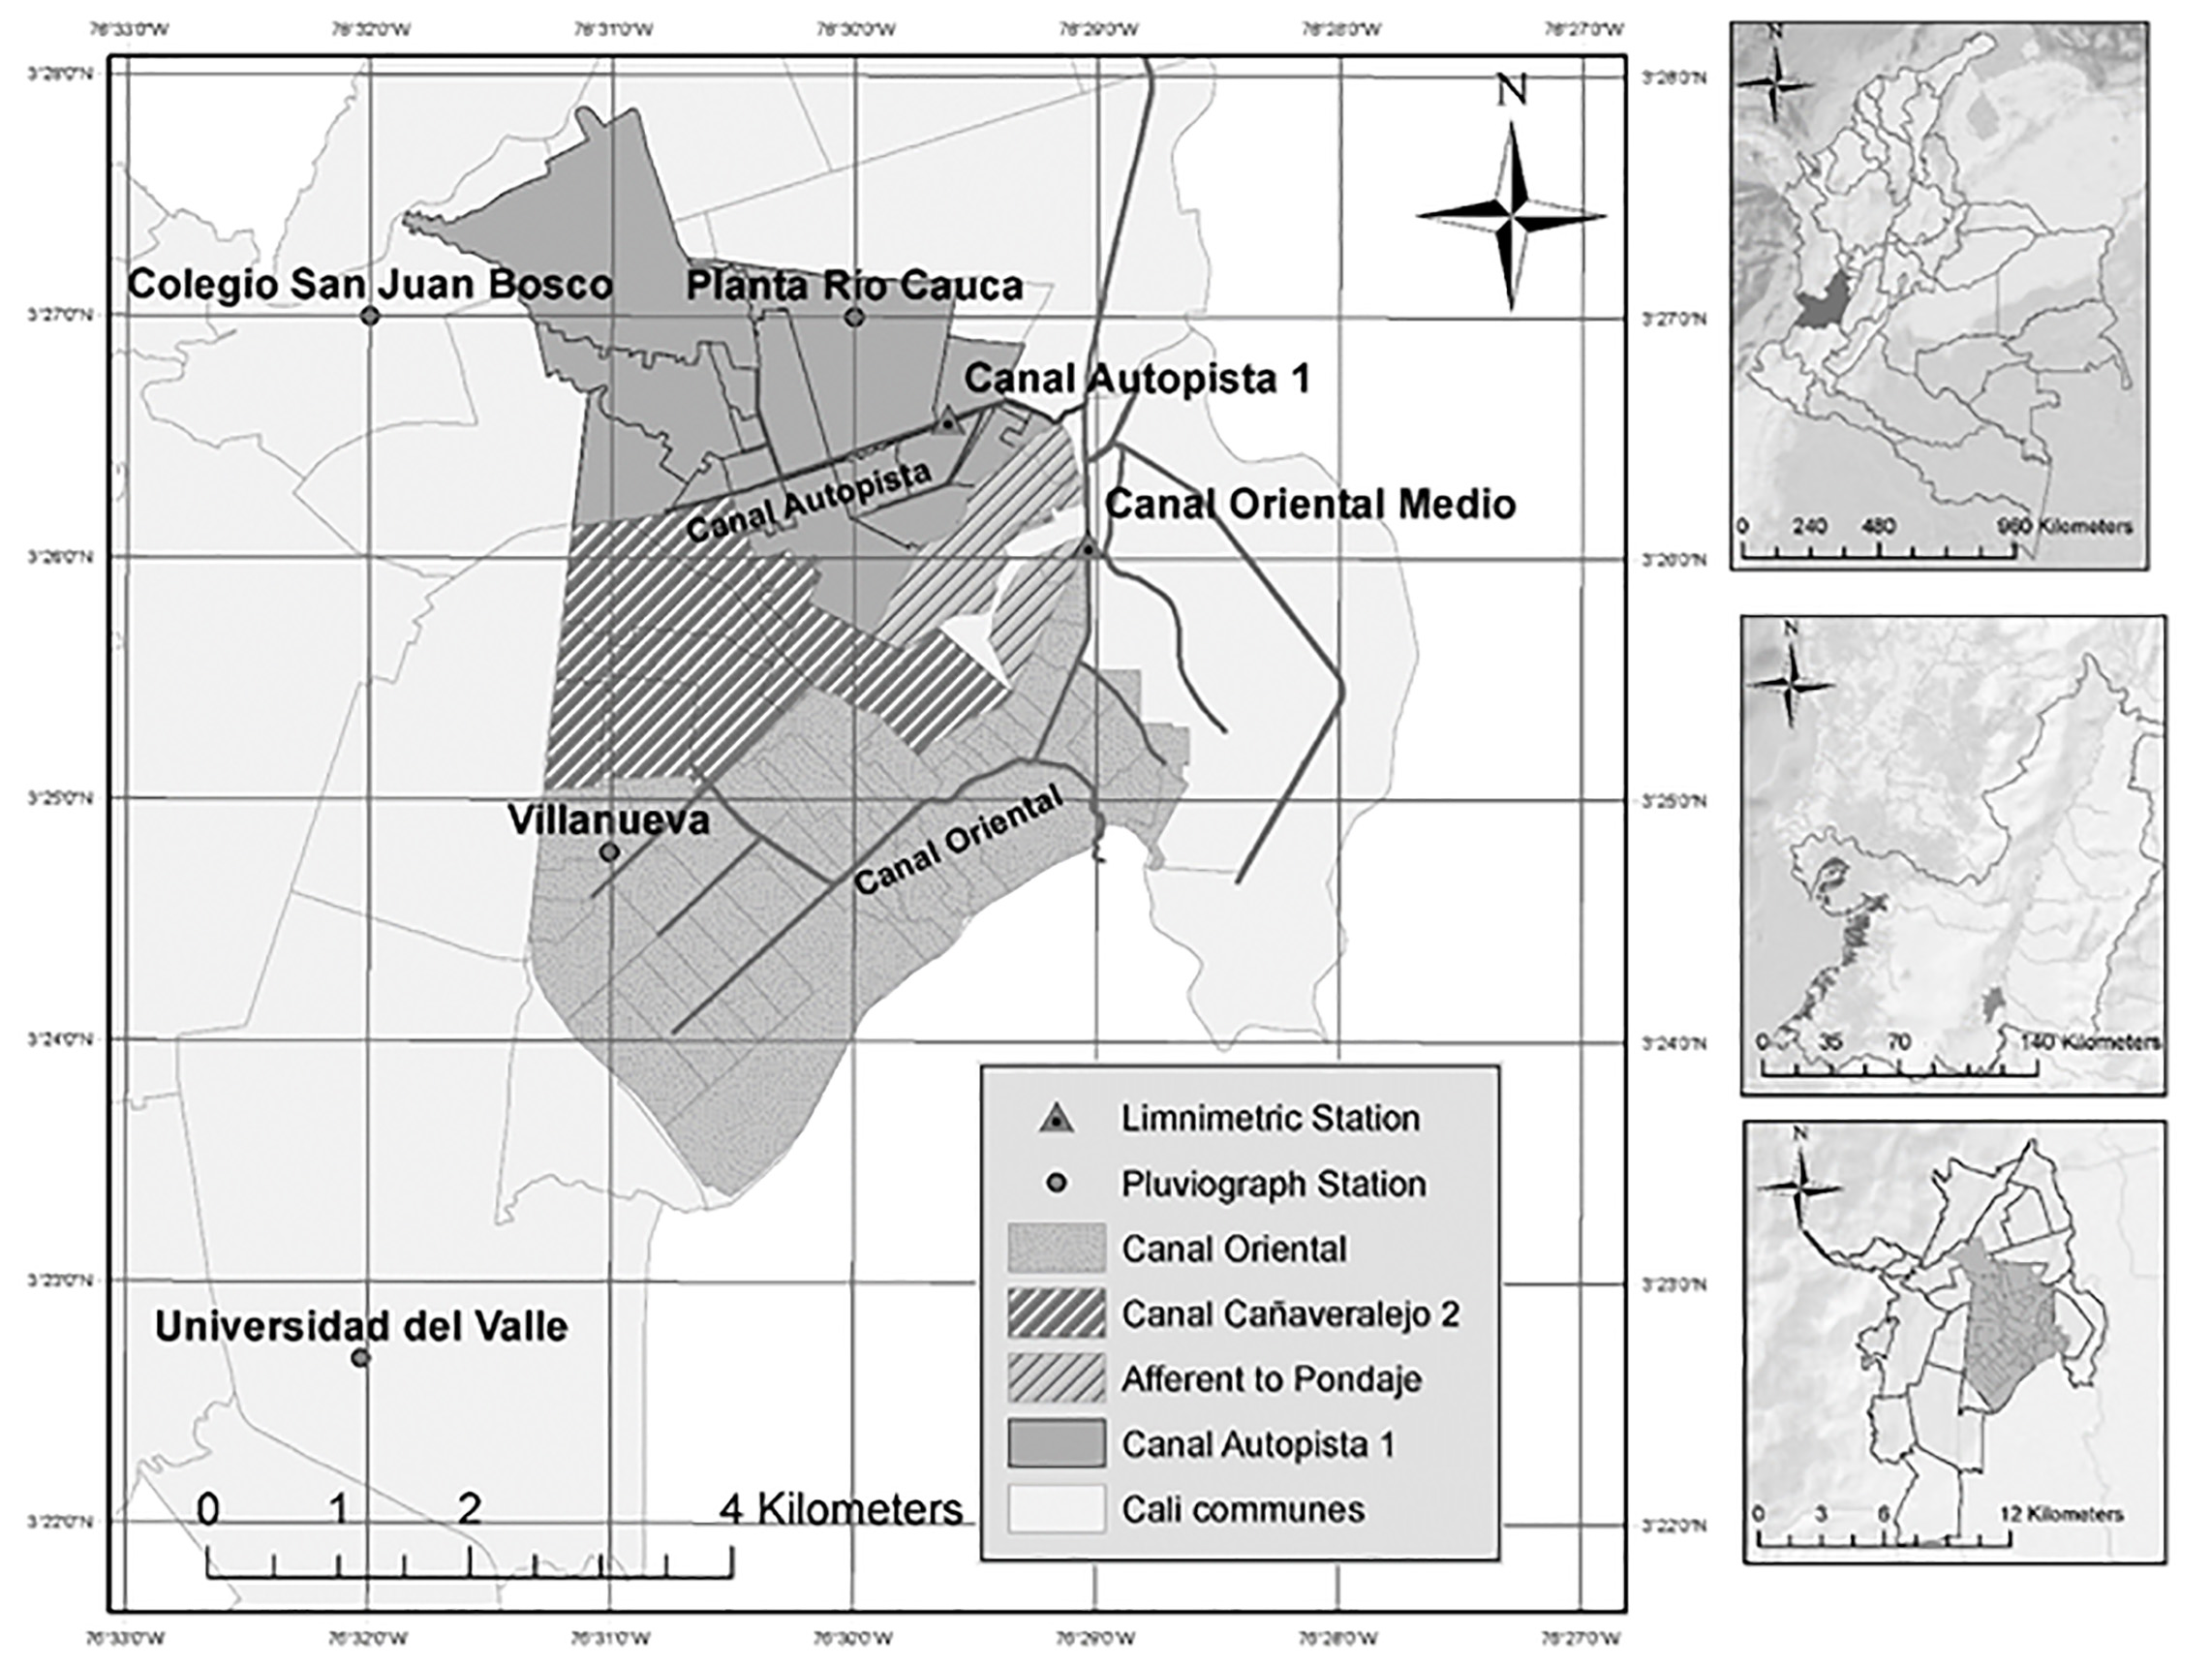
The basin has three main channels, the Canal Cañaveralejo 2, Autopista 1 and the Oriental Medio, of which the last two have a limnimetric record. Precipitation is recorded by the 4 stations shown in Figure 1.
90% of the basin is urbanized and waterproofed, and of the 24.88 Km2 of the EDZ, 56% corresponds to roofs, sidewalks and parking, 34% to asphalt pavement, and the remaining 10% to green areas. The EDZ is a flat basin, with an average inclination of 0.7%, where according to the Digital Elevation Model of the zone, surface drainage goes in the west-east direction.
The study area has two rainy periods in March-April-May and September-October-November, with April being the rainiest month (141 mm) and July the month with the least rainfall (45 mm), and an average annual rainfall of 1,084 mm, according to the rainfall record of the Planta Río Cauca station and confirmed by the studies 1,4,11. Precipitation events present extreme values influenced by the cold phase of the El Niño Southern Oscillation (ENSO) macro-climatic phenomenon, characterized by a significant increase in the intensity and amount of rain 1,5,7,11,14.
The probability distribution function that best adjusts to the maximum daily rainfall is the Log Pearson type III function, and its behavior is described by the Intensity-Duration-Frequency (IDF) curves 15 of the stations: Planta Río Cauca (PRC) (Eq.1), Colegio San Juan Bosco (CSJB) (Eq.2) and Universidad del Valle (UV), (Eq.3).
Where:
i: Intensity (mm/h)
Tr: Return time (years)
t: Rainfall duration (minutes)
A program that stands out for its worldwide application and acceptance is the SWMM 16-18. This is a dynamic simulation model which has the capacity to describe events of rainfall runoff and the flow transit in urban basins 10,18. This was the model selected to perform simulations of rainfall-runoff events in the EDZ.
2.2 Model of urban drainage
The collectors, inspection chambers, channels and other existing elements in the basin were schematized in the SWMM model from the cadastre of sewerage networks in Cali, updated by the Empresas Municipales de Cali [Municipal Companies of Cali] (EMCALI) in 2014.
To describe the free flow behavior in the network, we used the Dynamic Wave approximation based on the Saint Venant equations 19, because it does not neglect the inertial and flow pressure terms 20,21, the last term is important in urban basins, given that during the occurrence of maximum rainfall, it is common for networks to work under pressure.
The sub-areas within the basin were defined based on the schematization and flow directions in the sewerage network, furthermore it was possible to detail the characteristics of land use in the study area, particularly the definition of permeable zones for the description of the infiltration processes 17, thereby introducing spatial variability to the model.
To simulate the process of infiltration in the basin, the percentage of permeable area based on Google Earth satellite imagery was defined. For the EDZ, these zones correspond mainly to parks, green zones and those areas which have not as yet been urbanized. To these permeable zones, the infiltration model developed by Horton 22 was applied. For the values of maximum and minimum infiltration, values were assumed based on the infiltration rates reported in 23, they were later adjusted as part of the model calibration process.
The calibration period included the events from January 2016 to January 2017; for validation, the records from March 2017 were used. For both processes, there were hourly records of precipitation from the stations: Planta Río Cauca and Villanueva, and level records from the limnigraphic stations: Canal Oriental Medio and Canal Autopista from January 2016 to June 2017.
To evaluate the difference between the observed runoff and that predicted by the model, the Nash-Sutcliffe index efficiency criterion was used 24, which determines the relative magnitude of the residual variance compared to the variance of the measured data, the optimal value is 1.0 and the values must be greater than 0.0 to indicate the "minimum acceptable".
2.3 Design storm used in hydraulic evaluation
Based on the frequency analysis of the daily maximum precipitation data series from the PRC, CSJB and UV stations for the period 1965-2011, the magnitude of the design storms was determined. The behavior of the design storms is that described by the IDF curves (Equations 1, 2 and 3). A rainfall duration time equal to the concentration time of the basin was used, calculated as recommended by the Sewer Design Regulations of the urban area of Cali 25; and 2-year return times were used as a complementary function (free transit of vehicles) 26,27, and a return time of 10 years as a basic function (protection of goods and people) for urban drainage structures 28.
For the hydraulic evaluation of the drainage system in the face of future precipitation scenarios, the maximum daily rainfall series was extended with the support of the software RClimDex, and the Rx1day index was calculated; the maximum amount of rainfall in one day. From these trend analyses, there was an annual increase of daily rainfall with which the design storms were built for 2030 and 2040, this methodology was chosen because of the positive results found in several studies 29-31. It was not possible to compare these projections of daily maximum rainfall with those made internationally by the Intergovernmental Panel of Experts on Climate Change - IPCC 32, national projections made by the Instituto de Hidrología, Meteorología y Estudios Ambientales [Institute of Hydrology, Meteorology and Environmental Studies] - IDEAM 33 or local projections for the city of Cali made by the Corporación Autónoma Regional del Valle del Cauca [Regional Autonomous Corporation] - CVC 34 for the annual scale of the projections made in these studies.
2.4 Evaluation of the hydraulic functioning of the drainage system
From the calibrated model, simulations were carried out introducing the hietograms corresponding to a return time of 2 and 10 years to evaluate the hydraulic functioning of the current system. The extrapolation of precipitation for the years 2030 and 2040 was also done in the same way. From these simulations, the following aspects were idenjpgied: critical points in the drainage system, inspection chambers where backflow occurs, and the prioritization of flood points and flood volumes for possible intervention.
3. Results and Discussion
3.1 Representativeness of the model
In the Eastern Drainage Zone (EDZ) three main sub-basins were idenjpgied: (i) Canal Oriental with 12.29 Km2, (ii) Canal Autopista 1 with 7.57 Km2, (iii) Canal Cañaveralejo 2 with 3.83 Km2 (Figure 1). Canal Autopista 1 and Canal Oriental have limnigraphic measurements, and it was possible to calibrate and validate both sub-basins. From the events used in the calibration, the values of the Nash-Sutcliffe index shown in Table 1 were obtained. Figure 2 and 3 show the actual and simulated precipitation level for the period September 30 and October 2, in Canal Autopista and Canal Oriental respectively.
Table 1 Efficiency indices for the three highest rainfall events
| Event | Canal Oriental | Canal Autopista |
|---|---|---|
| 10/may/2016 | 0.60 | 0.64 |
| 26/may/2016 | 0.54 | 0.61 |
| 02/oct/2016 | 0.87 | 0.51 |
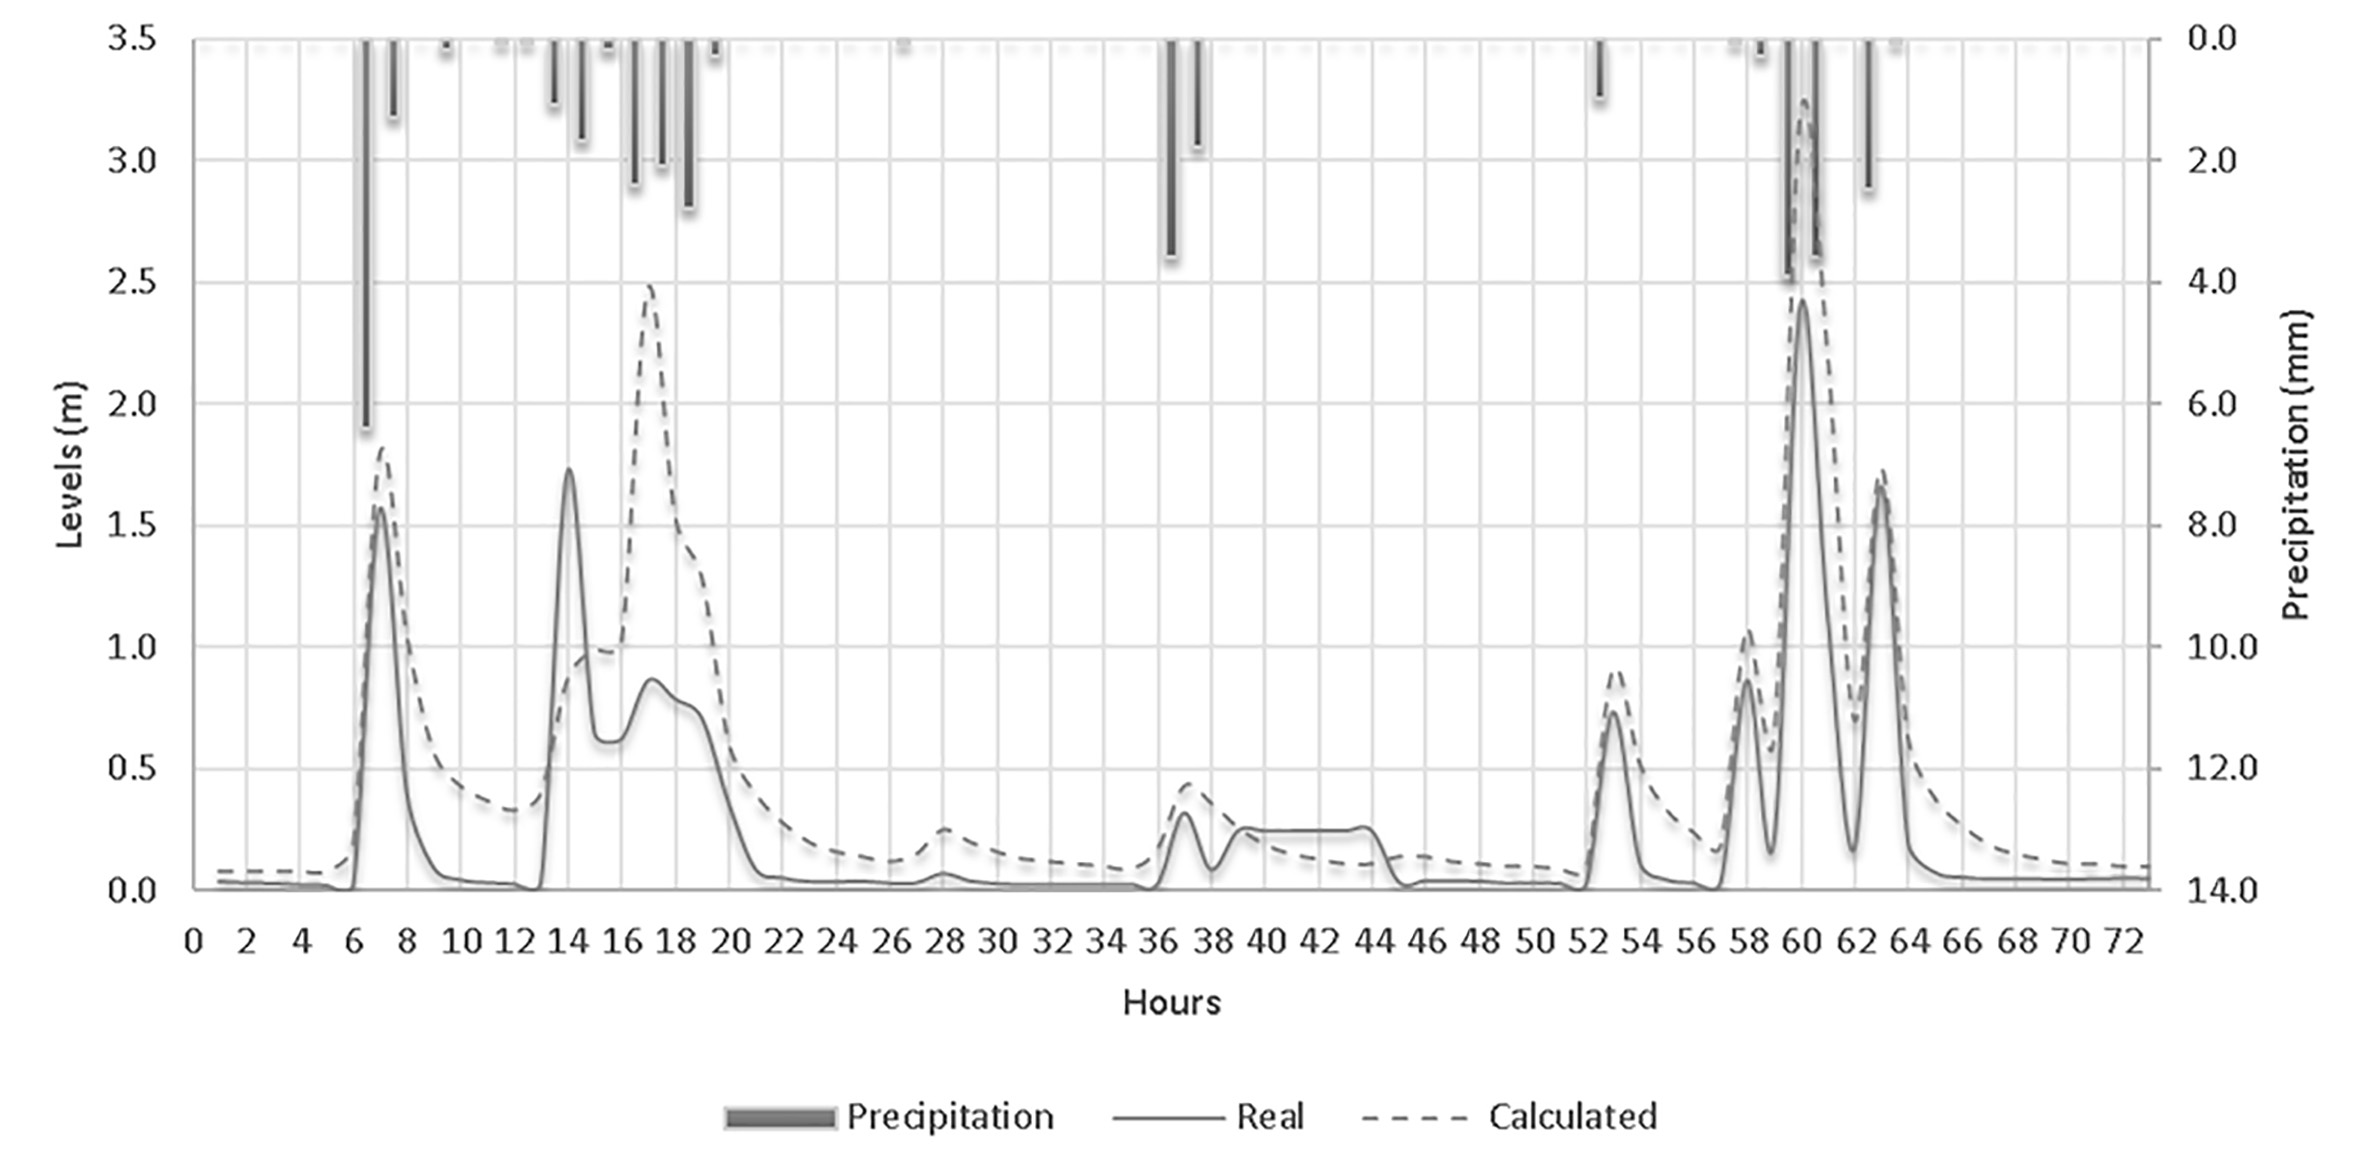
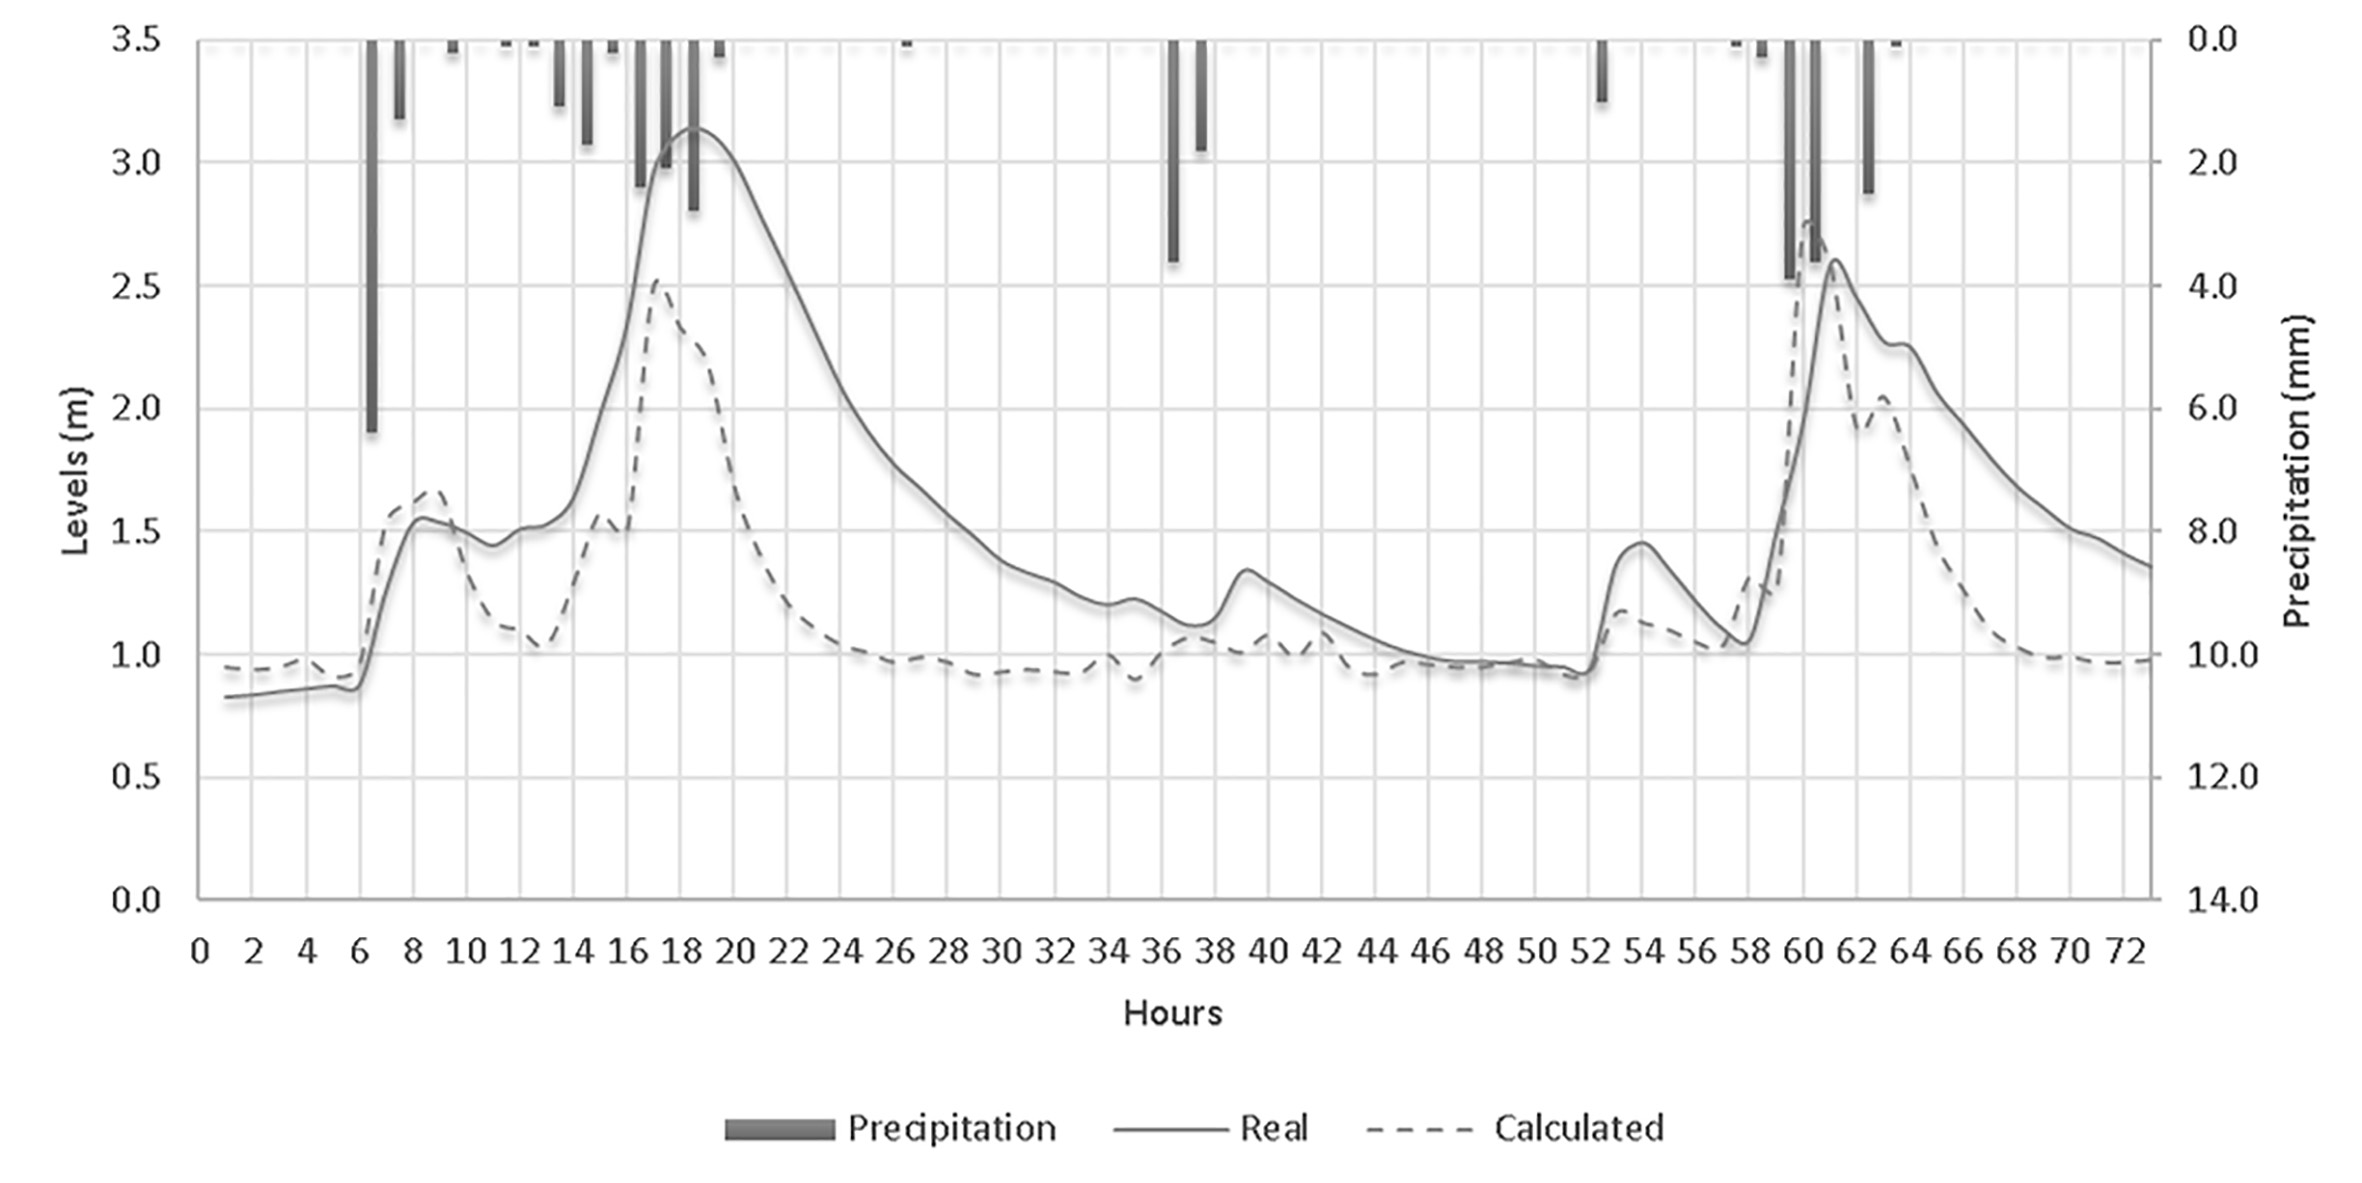
The calibration of the two channels is considered acceptable, although a greater spatial coverage and better distribution of pluviographic and limnimetric stations throughout the EDZ, would further facilitate understanding of the hydrological regimes in those areas, and the calibration-validation would shift the Nash-Sutcliffe numbers closer to 1.
3.2 Simulation scenarios of maximum rainfall
The analysis of maximum daily rainfall indicates a positive trend, as represented by the black continuous line (Figure 4), whereby the slope indicates the magnitude of the increase in mm / year.
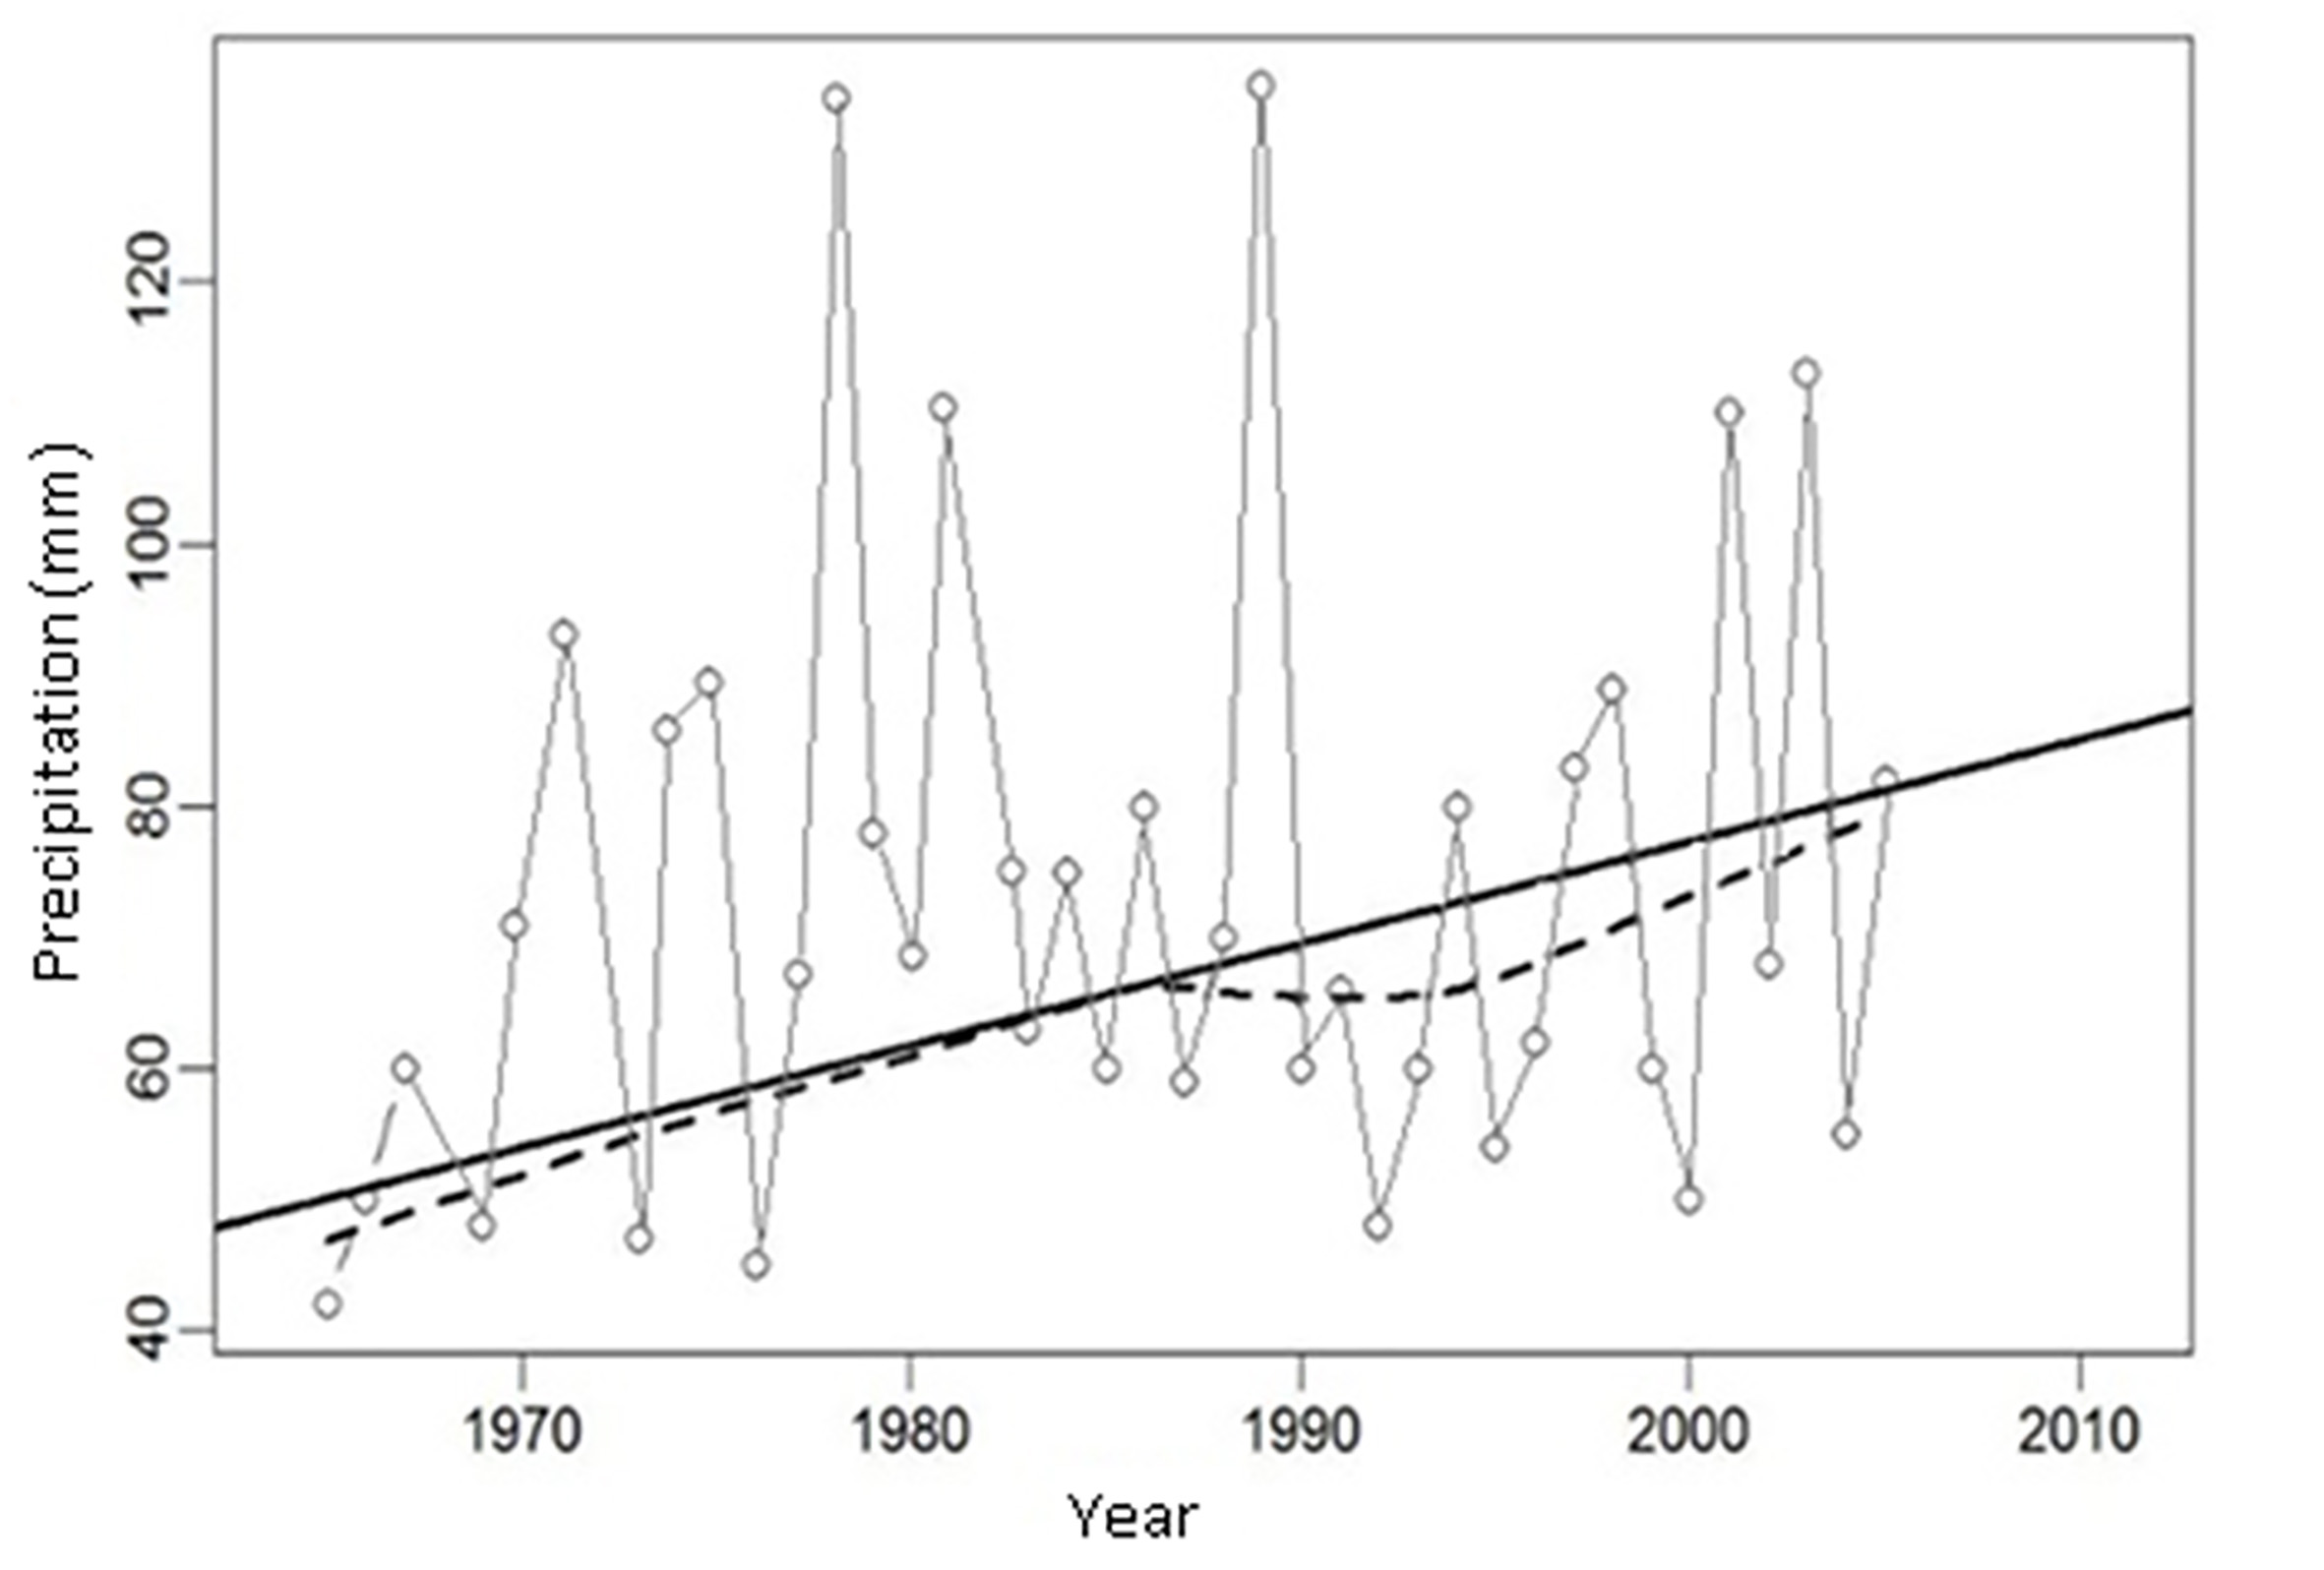
In Figure 4 the sequence of lines with peaks represent the annual series of the daily maximum precipitation data at the PRC station, and the dotted line represents a smoothed adjustment to the data series, while the solid black line represents the linear trend. In the case of the station Planta Río Cauca, the increase is 0.78 mm / year, the Universidad del Valle station is 0.76 mm / year and the Colegio San Juan Bosco station is 0.77 mm / year. The statistical significance corresponds to 0.018 (higher than 95%), which indicates that the trend is valid according to 35. The results from these projections are consistent with that found in local study trends 4,36, which affirm the positive trend in maximum rainfall in 24 hours (RX1day) for the study area.
The construction of the hietograms was made with rainfall duration equivalent to the value of time of concentration 60 minutes, and with return times of 2 and 10 years. From these hietograms and the trend analysis, the maximum rainfall in 24 hours was extrapolated, in order to construct the climatic scenarios for the years 2030 and 2040, registered in Table 2.
Table 2 Magnitude of design storms evaluated in mm
| Climatic Scenario | Station Planta Río Cauca | Station San Juan Bosco College | Station Universidad del Valle |
|---|---|---|---|
| Current. Tr= 2 years | 74 | 73 | 72 |
| Current. Tr= 10 years | 105 | 102 | 99 |
| Future. Year 2030 | 132 | 117 | 115 |
| Future. Year 2040 | 125 | 138 | 145 |
The model allowed the idenjpgication of points where the system is not sufficiently efficient to evacuate the rainwater, leading to flooding in some points of the city. Figure 5 shows the state of the drainage system at the end of the precipitation event (60 minutes after the start of rainfall) for a current climate scenario with a return time of 10 years, for the 2030 climate scenario and the 2040. In Figure 5 the circles represent the inspection chambers of the drainage system and the lines are the collectors or pipes.
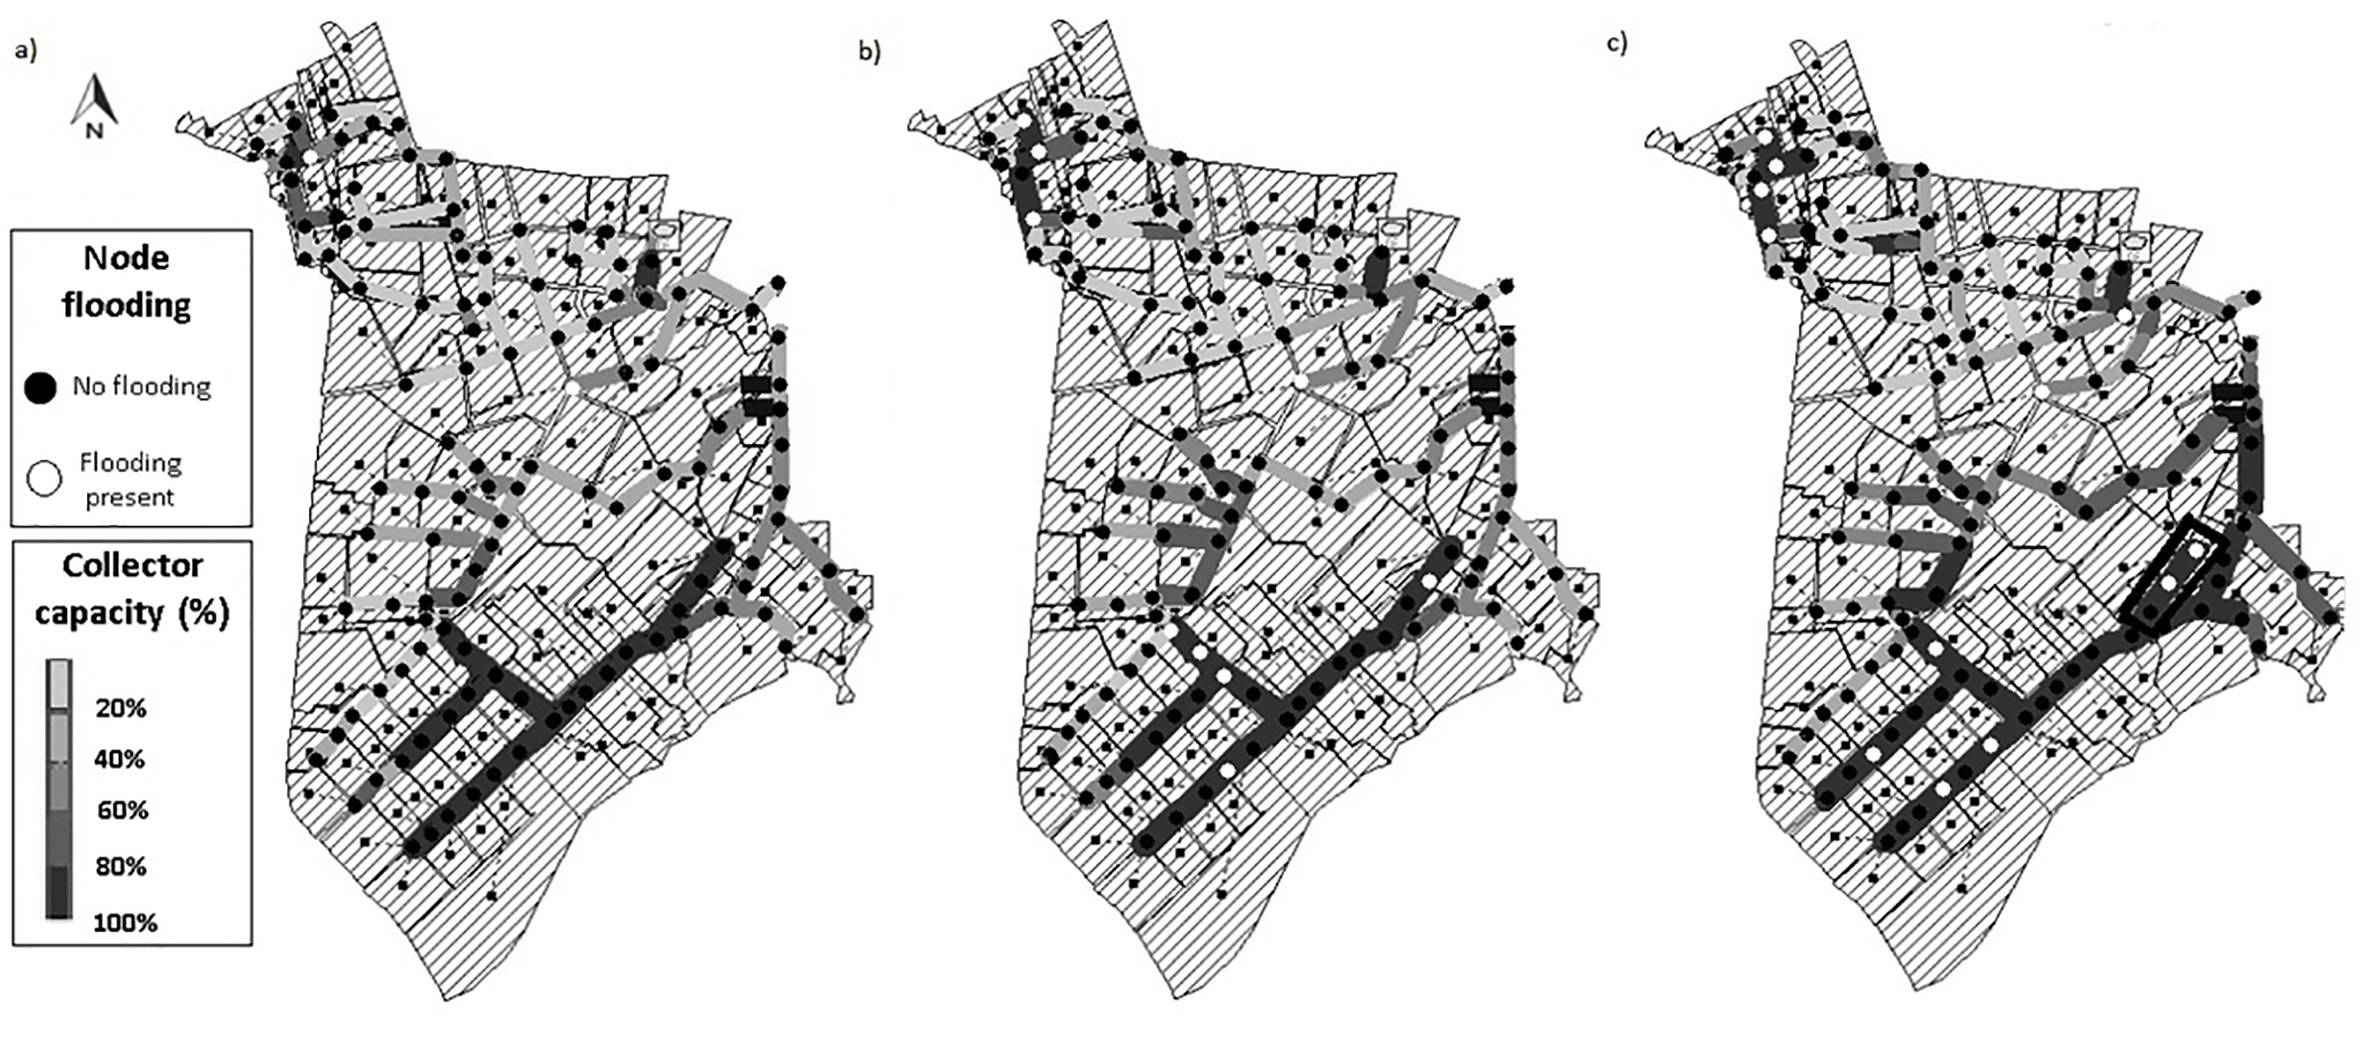
Figure 5 Hydraulic status of the drainage system in the EDZ for a) the current climate scenario, b) the 2030 climate scenario and c) the 2040 climate scenario (own source)
It is evident that the maximum hydraulic capacity of transport in different collectors has already been reached for the current climate scenarios, as well as for the years 2030 and 2040. The percentage of occupation of the pipes and channels increasingly reaches 100%, mainly in the collectors of the Canal Oriental and initial afferent sections of the Canal Autopista. This fact demonstrates the limited useful life of the drainage system in the face of increased rainfall.
For the three climate scenarios, the points where flooding occurs are concentrated in the north-western and central part of the EDZ (Figure 5). In the 2030 and 2040 climatic scenarios, flooding occurs in new points with respect to the current climate scenario, these are the Canal Oriental Alto and the Colector de Alivio Oriental, the latter marked by a box in Figure 5-C. The Colector de Alivio Oriental was built in 2012 to mitigate flooding in this area, but considering the tendency of increasing rainfall in the area, this type of solution is not permanent,. In this sense, the solutions aimed at increasing the network of collectors or their capacity, is limited by the increase in rainfall, in addition to the difficulty of carrying out the work in densely populated parts of the city with little slope, such as the EDZ.
Flood volumes recorded in the inspection chambers vary depending on the climate scenario being evaluated, however the tendency is always for an increase in flood volumes in accordance with the increase in daily maximum rainfall. This fact can be observed in Figure 6.
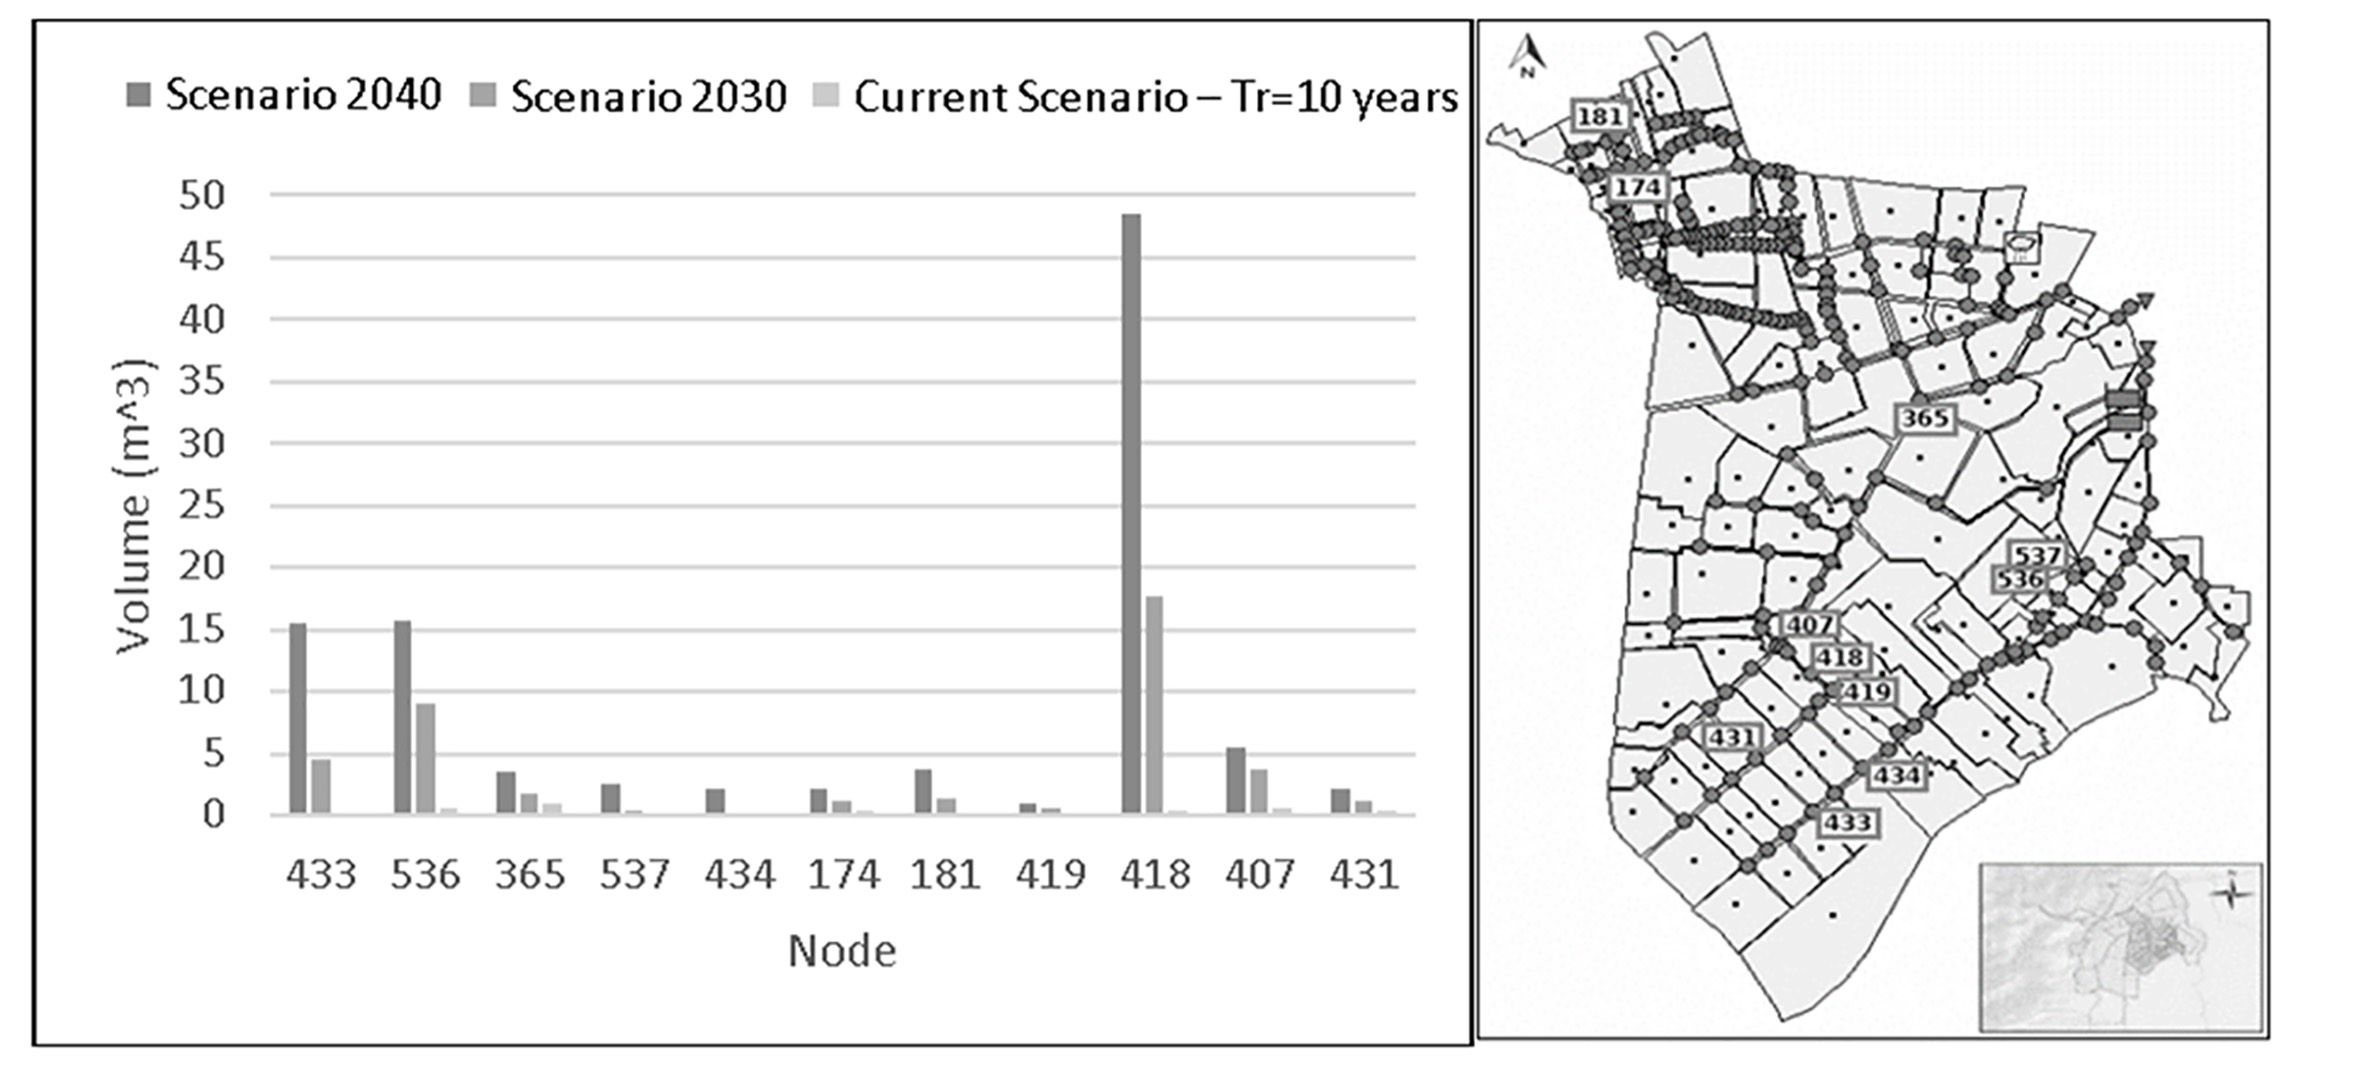
Given the climate scenarios for the year 2030 and 2040, the operation of the drainage system is deficient. The most critical inspection chamber in terms of flood volumes is chamber 418 (located in the Canal Oriental Alto), which has a maximum flood volume of 48 m3 (in 2 hours) in the 2040 climate scenario. Among the benefits of the model constructed, it not only idenjpgies the points where the system fails, but idenjpgies prioritizing actions aimed at mitigating future floods, allowing the optimization of resources. Based on the results shown in Figure 6, intervention should be prioritized in the afferent area of the Oriental Alto (chamber 418), the Calle 48 (chamber 433) and the Colector de Alivio Oriental (chamber 536).
4. Conclusions
The constructed model is a good approximation of reality, taking into account Nash-Sutcliffe index values above 0.5 in all simulated events, with a descriptive capacity of the drainage networks, facilitating the incorporation of the spatial variability of the physical characteristics of the network and the spatio-temporal variability of precipitation.
The hydraulic operation of the drainage system of the EDZ for the climate scenarios for the years 2030 and 2040 is deficient, taking into account the flood volumes and the new points where backflow occurs, as idenjpgied in the SWMM simulations. The 2040 climate scenario presents the highest flood volumes with respect to the 2030 climate scenario and the current climate scenario.
The simulations permit the prioritization of possible interventions for the improvement of the drainage system. Intervention should be prioritized as follows: (i) Canal Oriental Alto, (ii) Canal de la Calle 48, tributary of the Canal Oriental Alto and (iii) the Colector de Alivio Oriental. This conclusion is based on the flood volumes and the population density of the affected area.
The Colector de Alivio Oriental was built to mitigate flooding in an area of the basin, a solution which according to the simulations for the 2030 and 2040 climate scenarios is temporary. This result invites the prioritization of a reduction in runoff, as an alternative management of urban rainwater to the increase in the number and capacity of collectors. The decrease in runoff is achieved by increasing surface retention and increasing infiltration; The modeling done in this research is a useful tool that facilitates the evaluation of technologies which can help the city to adapt to the effects of climate variability and climate change, through possible hydraulic works, or changes in land use that prepare the east of city for the amortization of floods.
As a recommendation and future line of research, the evaluation of the current system in different scenarios of climate variability and climate change in the implementation of Sustainable Urban Drainage Systems (SUDS) is proposed as an adaptive option to these scenarios, thus potentiating this option provided by the SWMM with the so-called LID's.

