1. Introduction
The aim of this paper is to empirically describe the efficiency of research activities in Colombian universities. In addition, it is explored how the efficiency in research activities can explain the exponential growth of the Colombian universities’ publications. According to 1, the exponential publications behavior is related to the cumulative advantage processes. Seminal works and models in scientometrics show the exponential growth of science, some models are listed in lines bellow: model related to cumulative advantage processes 2, model related to rich-get-richer process 3, models related to the allometric laws, Lotka’s law 4,5. The exponential behavior can be described as, the initial stage of the growth of science is exponential, it is followed by a growth rate gets smaller and smaller as publications size approaches a maximum imposed by limited resources in the environment 2. Other approach is proposed in 1, in which the Colombian universities can be modeled as complex systems, where, underpinning research structures (feedback structures) drive the exponential growth of publications by accumulation of intellectual capital. In this work, it is confirmed that the exponential growth of the Colombian universities’ publications is maintained for more than five decades. Furthermore, how the Colombian universities have maintained this growth during that period? and how the limit of resources does not impact negatively in the growth rate of publications? This paper explores the hypothesis that the accelerated publications growth rate is maintained by the efficiency in the research activities of Colombian universities.
According to 1, in universities, the publications production is supported by their faculty, especially the faculty holding Ph.D. degrees. Consequently, in 1 is presented that between 1968 and 2008 for the groups of universities: early (EEG) and late (LEG) exponential growth, the ratio of full-time equivalent faculty Ph.D.s with publications is close to one, it means that every year in average each professor Ph.D. published likewise one paper. However, although the input is limited (full-time equivalent faculty with PhDs), in 2015 the ratio of full-time equivalent faculty Ph.D.s with publications is close to 1.4. Thus, while the research activities are carried out by professors and it can be seen as a limited resource, other factors are inputs in the equation of production of publications, for instance, the students enrolled in the Ph.D. programs, infrastructure, financial support, among others 1. Moreover, human capital, as a critical mass, is one key factor for the creation and dissemination of knowledge 6; at the same time, this key factor supports the production of basic scienjpgic knowledge in favor of innovation and the economic growth of countries 7,9. Similarly, the relational capital is a key factor in the creation and dissemination of knowledge 6,9.
Despite the importance of efficiency in academic research, the systematic evaluation of efficiency in universities is a difficult matter 10. There is a great deal of works related to evaluation of efficiency and different approaches have been developed. The literature review on efficiency of universities in research activities shows works related to process-oriented and results-oriented approaches 10,11. For efficiency analysis of academic departments or universities see 9,24. On the basis of the literature revision, similar works on efficiency evaluation are listed below 11,19,23,24. In sum, the common approaches developed are regressions and Data Envelopment Analysis (DEA). On the other hand, there are complementary approaches such as the value efficiency scores 15, the non-parametric efficiency analysis techniques 11, the restricting weights in value efficiency analysis 15 and others. However, common standards for evaluating academic research or common criteria for all universities, as well as the set of indicators for each criterion, are still a work in progress. In addition, the construction of research evaluation tools needs to take into account multiple (input-output) performance measurements 11. Another limitation is to precise the interrelationship between different inputs and outputs 11; therefore, efficiency in research remains an open research question.
In this work, efficiency is understood on the basis of a biological approach (i.e., complex systems approach), easily illustrated by the principles of natural selection, in which some functions are maximized while others are minimized in order to carry out the efficiently growth. In metabolic capacity, for instance, evolution by natural selection has maximized the surface areas where resources are exchanged (which is essential for energy production), and has minimized both the distances and the time required for resources transport 25. Thus, the efficiency in research can be studied according to the minimization of expended resources, despite the size of the universities (e.g., the size of the faculty). For instance, research teams could achieve economies of scale by division of labour, then bigger faculties have more chance to specialization.
In other works, the complex systems approach has been applied to understand the growth of cities and the efficiency of the cities, enterprises, and other organizations 2,33. According to 33 the scaling exponents β explains mathematical relationships between the size and properties of the complex systems such as: living organisms, cities, companies, economies and others. Then, the properties such as crime or wealth, are predictable depending on the size scale, for instance, the wealth in New York City would be a scaled-up version of the wealth in any small town 30. Here, empirical evidence of scaled-up research activities by Colombian universities is presented. This paper puts forward the argument that scale-up research processes are based on efficiency, therefore, a discussion on how efficiency is reached by increasing returns and economies of scale.
The paper is organized in three sections: first section is related to the methodological approach; results are presented in the second one, and finally, a discussion and future work is presented.
2. Materials and methods
2.1. Related works
According to 1 research activities in Colombian universities were institutionalized approximately 50 years ago, which renders Colombian universities as organizations in growth. Commonly for Colombian universities, the dynamics of publication begun in the 70s 34. A study led by RAND Corporation entitled “Science and technology collaboration: Building capacities in developing countries?”, reveals Colombian research’s strength lays on few research areas, but lacks important aspects such as personnel, infrastructure, investment and institutional and regulatory framework. In fact Colombia is classified as a country with some features of scienjpgic capacity, and where the trend in spending is positive but whose scienjpgic capacity is below the international mean 35. Furthermore, the indicators from the Inter-Iberoamerican Network of S&T Indicators, RICYT for its acronym in Spanish, show a promising context according to the increase in statistics, although not in comparison with other countries of the region 36. Other positive aspects in the growth of Colombian universities are the internationalization and participation in research networks, as shown in 1,35,37,11.
2.2. The Biological Approach
The biological approach (complex systems approach) has been applied in the study of the growth of the cities and other organizations 26,33. As a matter of fact the complex systems approach propose that urbanization, economic development and knowledge creation processes belong to the same urban system, which prevails across different nations and times 25,38. The properties of cities are shown to be power law functions of population size with scaling exponents (Equation 1). According to 25,39,40 the scaling exponents fall into distinct universality classes. Thus, the wealth creation and innovation have β ≈ 1.2 > 1 which means increasing returns, while infrastructure displays β ≈ 0.8 < 1 which translates into economies of scale.
The innovation in the cities is explained by the cities population growth, in which feedback cycles are continually generated by an accelerated rate, where increasing returns and the population's size drive the acceleration. In order to sustain growth, the accelerating rate is maintained and major innovation cycles must be generated at a continuous acceleration 25,39,40. However, when cities grow (i.e., scale in size), the infrastructure and the networks support the growth process of the city through economies of scale, e.g., highways 26,28. In fact, cities that double the population require only about an 85% increase in infrastructure and the systematic savings enable cities to be efficient and economically viable 28.
Scaling reveals underlying dynamics and structures to understand problems across many areas. This approach has been recently applied for building up quantitative models of organizations and social systems in which they are characterized by growth rates or city size 27. It also has been applied to mammals in biology to characterize them as metabolic engines by body size, energy consumption and growth rates 25,39,41.
Thus, the universities can be seen as highly complex systems with self-sustaining structures, in a similar way of cells, organisms, or cities. In which, the integration at all scales is sustained by optimized, space-filling and hierarchical branching networks 25,38. Likewise, universities require close integration of enormous numbers of constituent units that need efficient servicing as living organisms. In living organisms the evolution have reached the underpinning structures to sustain the growth. In the universities these conceptions can be taken into account to develop research policies.
In this work, empirical evidence of scaled-up research activities by Colombian universities is presented below, and a discussion on how the scaled-up process is based on efficiency is provided.
2.3. Source of data
The universities were selected according to their data availability on the indexed publications in the ISI Web of Knowledge (WoS) and the National Information System for Higher Education (SNIES Spanish acronym), this section is organized as follows: first the exponential growth of the Colombian universities’ publications are confirmed to five decades, second the increasing returns is computed based on the faculty size for one year vs. the total cumulative publications for the same year; and, finally the economies of scale are computed based on the size of co authorship network for one year vs total cumulative publications for the same year.
2.1.1. The exponential growth of the Colombian universities’ publications
This study is based on information available as source items in the Web of Science (WoS). The data covers the period from 1965 to 2015 and was accessed from the web platform (WoS). The publications of each university is taken into account according to the meta-data address of the paper, the universities’ names appear in the meta-data address. Thus, the Colombian universities with available data were selected and all the documents were compiled (i.e., all document types, 31.824 total publications) to determine the number of publications of each university per year.
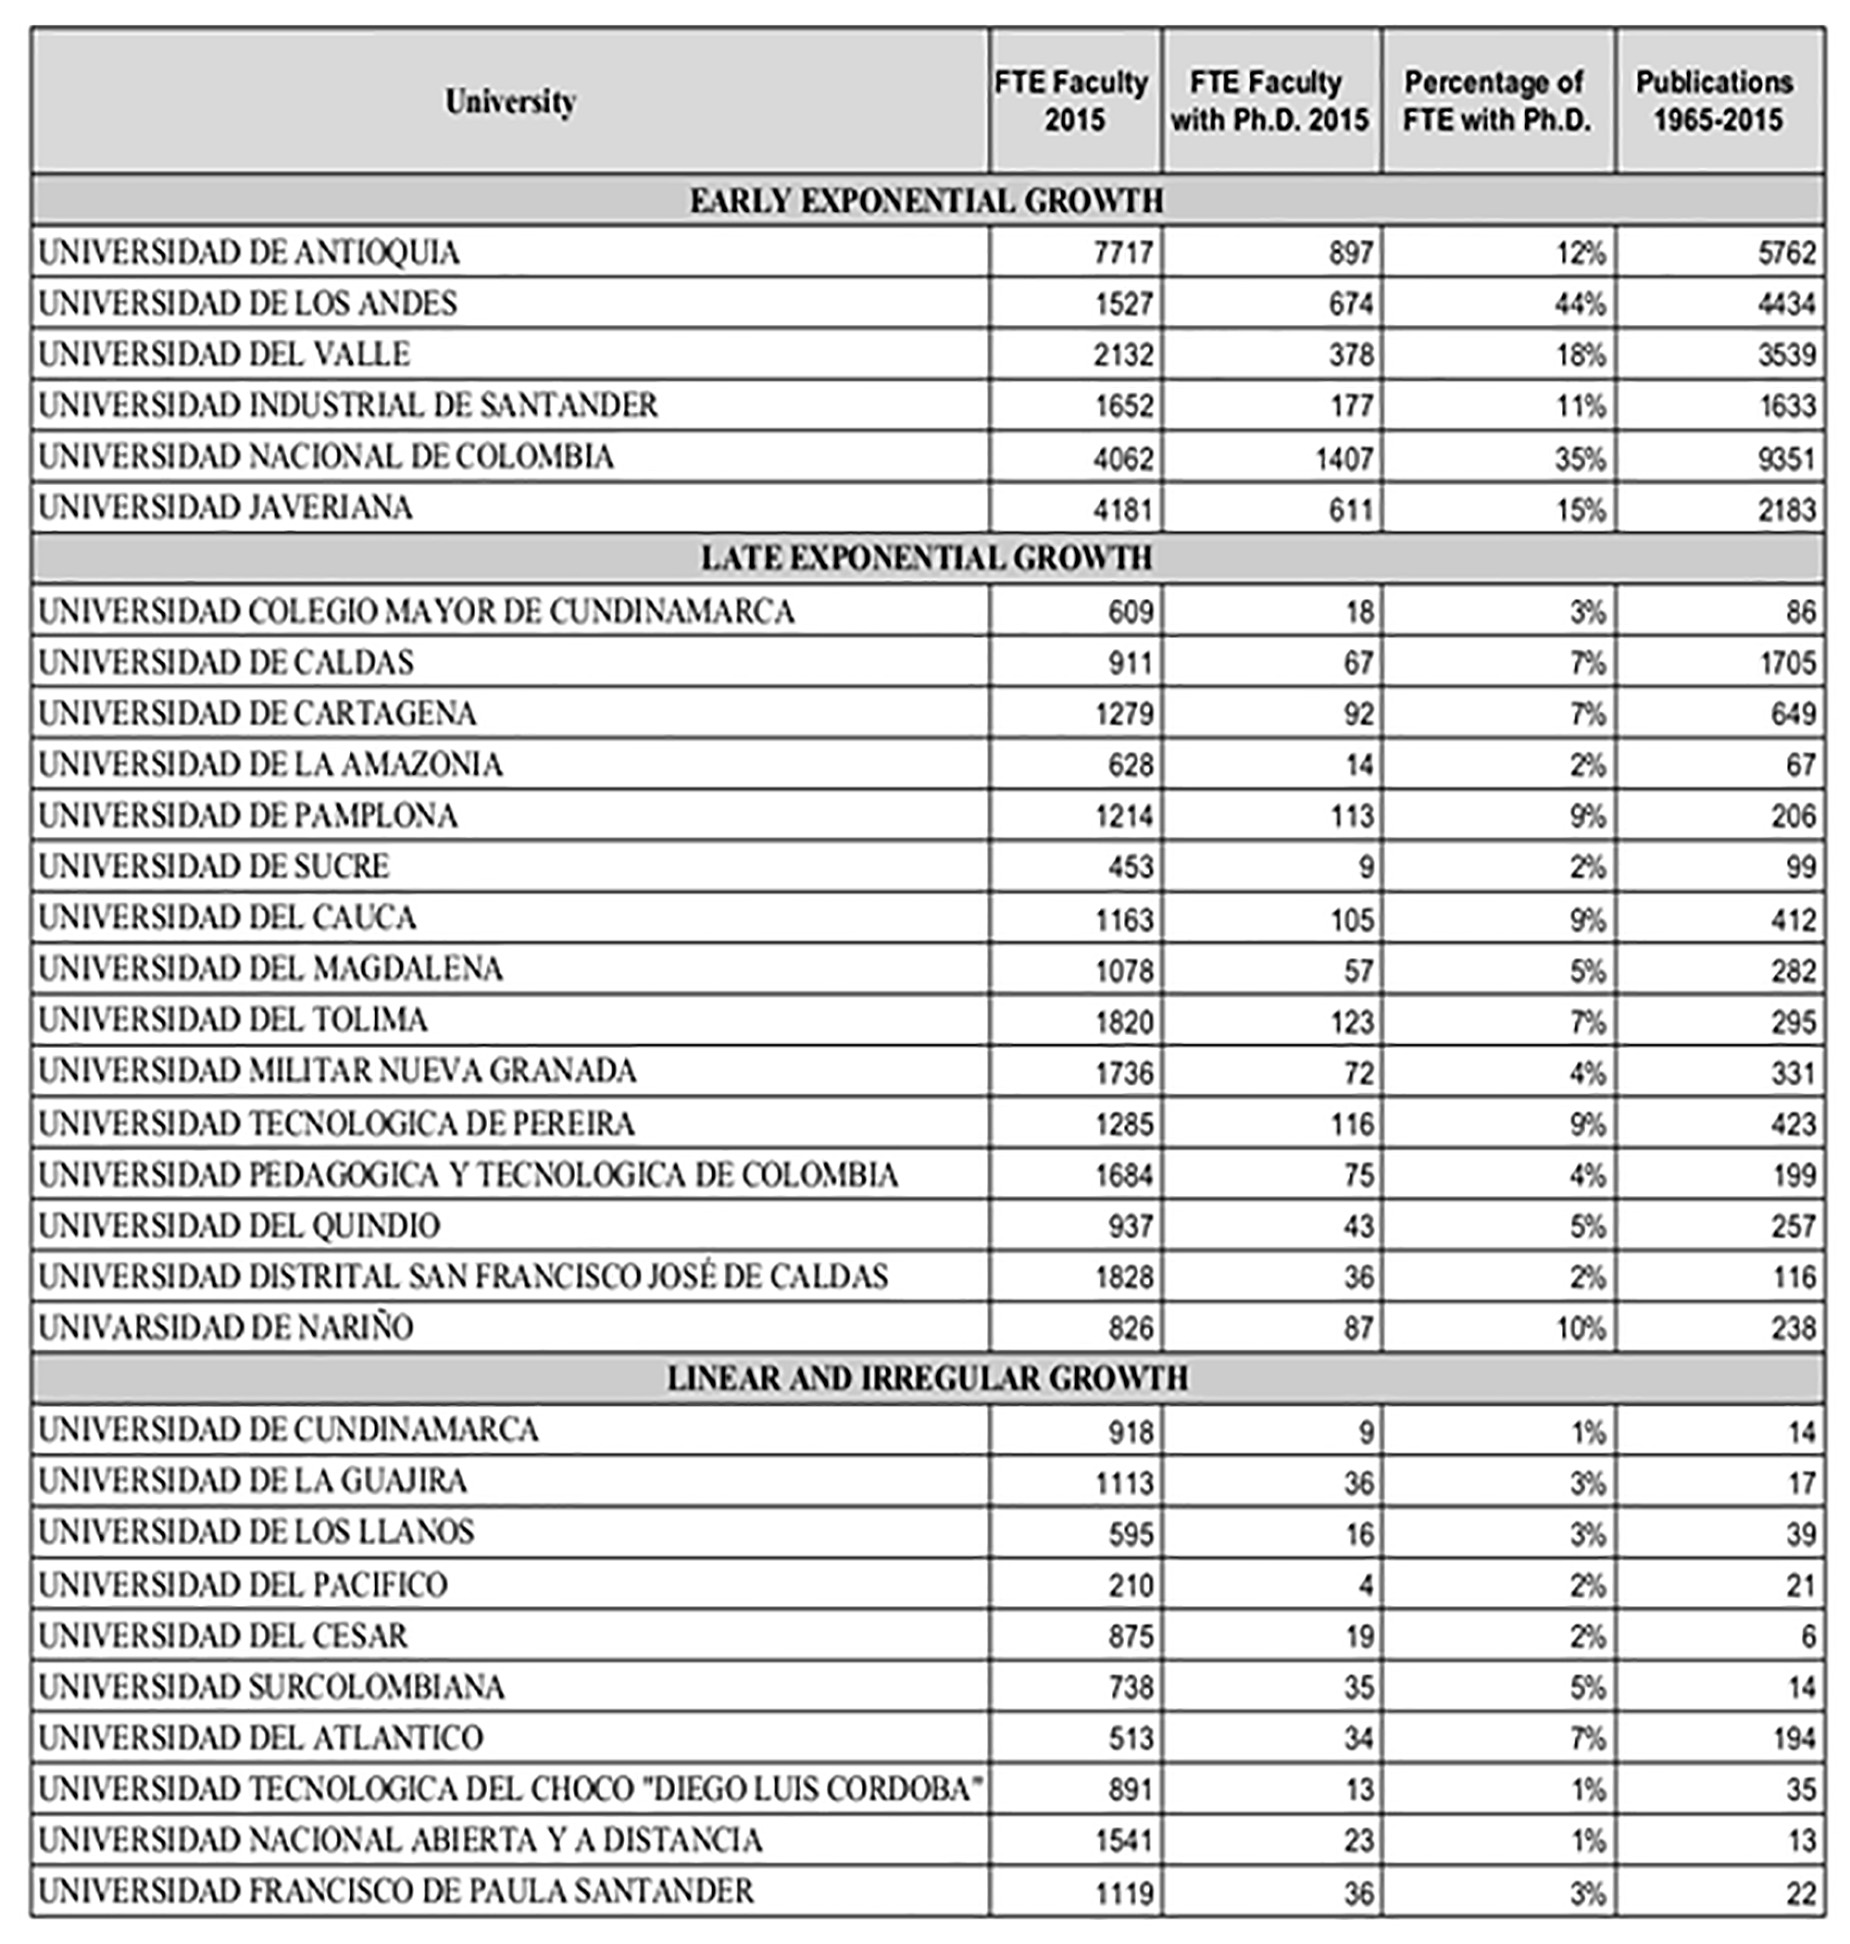
Colombian universities were classified as early exponential growth (EEG), late exponential growth (LEG) and linear and irregular growth (LIG) 1. The total number of universities in EEG was taken into account, 50% of the universities from LEG were considered, and 35% of the universities were included from LIG. Therefore, this study observed 58% of the Colombian universities and also covers all the universities with exponential growth (Figure 1). This figure shows the total of publications between 1965 to 2015 for each university, for build the non-linear regression models the cumulative number of publications is computed as the accumulation of publications by year per university.
2.1.2. The increasing returns of the Colombian universities
The data relates to a full-time equivalent (FTE) faculty, including PhDs and students in PhD programs, covering the period from 2007 to 2015. This data was provided by universities through The National Information System of Higher Education (SNIES). For each university the data from SNIES was filtered using the following characteristics: students doing just academic degrees, PhD students and professors. The total number of full time professors is described as the size of the faculty and the total number of full time professors with PhDs is described as full-time equivalent faculty with PhDs.
To build the regression model we considered the size of the faculty for each studied university in 2011, 2013, and 2015. In 2015 there was a total of 47.980 professors, out of which 5.388 held a PhD degree and a total of 3.955 PhD students associated to the professors. Finally, Full time professors with PhDs and PhD students were used to compute the average ratio of students per professor.
2.1.3. The economies of scale of the Colombian universities
The data of publications in the Web of Science (WoS) is used to extract the co-authorship network. The co-authorship network covered the period between 1965 and 2015. Thus, the size of the co-authorship network is the total authors per year per university, Finally, the cumulative number of publications is computed as described in lines above. For build the nonlinear regression model it is taken into account the size of the co-authorship network between 1965 to 2015 for each studied university
2.4. Statistical method
On the one hand, the size of faculty and the cumulative number of publications produced by each university formed the basis of the regression analysis of increasing returns. And the other hand, the size of the co-authorship network and the cumulative number of publications formed the basis of the regression analysis of economies of scale. Based on the size of faculty and co-authorship network, models were estimated by a non-linear regression. Therefore, the model constructs a non-linear model with a structure that fits the y i for successive x values, using the parameters β; the models, were implemented in Mathematica software package.
The scaling β exponents are computed to explore the scaling relations. Then X(t), as the measurement of the size of the faculty or the size of the co-authorship network at time t and power law scaling takes the form of the Equation 1:
Y(t)=Y o X(t)β (1)
Y represents the number of universities publications; Yo is a normalization constant. Therefore, the exponent, β, reflects the general dynamic rules at play across the Colombian university system.
3. Results
The results are organized in tow sections: first section is related to the exponential growth of the Colombian universities’ publications; the increasing returns and economies of scale relations are presented in the second one.
3.1. The exponential growth of the Colombian universities’ publications
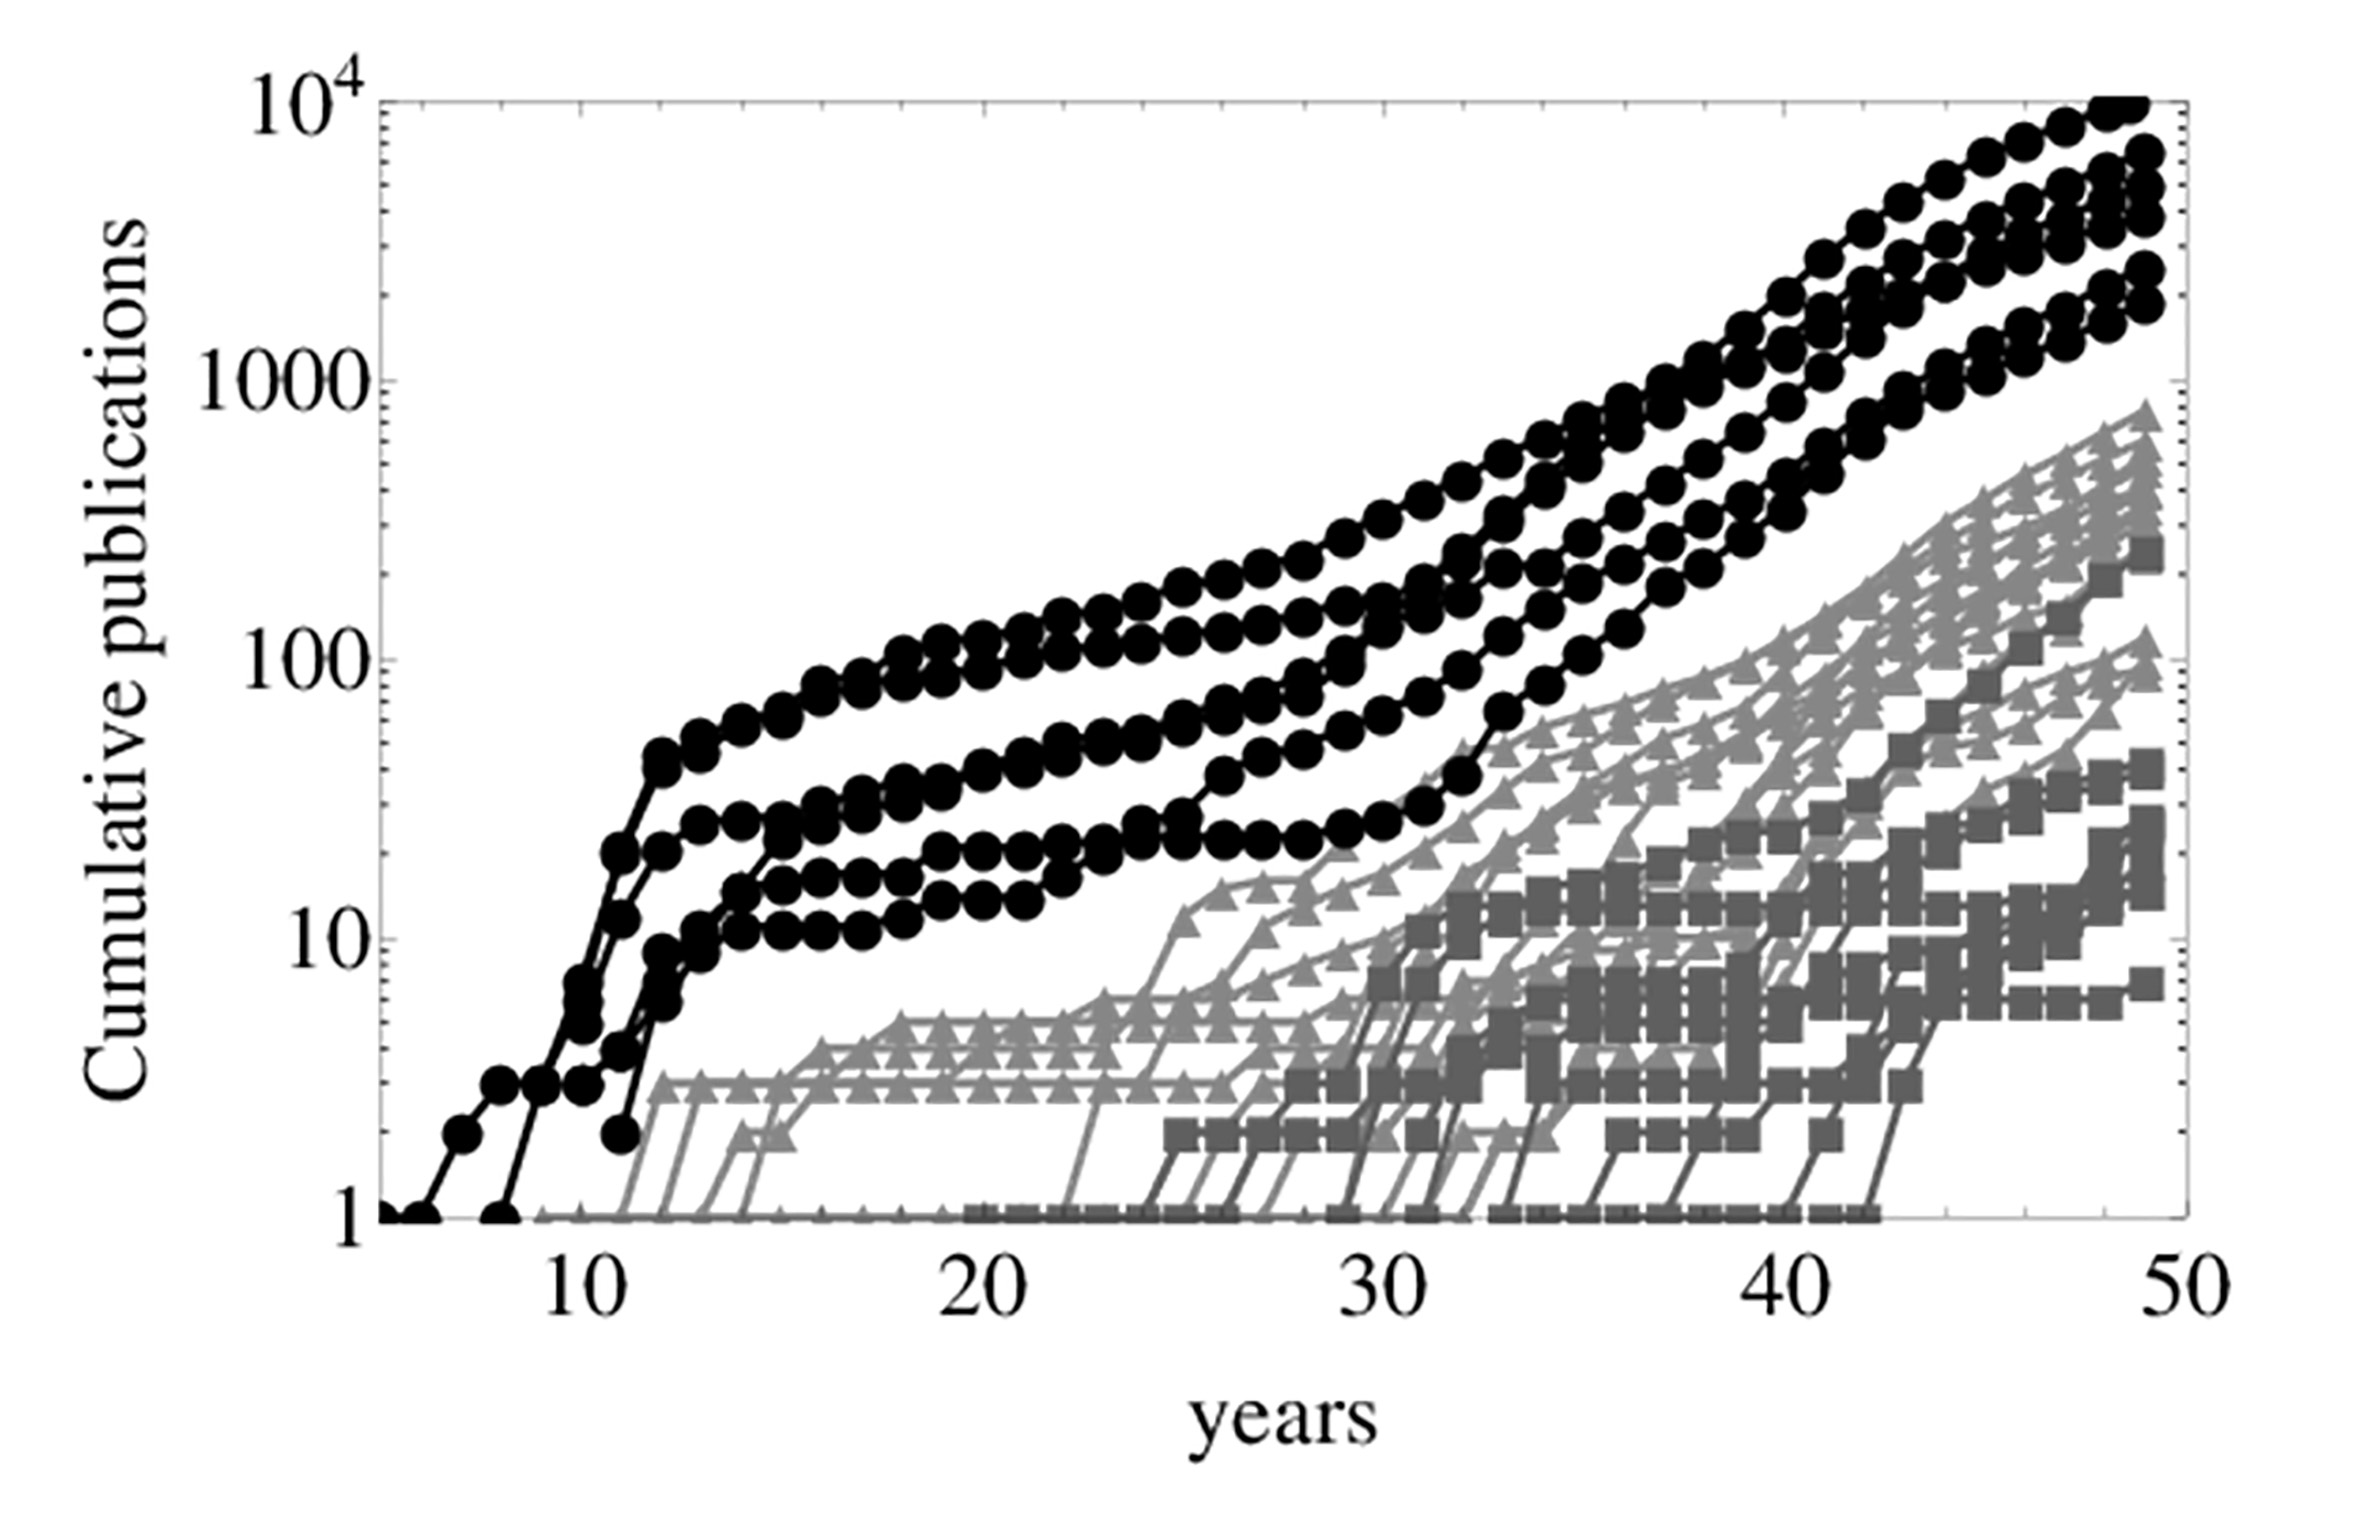
Figure 2 shows the time series data of universities classified into the exponential categories, as explained in the previous section. The growth dynamic is maintained in comparison with the results shown in Figure 2. The figure shows differences in orders of magnitude between groups of universities; while EEG reached 104 publications in 2015, LEG and LIG reached less than 103. Thus, the growth behavior of Colombian universities is confirmed and was maintained over a fifty-year period.
3.2. The increasing returns and economies of scale of the Colombian universities
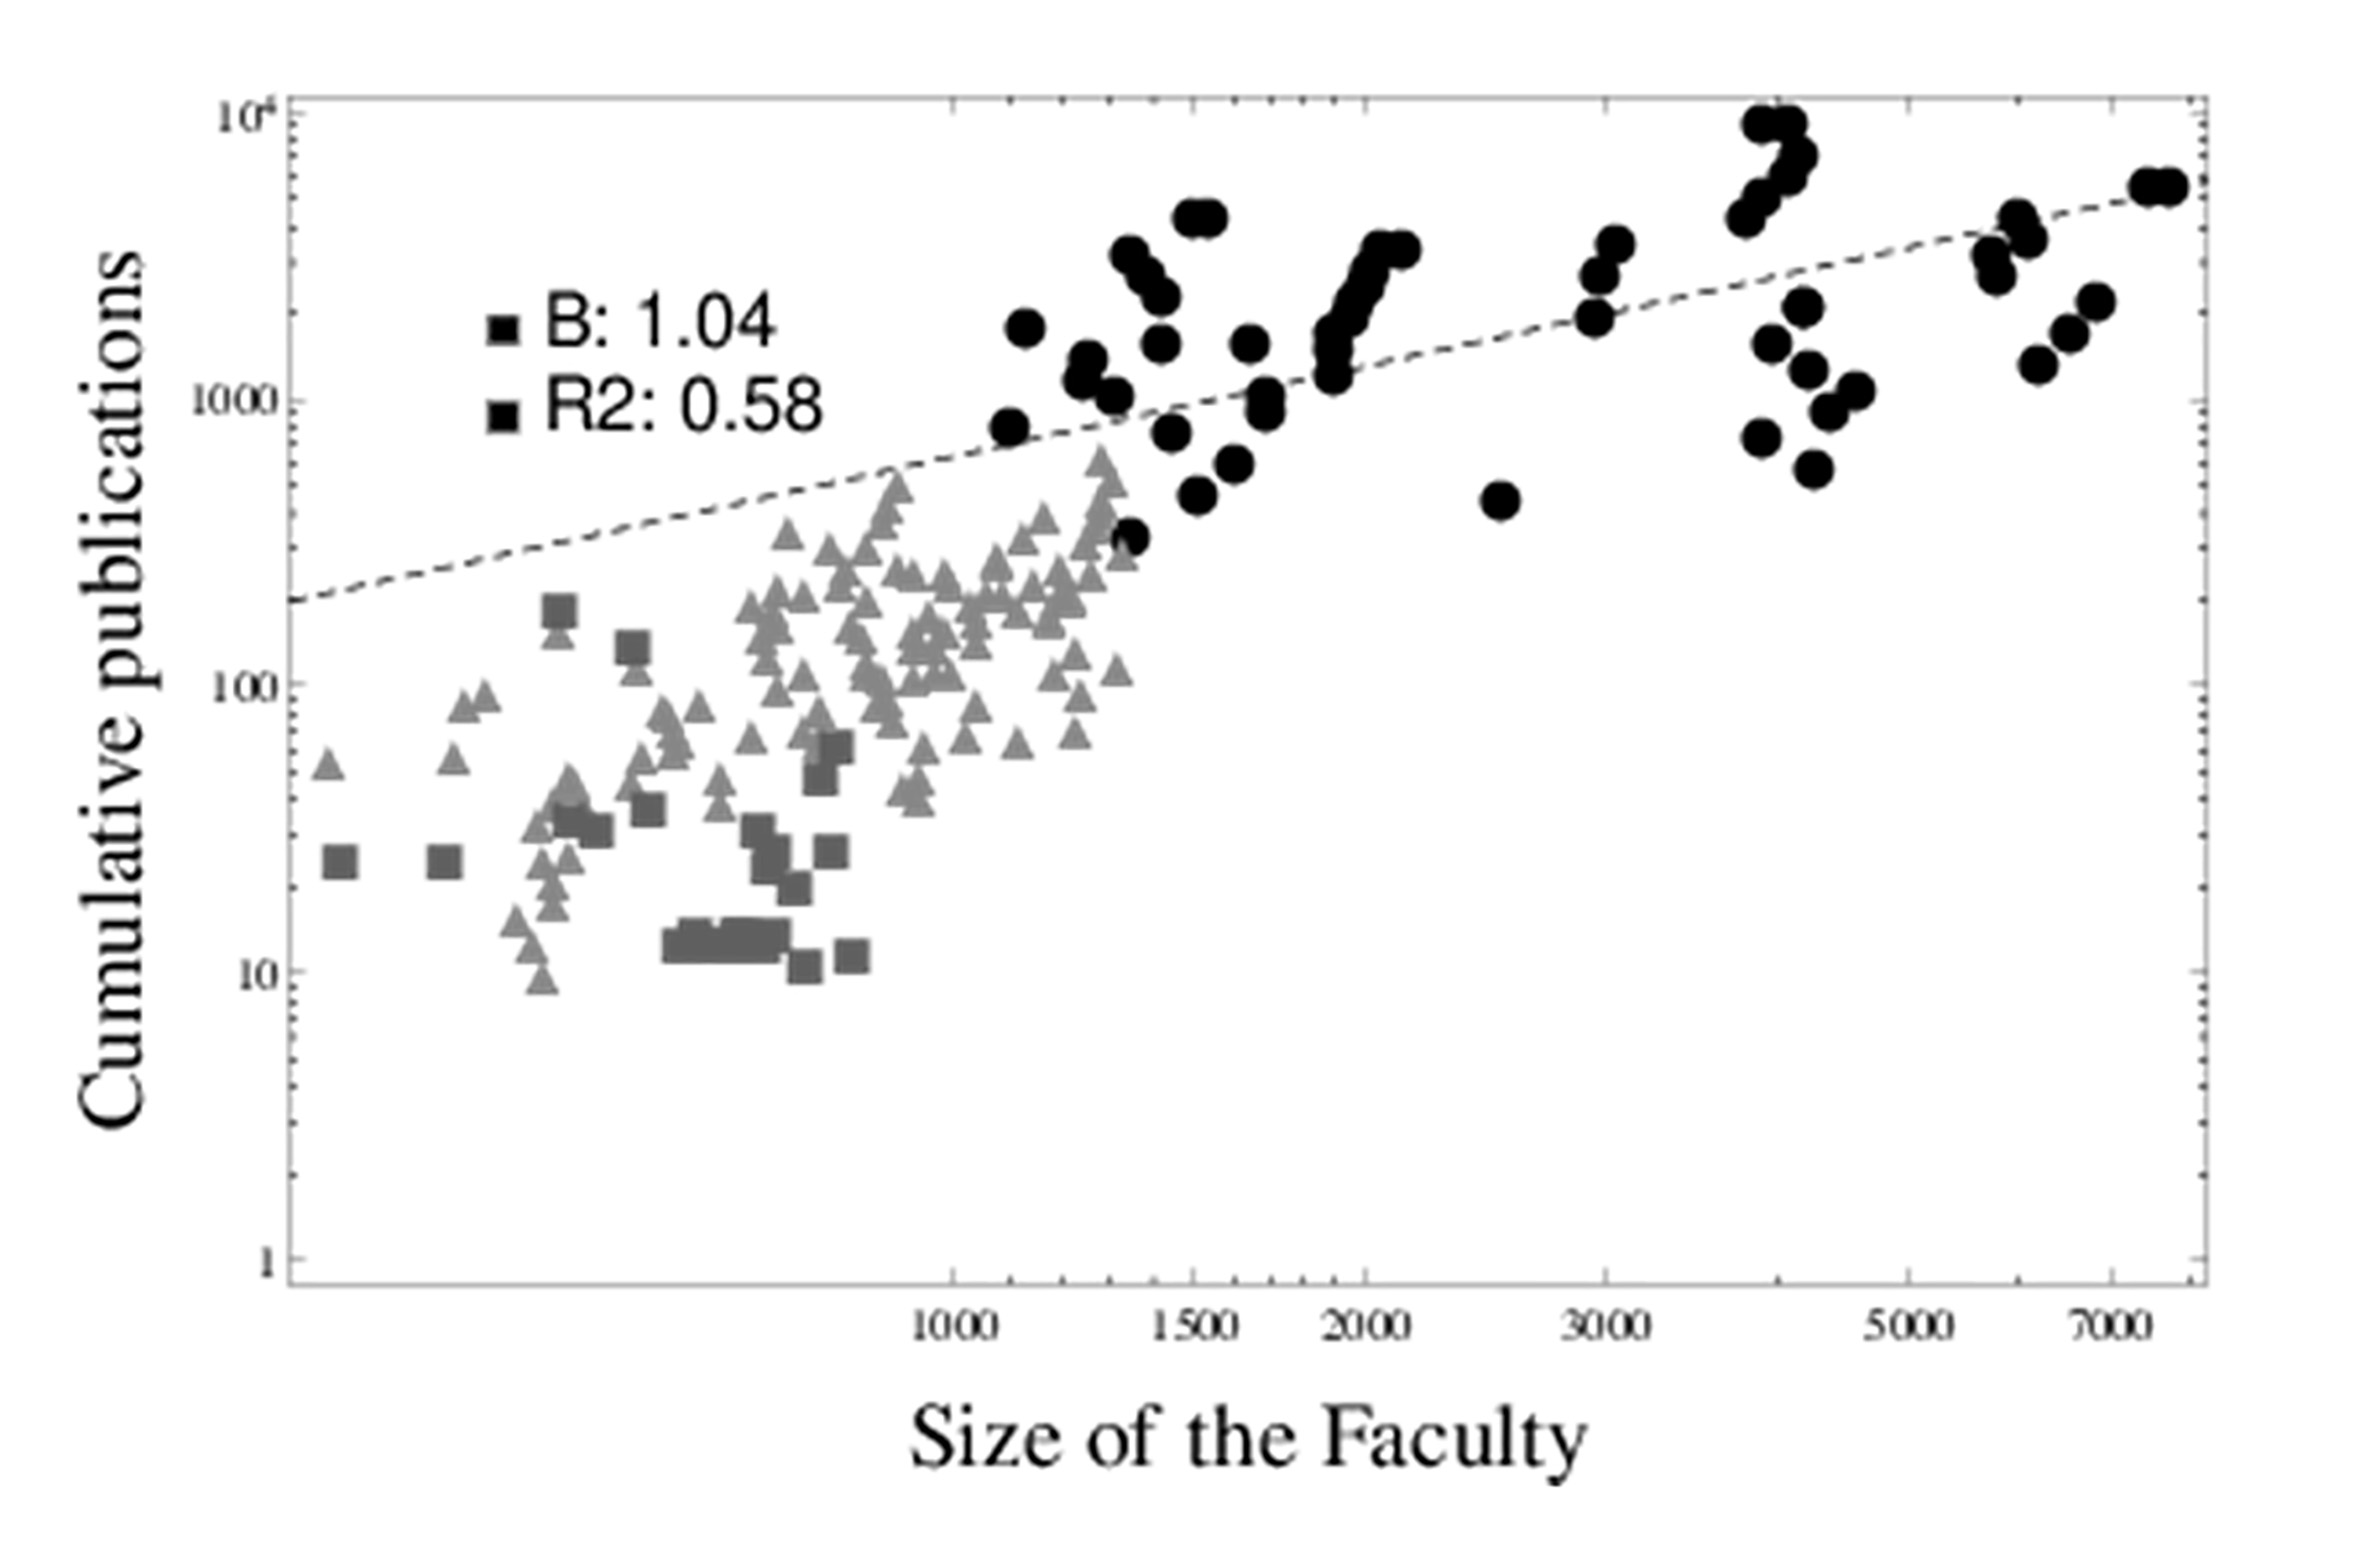
The nonlinear regression model is computed according to the size of the faculty for 2011, 2013 and 2015 for each studied university and the cumulative publications for the same years. Thus, the scaling coefficient of the faculty size vs cumulative publications is presented in Figure 3. The short-dashed line shows the model, the scaling coefficient is β ≈ 1.04 > 1, standard error 0.0942685, t-Statistic 11.056 and P-value 3.86103E-22, this result shows that the relationship is superlinear.

Figure 3 Scaling relationships between size of the faculty and cumulative number of publications (log-log plots). Each marker represents one of the categories: black circles stand for the EEG category, while light gray triangles and gray squares represent LEG and LIG categories, respectively (own source)
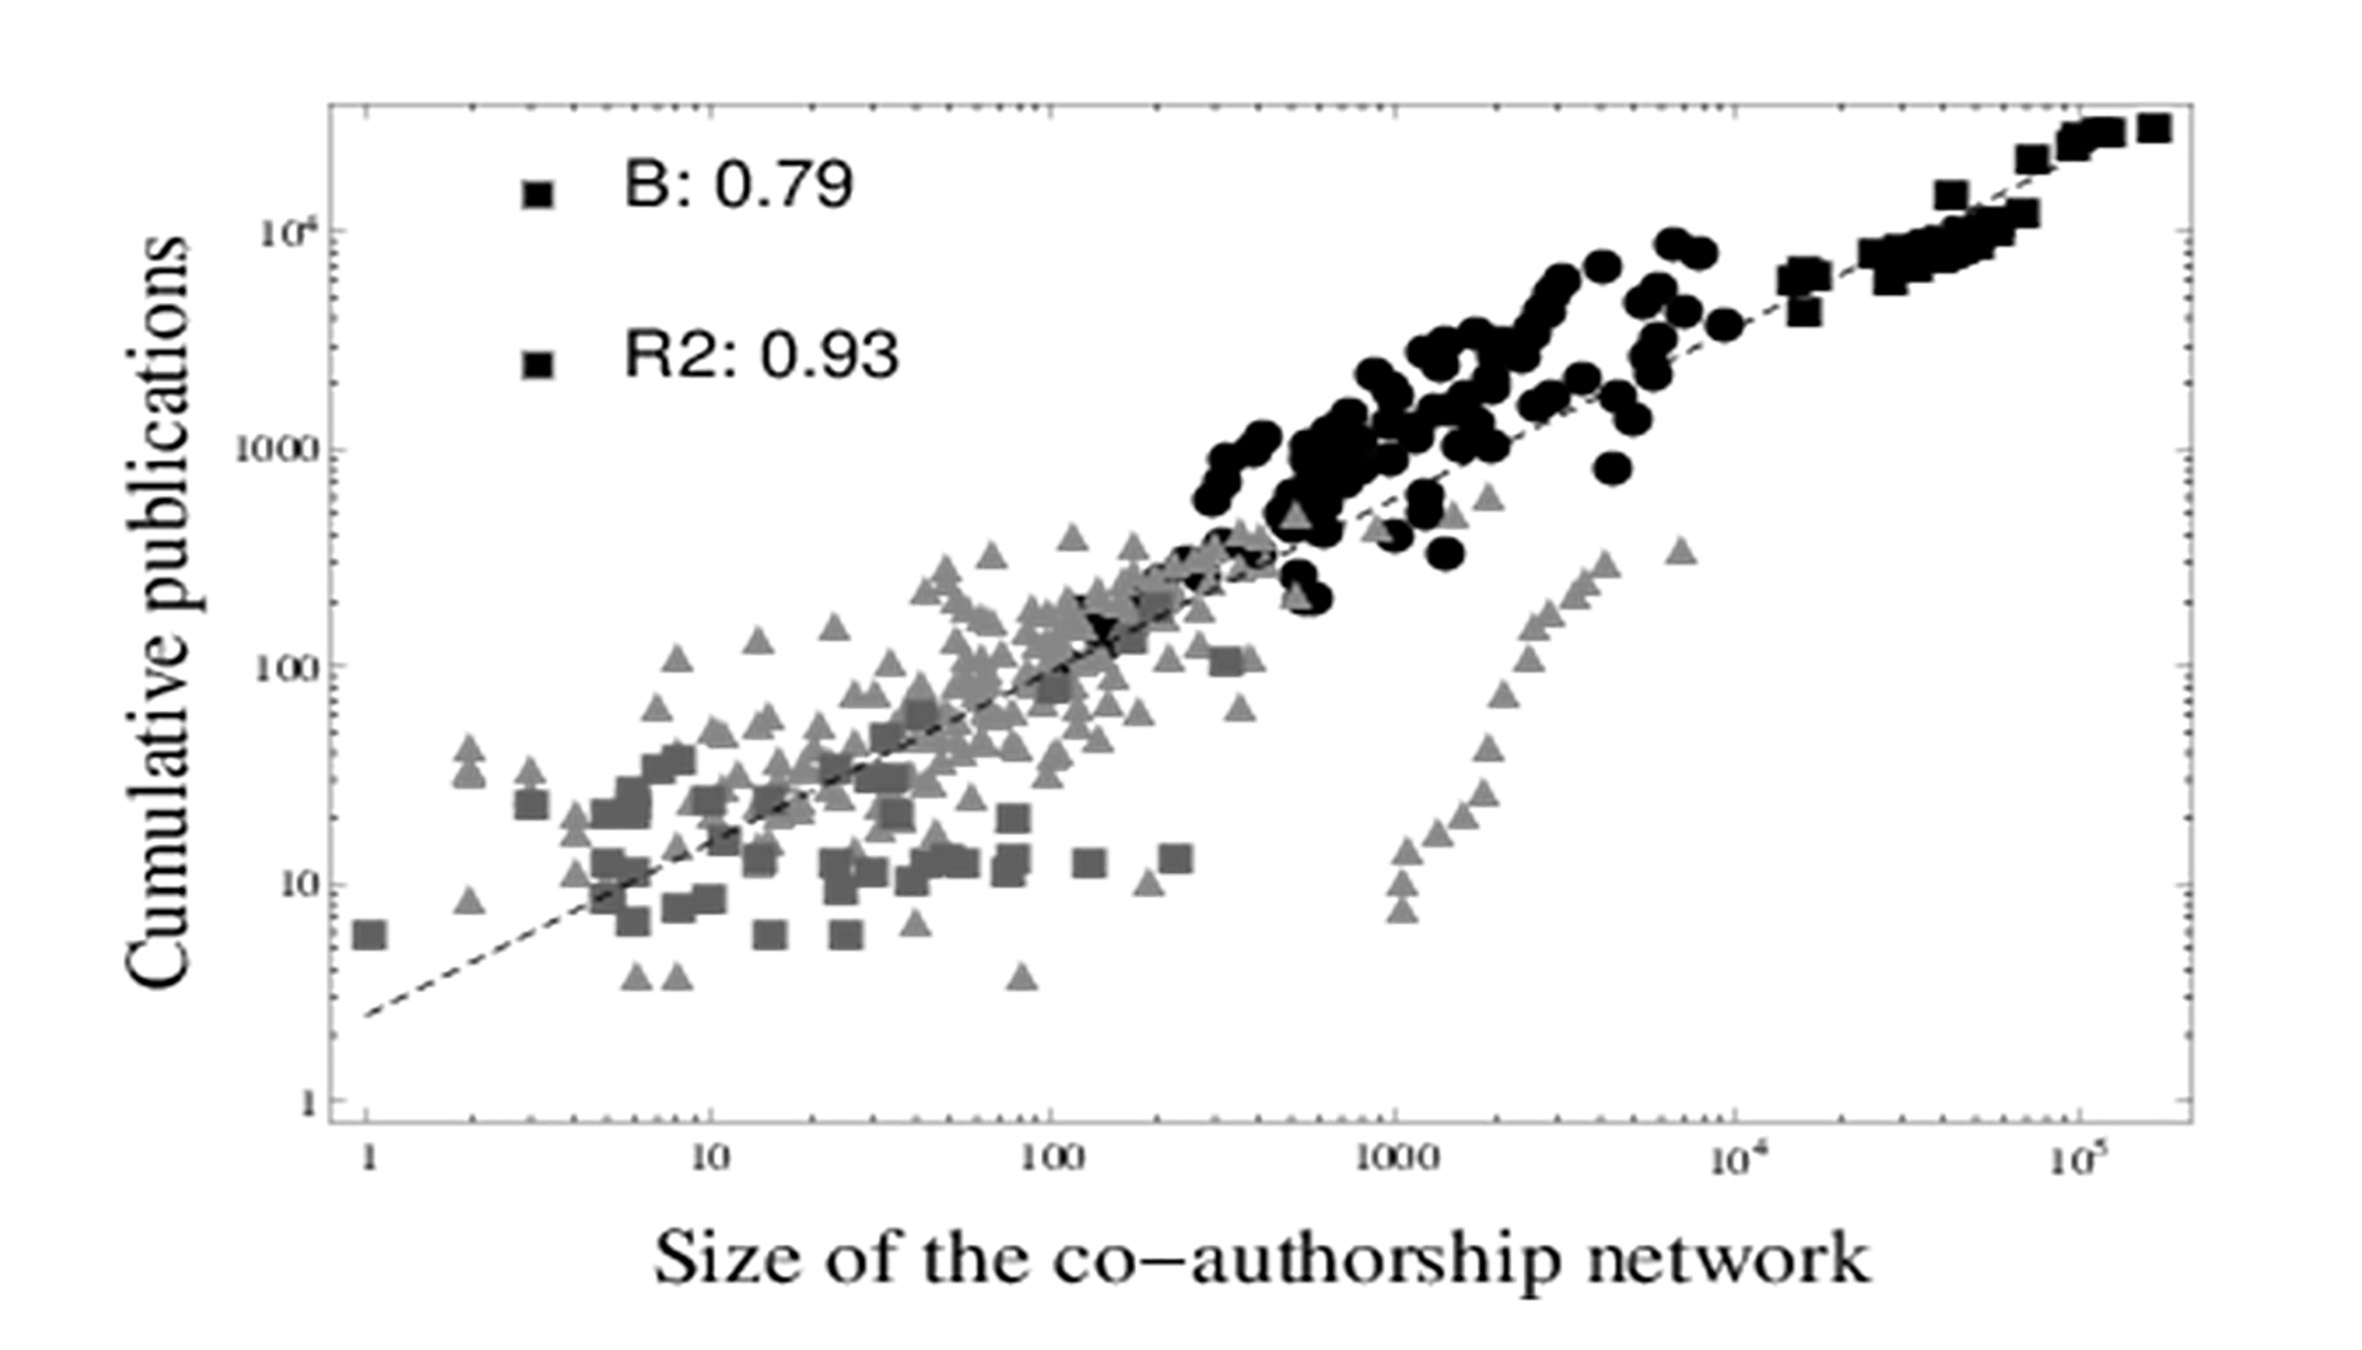
Figure 4 shows the size of the co-authorship network vs cumulative publications by 50 years per university, the short-dashed line shows the model. The scaling coefficient for the size of the co-authorship network is β ≈ 0.76 < 1, standard error 0.0241072, t-Statistic 31.6193 and P-value 3.90994E-96. In addition, Figure 4 shows black squares representing data from the top five universities ranked in the Academic Ranking World Universities 42. The results confirm the scaling exponents in universities that carry out research activities. It suggest that this behavior is shared by universities, and not only by Colombian universities. However, to extend this work, there is a proposal for a more rigorous examination of the power law functions for universities around the world. The results suggest that the research activity scales according to the size of the university. Thus, as the size of the faculty grows, the number of publications grows in an accelerated manner. However, the faculty growth is restricted by the size of the university, space, budget and other factors. Then, the size of the co-authorship network keeps an efficient growth maximizing the leverage of resources thorough of research networks. At the same time, In order to sustain a publications accelerated growth rate, the research networks generate economies of scale. Furthermore, while the relationships between faculty size and cumulative publications is super-linear, the relationships between the size of the co-authorship network and the cumulative publications is sub-linear.

Figure 4 Scaling relationships between size of the faculty and cumulative number of publications (log-log plots). Each marker represents one of the categories: black circles stand for the EEG category, while light gray triangles and gray squares represent LEG and LIG categories, respectively (own source).
In addition, while universities from EEG group have more than 103 of the size of the faculty and 103 of the co-authors, the universities with different growth behavior have less co-authors. Notwithstanding that, they have a similar faculty size. Thus, the larger the faculty in the EEG group, the more options it has to expand its network. The results indicate that the number of full time professors could manage a bigger social network to produce knowledge. This can be seen in other characteristics of research activities. In fact, in the case of the EEG, the PhD students also expanded the size of the network. In 2007 the average ratio of PhD students per professor with a PhD is close to 0.1, and in 2015 this measurement is close to 0.7. In the same period, the average ratio of full-time equivalent faculty PhDs with publications is close to 0.2, and increases to 1.4 in 2015. In fact, the universities that expand their limits of growth by research networks maintain the accelerated growth rate.
4. Discussion and future work
This work confirms the exponential trends of knowledge production by fifty-eight per cent of Colombian universities, in which the growth dynamics have been sustained over fifty years. How is the growth of research activities sustained in Colombian universities? According to 1 the growth is related to the intellectual capital accumulation.
Here, new evidence is shown and the scaling coefficient by faculty sizes reveals that Colombian universities’ publications are β >1, note that the relationship is super-linear, it means an increasing return to scale with the university’ size. Therefore, it is argued that increasing-return relationships are associated with feedback structures, in which the rich get richer 1,3. Consequently, increasing returns is a process in which the university’s research gets recognition, and then more resources are leveraged, and as a consequence, research activities are enhanced and the university is more competitive and more recognized. Production knowledge cycles are then continually generated at an accelerating rate, similar to the innovation cycles in cities 27,28.
The results confirm the scaling coefficients and how this behavior is maintained at least in five orders of magnitude (size of the co-authorship network). Despite the natural limit for the size of the faculty, the number of publications may continue growing exponentially. The faculty is restricted by the size of the university, space, budget and other factors. However, the increase in the size of networks is efficient and economically viable for knowledge production. The results confirm the economies of scale β<1. Consequently, the participation in networks adds research capacities to the universities. The universities that manage to enlarge their research networks will be able to efficiently increase their research capacities, by utilizing the research strength belonging to the network. Thus, the network is a mechanism to gain efficiency.
The research team is composed of the faculty plus a research network. This paper puts forward the argument that universities that grow exponentially follow an efficient model, in which they are able to sustain an accelerated growth rate by research networks, similarly as in living organisms evolution reaches the underpinning structures to sustain the growth based on networks.
The limitations of this work have to do with the scale coverage. In biology this broad spectrum of phenomena covers 20 orders of magnitude 25,27,38, whereas the scale in this study covers five orders of magnitude. Another limitation is the process of building up data and covering the data of all Colombian universities. Future work should build up information in order to increase coverage. In addition, future work could also be focused on a more rigorous examination of the power law function of faculty size in universities around the world and to understand in depth the mechanisms for reaching greater efficiency in research.


