


 English (pdf)
 Article in xml format
 Article references
 Send this article by e-mail
 Cited by SciELO
  Cited by Google
  Similars in
SciELO
Similars in
SciELO  Similars in Google
 Permalink
1. Introduction
ZnO is a well-known wide band gap (E g op = 3.20 eV, at room temperature (RT)) semiconductor with wurtzite structure that exhibits an efficient blue-green emission. It has been extensively studied due to a variety of applications, such as piezoelectric transducers, thin-film gas sensor, UV laser, and others 1-6. It has a high efficiency as a low voltage phosphor and has been used in vacuum fluorescent displays (VFDs) and field-emission displays (FEDs). However, the mechanism of the blue-green emission is still unclear. At first, this emission was associated with divalent cooper impurities 7 but later intrinsic defects such as interstitial zinc ions or oxygen vacancies (ZnO:Zn) 8 were mentioned as recombination centers. During the last years, oxygen vacancies (ZnO:Zn) have been assumed to be the most likely candidates for the recombination centers involved in the visible luminescence of ZnO 9,10.
In order to extend its applications to various emissive displays, rare earth (RE) doped ZnO has been intensively investigated in recent years 6,11-13. Results on various RE doped ZnO are quit disappointing. The energy transfer from the host to RE is very weak 6,12. The weakness of energy transfer has been partially attributed to aggregation of RE’s on the grain boundary due to limitation of solubility. But the essential physical reason must be the weak interaction between carriers and doping ions. Karen Monge et, al., have studied optical properties of ZnO doped with Sulphur, carbon, Eu oxides, EuCl3 and EuF36. It was found that the photoluminescence (PL) of ZnO was very sensitive to the synthesis conditions. Both intensity and peak position depended on synthesis temperature, duration and atmosphere.
In this work, previous studies on optical properties of pure ZnO were carried out with emphasis on the low temperature band-edge photoluminescence, especially the exciton spectrum, from which more information of defect-related effects can be hopefully obtained.
2. Methodology
2.1. Fabrication and characterization of ZnO
Samples of pure ZnO (99.99%, Alfa) were prepared through solid-state chemical reaction. The material was carefully ground for 30 minutes and pressed into pellets under 5000 psi by Carver Hydraulic press machine. The pellets were pre-sintered at 900 oC for 2 hours in air. The pre-sintered pellet was powdered, ground and pressed into pellets again. Samples were finally sintered in air at 1100 oC for 2 hours.
Luminescence and excitation spectra at room temperature were measured on the spectrofluorometer, SPEX-FluoroMax2. For higher resolution and low temperature measurements, 351.1 nm emission of a coherent 300 Ar+ laser, a SPEX 1403 double spectrometer, and an RMC-Cryosystems CR31-21 cryostat were employed.
3. Results and discussion
3.1. Luminescence and excitation spectra of pure ZnO
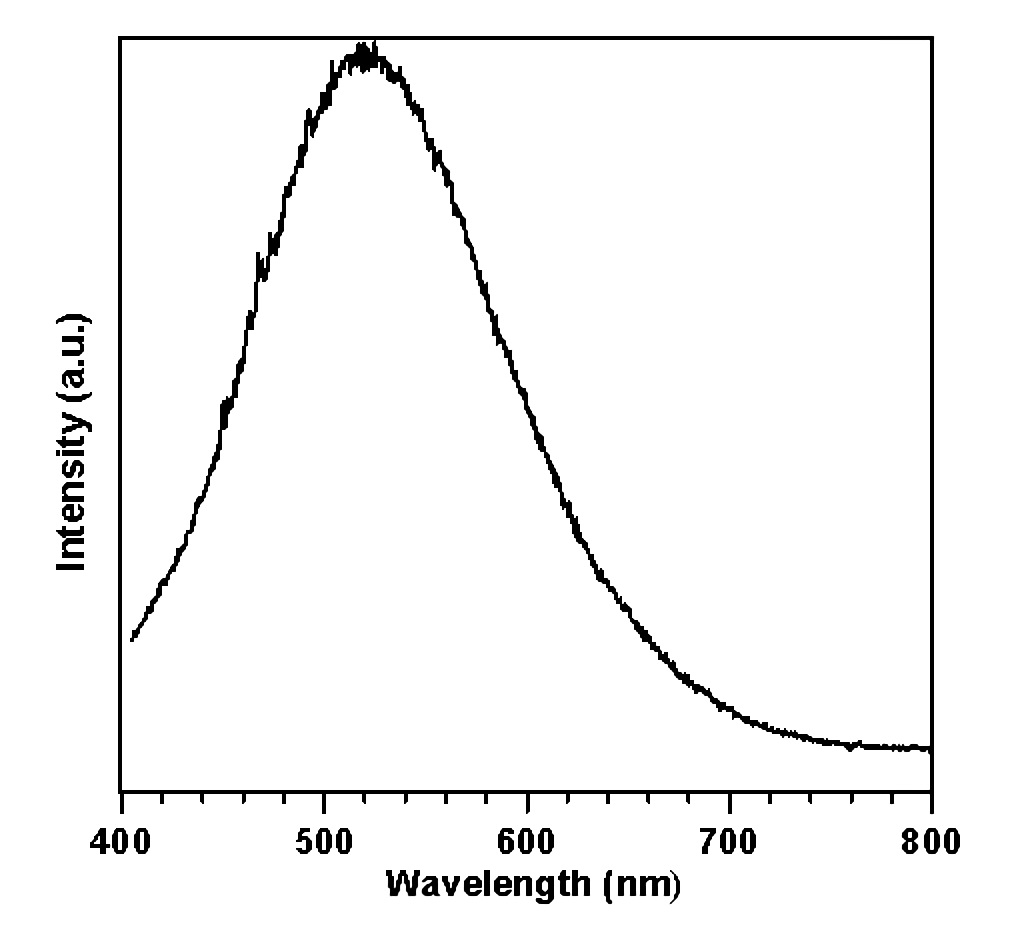
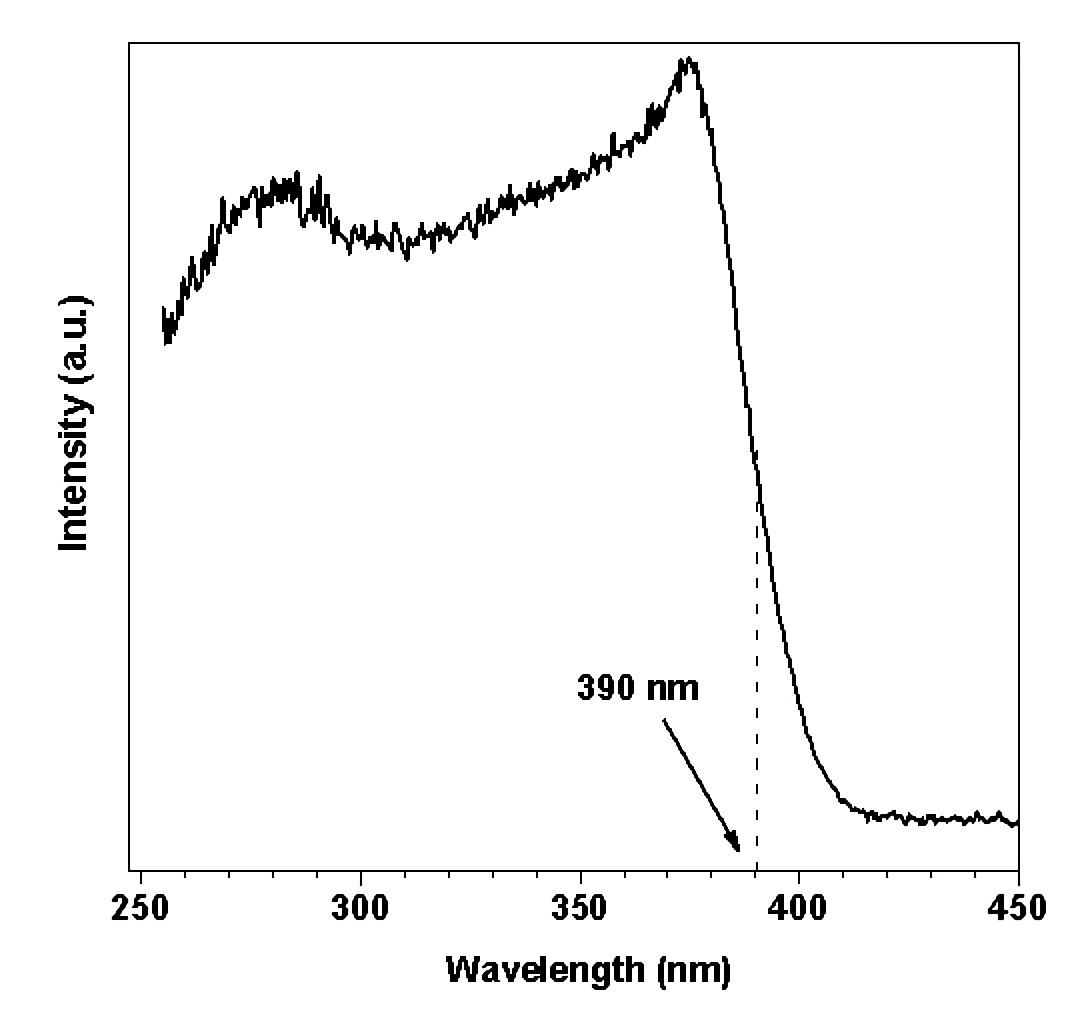
Figure 1 shows the luminescent spectrum of pure ZnO under photo-excitation at room temperature (RT), and which exhibit a broad band emission peak centered at 520 nm. The emission looks green. The excitation spectrum was measured through the monochromator by monitoring the green emission at 520 nm (Figure 2). Two absorption peaks at 376.2 nm (3.296 eV) and 281.5 nm (4.405 eV) were observed. The absorption peaks correspond to the band edge absorption and some indirect band to band absorption. The optical band gap of ZnO crystal at room temperature (RT) was estimated from the excitation spectrum to be 3.18 eV (390 nm), respectively.
The mechanism responsible for the green emission has been an issue of conflicting arguments. Since the last decades, oxygen vacancies (ZnO:Zn) have been to be assumed to be the most likely candidate for the recombination centers involved in the visible luminescence of ZnO.
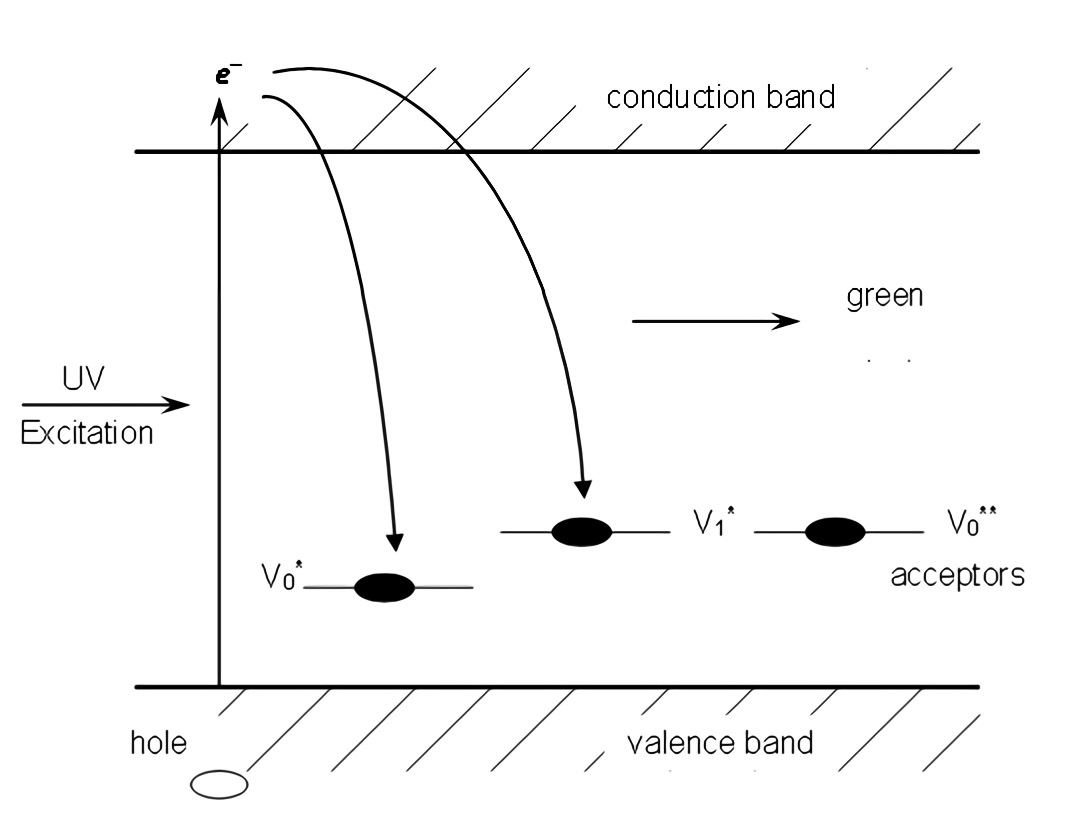
However, different explanations about the source of the green emission band can be found in literature. These include oxygen vacancies 6,9,14,15, interstitial oxygen and interstitial zinc 16. The model of oxygen vacancies is commonly accepted. Previously, van Dijken et. al, investigated the effect of particle size on the luminescence of nanocrystalline ZnO 10,17-19. They were convinced that the defect level of the oxygen vacancies was located above the valence band and served as deep hole traps or acceptors. In his model, an oxygen vacancy can accept one electron (Vo *) or two electrons (Vo **) and stay as ionized acceptors. When ZnO samples are excited by ultraviolet light, electrons from the valence band are promoted to the conduction band and leave holes in the valence band. The ionized acceptors (Vo *, Vo **) can trap holes from the valence band (Figure 3). The broad band emission results from a recombination transition between the electrons in the conduction band and the holes trapped in the acceptors (oxygen vacancies). Based on this model and the energy of the emission band, the energy level of the defects of the oxygen vacancies can be estimated to be 0.80 eV above the valence band.
3.2. Luminescence spectra of ZnO at low temperature
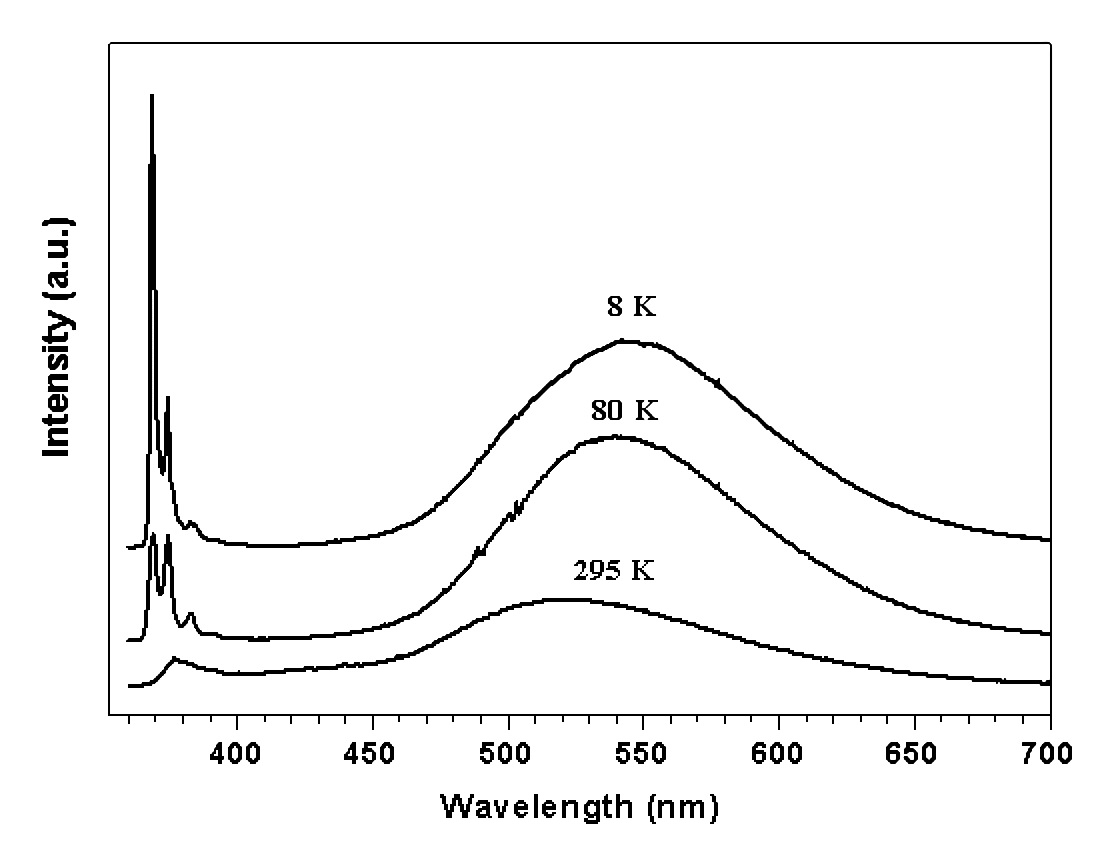
Figure 4 shows the entire luminescence spectra of ZnO from the ultraviolet to the deep red at temperature 8, 80 and 295 K, respectively. The spectra consist of sharp lines in ultraviolet and a broad band in the visible. Figure 4 shows the spectra of sharp lines with higher resolution. It is interesting to note that the broad band emission shifted to the high energy side by 800 cm-1 (0.1 eV) from 548 nm at 8 K to 525 nm at 295 K. This was unexpected. In most cases, emission from optical centers, such as color centers or 3d ions, which strongly interact with lattice vibration, are phonon-assisted transitions, and the spectrum will shift to the longer wavelengths when temperature increases. When the temperature increases, the electrons stay at upper phonon states of the excited state and return to phonon states of the ground state with emitting lower energy photons. Interaction between oxygen vacancies and the lattice should be very strong. This is the reason why the emission band is so broad.
The anomalous blue shift can only be caused by two mechanisms: (1) the electrons in the shallow donors are thermally excited to higher phonon states or activated to upper donor levels; (2) the Vo */ Vo ** acceptors migrate to higher energy sites relative to the valence band. All these processes are thermally activated, so the energy increase should be in the order of kT = 208 cm-1 at room temperature. Therefore, they cannot produce the large blue shift of 800 cm-1.
One possibility of a mechanism causing the energy shift of the defect emission of oxygen vacancies is related to the local electric field. ZnO is a piezoelectric material. The molecules (unit cell) possess electric dipoles, the orientation of which is temperature-dependent. Reorientation of electric dipole when the temperature changes may cause variation of the local electric field near the oxygen vacancies. This may lift up or push down the energy level of the defects in the band gaps. This is certainly still an open question. More work needs to be done in order to clarify the physical reason for the anomalous thermal blue shift.
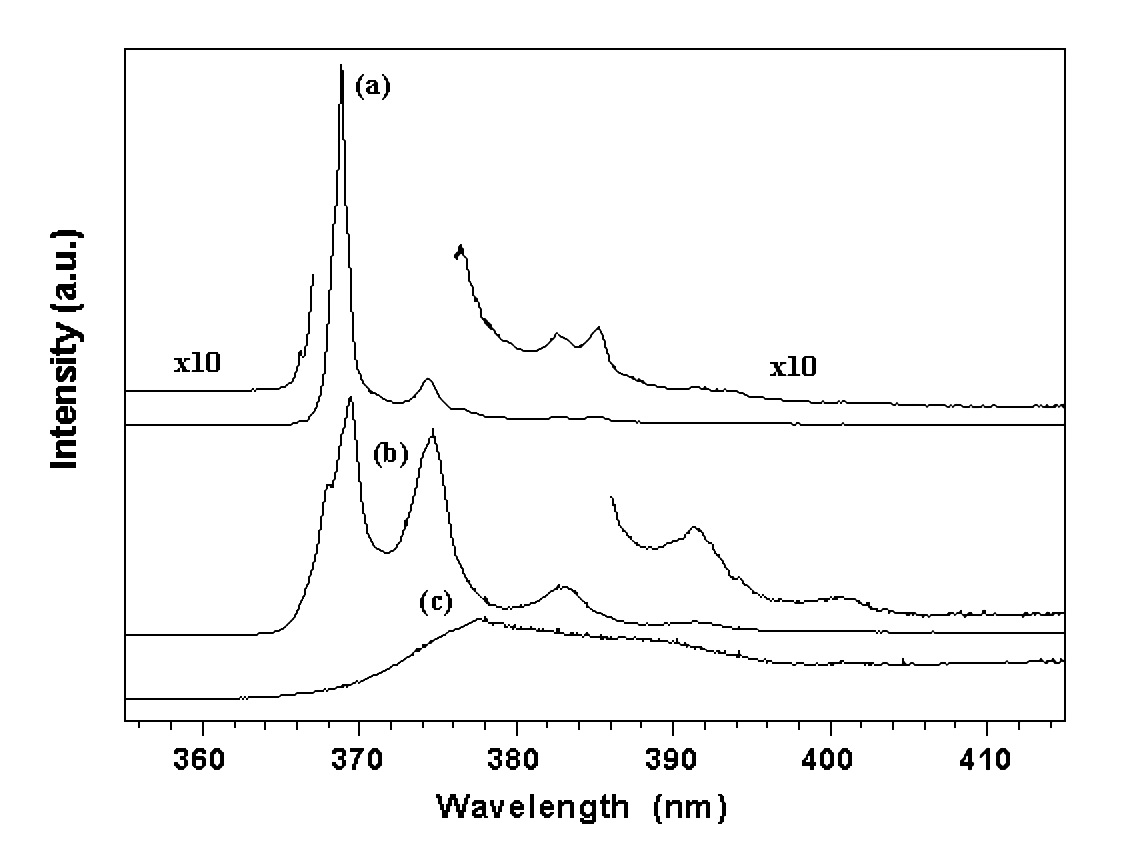
3.3. The ultraviolet sharp lines of excitons
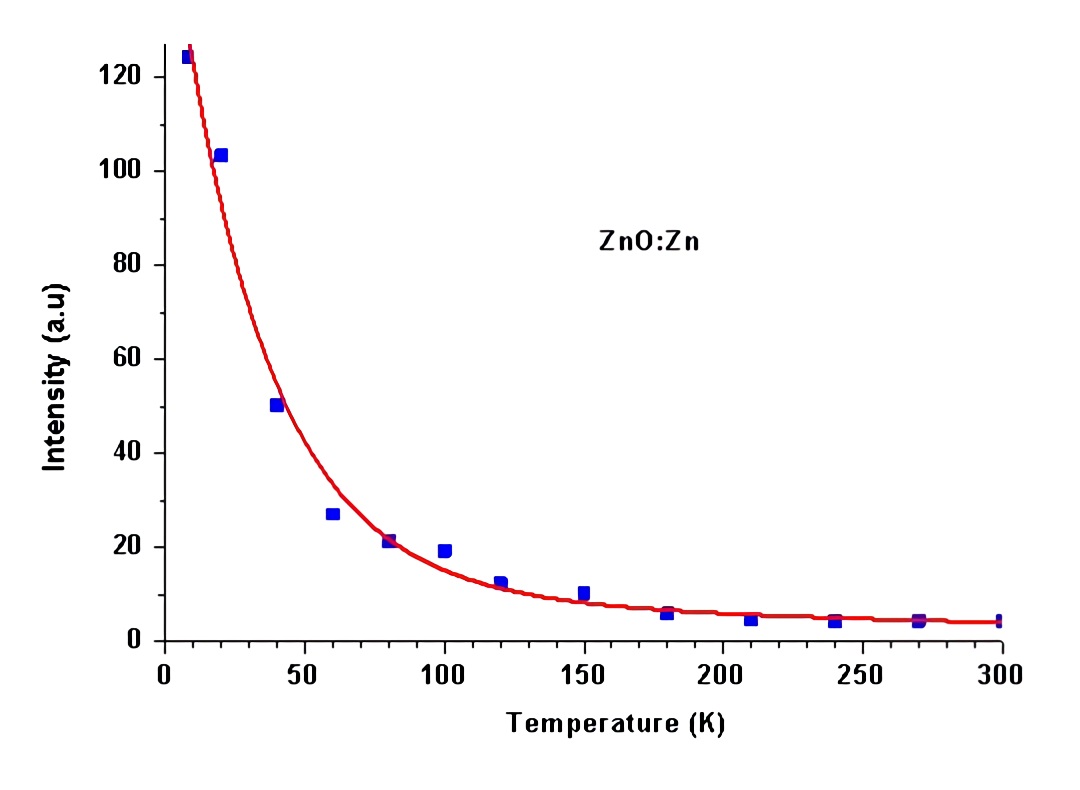
Strong sharp lines were observed in the ultraviolet for the ZnO samples, as shown in Figure 5. The valence band is formed by p electrons. The p-state is an orbit-triplet, corresponding m = 0, (1. Due to both the spin-orbit interaction and crystalline field effect, the p valence band is split into three sub-bands with band maxima (7, (9, and (7 at the zone center. The energy separation between the sub-bands are (79 = 0.007 eV and (97 = 0.017 eV, respectively. Based on this knowledge, the three sharp lines at 368.8 nm (3.361 eV), 368.1 nm (3.368 eV), and 366.2 nm (3.385 eV) are assigned to a bound exciton, the recombination of shallow donors (D0, x) with holes in the three sub-valence bands. The progressively weaker lines at the longer wavelength side, 374.3, 382.7, 385.2 and 391.2 nm are likely due to the phonon replicas of the excitons. With increasing temperature, the intensity of the exciton lines decreases quickly (Figure 6) which can be expressed as Eq. 1 as a result predicted by a configuration coordinate model 20.
4. Conclusion
ZnO:Zn is a wide band gap semiconductor, with broad band emission at 520 nm at room temperature. The source of the green emission is due to oxygen vacancies, which are located above the valence band and serve as deep hole traps or acceptors. These oxygen vacancies can be estimated to be 0.8 eV above the valence band. At low temperature, the broad band emission shifted to the higher energy side from 548 nm at 8 K to 525 nm at 295 K. It could be due to the local field, of electric dipoles, the orientation of which is strongly temperature-dependent. Strong sharp lines were observed in ultraviolet and are assigned to bound excitons. Phonon replicas of the excitons were also detected.

