


 English (pdf)
 Article in xml format
 Article references
 Send this article by e-mail
 Cited by SciELO
  Cited by Google
  Similars in
SciELO
Similars in
SciELO  Similars in Google
 Permalink
1. Introduction
In the last decades, there has been an increase in the production of the pharmaceutical industry due to the strong demand exerted by human and veterinary medicine, which has generated that more and more amounts of antibiotic residues are found in wastewater and natural 1, because these drugs are excreted and later transported to receiving water sources. Although at present the full effects of these drugs on aquatic ecosystems and for human health are not known, it has been shown that, although these drugs are found at trace levels in different water sources, they can generate persistence chemistry, microbial resistance, and synergistic effects as a consequence of the numerous antibiotics present 2.
The global market for animal antibiotics and antimicrobials is estimated to grow at a compound annual rate of 4.6% from 2016 to 2021 to reach USD 4.73 billion by 2021 3. Because antibiotics pass through the animal and end up in manure, animal production farms are a major source of environmental contamination with resistant antibiotics and bacteria. The use of antibiotics in animals is not the problem, it is their abuse, since in the whole world up to four times more doses of antibiotics are applied to animals than humans and in many cases animals are subjected at high doses of antibiotics, even if they are not sick, this as a preventive measure 4.
The wide range of applications and the type of diseases treated make phenicols, such as florfenicol, extremely important agents for veterinary medicine, being used as an antibiotic for poultry, cattle, goats, equines, rabbits, sheep, fish and swine 5. Florfenicol is characterized as a broad spectrum bacteriostatic, effective against various fish pathogens and control of bacterial infections of the respiratory tract in cattle and pigs 6. This drug is characterized by high bioavailability, good tissue penetration, and rapid clearance 7. Finally ending in various water sources.
In Colombia there are controls regarding the use of antibiotics as growth inducers in the pig and livestock industry, however, regarding the commercialization of antibiotics for veterinary use, there are no restrictions, so in some cases the supply is empirical and without formulation of the veterinarian. Likewise, there are many fish farming centers to market a great variety of fish, and in which several antibiotics are used, including florfenicol 4.
Oxytetracycline and florfenicol are two of the most widely used antibiotics for the control of bacterial diseases in fish 8-11, Carraschi et al. 8 monitored florfenicol in 8 effluents from animal farms, 18 river water samples, and 8 fish pond water samples, detecting averages of 0.95, 2.40, and 2.84 μg / L, respectively. As the waters of the ponds of the fish farming centers carry florfenicol residues that are dumped into rivers, the environmental authorities in Colombia require these fish farms to treat these waters, with the advantage that the vast majority of fish farms are in rural areas, where they have extensive lands, which facilitates the treatment of these waters with subsurface constructed wetlands. It has been shown that some antibiotics are not totally removed from wastewater treatment plants with primary treatments, since a great variety of drugs have been detected in the effluents of these plants in the order of ng / L to mg / L 12. Because of this, the removal of these drugs depends on the implementation of secondary and tertiary treatment. One of these mechanisms corresponds to artificial wetlands, which are effective, low-cost, simple-to-use treatment systems that have shown high removal of pharmaceutical products 13-15 and have additionally been used for water treatment. fish farm residuals 15-17.
The present study evaluated the behavior and inhibition processes of microorganisms in the removal of florfenicol and organic matter, using horizontal flow subsurface wetlands at a pilot level, through an analysis of physicochemical parameters in the tributary and effluent, in situ parameters, microbiological and adsorption analysis on both gravel and planted plant material.
2. Methodology
2.1. Subsurface horizontal wetlands
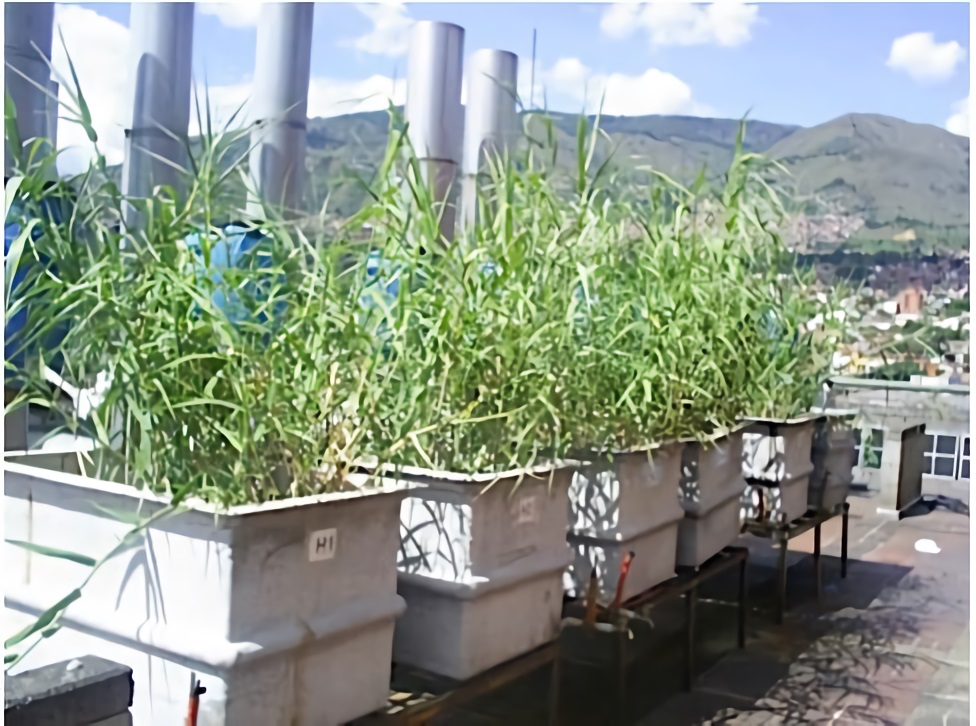
Five horizontal subsurface flow wetlands (HSFS) were used (Figure 1), constructed of fiberglass tanks with dimensions of 0.6 m wide x 0.6 m high x 1.0 m long and a water depth of 0.30 m. A layer of gravel from 1/4 "to 1/8" was used, with a uniformity coefficient <1.70 and a specific gravity of 2.5, and piezometers were installed both at the beginning and at the end of each module to take samples of gravel and to perform microbiological analysis of the biofilm. The wetlands were planted with the macrophyte Phragmites australis and supplied with synthetic wastewater and different concentrations of florfenicol (FLO) continuously using a flow rate of 6.3 cm3/min controlled with flow meters and a hydraulic retention time (HRT) 4.2 d.
The composition of the synthetic water was calculated according to the formula proposed by Dangcong et al. 18, to simulate wastewater at the laboratory level. The final proportions were; 0.25 g/L C6H2O6, 0.16 g/L NH4Cl and 0.03 g/L KH2PO4. The pH in the tributary was maintained in a range of 6.5 to 7.5, by adding HCO3 -. The research was carried out in the Pollution Diagnosis and Control Group (GDCON), belonging to the Faculty of Engineering of the University of Antioquia, located at the University Research Headquarters (SIU) in the city of Medellín.
2.2. Collection of experimental data
The start-up and stabilization time of the wetlands was 10 days; during which microbiological heterotrophs were sowed to evaluate the growth of microorganisms and determine the end time of stabilization, on the tenth day an important growth of these was evidenced to start the antibiotic removal process. During the start-up and acclimatization period, only synthetic water without the presence of florfenicol was supplied for the five wetlands. After the acclimatization period, FLO concentrations were supplied to each wetland, for a period of 30 days, using values of 10, 15, 20 and 25 mg/L for wetlands H1, H2, H3 and H4 respectively and only water synthetic (0 mg/L FLO) for the H5 wetland used as target, additionally, this last wetland only operated with gravel, without the presence of planted macrophytes, in order to determine if the vegetation had an impact on the degradation processes of organic matter and the effect of other variables analyzed. Samplings were carried out every two days, both in the affluent and in the effluent of each of the installed wetlands in order to evaluate their behavior and the efficiencies in the removal of both organic matter and the antibiotic. All analyzes were carried out in the laboratory of the GDCON group, an accredited laboratory for water analysis by IDEAM under the NTC-ISO / IEC 17025 standard, Resolution 1665 of July 12, 2011.
2.3. Physicochemical analysis
For the analysis of the in situ parameters, a WTW 3210 conductivity meter was used to measure the electrical conductivity (EC) and a WTW pH 7110 pH meter to read the pH and the Redox Potential (ORP). Additionally, the physicochemical parameters of Chemical Oxygen Demand (COD), Turbidity and Total Alkalinity (TA) were analyzed, following the analytical criteria of the Standard Methods 19.
2.4. Analysis by liquid chromatography
For the analysis of florfenicol (FLO), a 1100-1200 high-efficiency liquid chromatograph with diode array detector (Agilent Technologies) was used. The separation was performed on an analytical ultra IBD column 150 x 4.6 mm and 5 µm film thickness (Restek). The analytical column was kept at 30⁰C and the mobile phase was: solvent A (acetonitrile: methanol 9:1 at 0.1% in trichloroacetic acid) and solvent B (water grade HPLC at 0.1% in trichloroacetic acid), with a gradient that started with 60% of solvent B and 40% of solvent A, at 4 min; 40% of solvent B and 60% of solvent A. At a flow of 1.5 mL/min, 50 µL of sample was injected, and the diode array detector was used at 230 nm. The retention time of the FLO was 2.020 minutes. The quantification of the antibiotic was established through a calibration curve performed at concentrations of 5, 10, 15, 20, 25 and 30 mg/L.
The calculation of the removal efficiency of florfenicol was carried out using Eq. 1. Where, [FLO]I y [FLO]e correspond to the concentration of the FLO in the influent and in the effluent, respectively.
2.5. Microbiological analysis
For the microbiological analyzes, angeo bags packed with gravel were used located inside the piezometers (PVC tube perforated along the length) installed inside each wetland (Figure 2). 10 grams of the gravel extracted from the piezometers were taken and 90 mL of 0.9% saline solution (NaCl) were added, then they were placed in an ultrasound equipment (Elma, Ultrasonic LC 60 H), where the biofilm adhered to the gravel was laid off. The presence of heterotrophs in the gravel at the entrance and exit of each of the wetlands was evaluated, using the membrane filtration method with Plate Count Agar incubated for 48 hours at 35°C ± 0.5°C.

2.6. Inhibition test
The inhibition test was performed following the protocol described by Londoño et al. 20. Concentrations of 10, 15, 20 and 25 mg/L of FLO were prepared and an inhibition test was performed using Staphylococcus aureus ATCC 6538 (F3) (facultative bacteria) in nutrient agar and incubated at 35ºC ± 0.5 for 24 hours, then a phosphate buffer solution was clouded with the bacteria until it reached 0.5 on the Mcfarland scale. A swab was taken and immersed in the bacterial solution, draining the excess, turning the swab inside the tube, then covered in the Müller Hinton culture medium, making the bacteria evenly distributed on the Agar. After having the bacteria on the agar, two holes were made with the help of a previously sterilized punch. The sample was shaken vigorously and approximately 100 µL was taken into a syringe. This sample was filtered with a 0.45 μm nylon acrodisc and deposited in each of the wells made. The growth control of the procedure was a S. aureus strain in Müller Hinton, an environmental control that was carried out by opening a petri dish with culture medium in the laminar flow chamber for the duration of the procedure and a negative control using distilled water. All boxes were incubated at a temperature of 35ºC ± 0.5 for 24 h. After the incubation time, the inhibition diameter was measured, evidenced by the presence of a halo in which no bacterial growth was obtained.
2.7. Analysis in plant material
At the end of the experiments, a homogenization of the plant material of each of the wetlands that had contact with the FLO was carried out, divided into three segments: leaves, stem and roots, in order to analyze if the FLO was retained in any of the parts of the macrophytes, according to the methodology defined by Usuga et al. 21. To extract this antibiotic, 3 grams of each sample were taken in a 50 mL falcon tube and 10 mL of HPLC grade methanol were added, and it was stirred for 5 minutes. Later, tests were performed using the dSPE (Dispersive solid phase extraction) technique 22, with different cleaning methods. As a result, the best cleaning method was the one that contained 25 mg of PSA (for its acronym in English Primary Secondary Amine) and 150 mg of MgSO4, with average recovery percentages of 81.6%. The final extract was analyzed using a liquid chromatograph following the previously described methodology.
2.8. Statistical analysis
To observe the variation over time of the different parameters analyzed with the different wetlands, an exploratory analysis of the data, box and whisker plots, and correlations between the variables studied was performed. Results are represented as the mean ± standard deviation. Statistical analysis was performed using R software version 3.1.1.
3. Results and discussion
3.1. Behavior of physicochemical parameters
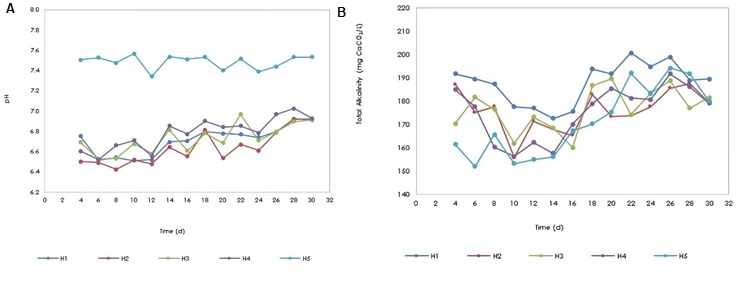
pH in biological systems is an important partameter because microorganisms have pH ranges where their development and growth are optimal, this value has been reported between 6.5-7.5 23, where values below 5.0 or above 8.0 usually inhibit the metabolism of microorganisms. In Figure 3a, behavior of the pH in the effluent of the 5 wetlands is shown, in this case, none of the pH values were below 5.0 or above 8.0, however, the pH ranges in the wetlands oscillated between 6.4 to 7.0 for wetlands H1, H2, H3 and H4 and for H5 it ranged between 7.3 to 7.6 showing a lower variation in pH in the wetland without plants and without antibiotics (H5) and in the other wetlands found a greater variation in pH and additionally lower ranges, indicating that not only the plants affect the dynamics of this parameter, but also the load of the applied antibiotic, with acidification processes predominant. In the case of vegetation, it affects the physicochemical parameters of the wetland due to the fact that cellular respiration processes increase where there is a greater consumption of CO2 and therefore a greater release of oxygen into the atmosphere 24, where by action of the aerenchyma; tissue through which oxygen is transported from the aerial parts to the root 25, some diffusion of oxygen towards the roots can occur 26, a phenomenon that favors the metabolism of aerobic bacteria, which take advantage of the available O2 to degrade organic matter to CO2, water and other inorganic compounds.
Alkalinity is an indicator of the buffering capacity of water to neutralize acids and is due to the presence of various components such as hydroxides, carbonates and bicarbonates. For this parameter, both the target (H5) and the rest of the wetlands (H1 to H4), had a similar behavior (Figure 3b), with values that ranged from 152.1 mg of CaCO3/L to 210.2 mg of CaCO3/L (p > 0.05). Alkalinity values increased in the last days of operation of all wetlands (from day 18), a situation that could be due to the adaptation of microorganisms and the balance and synergy between the CO2 consumed by the plants and the CO2 released by microorganisms.
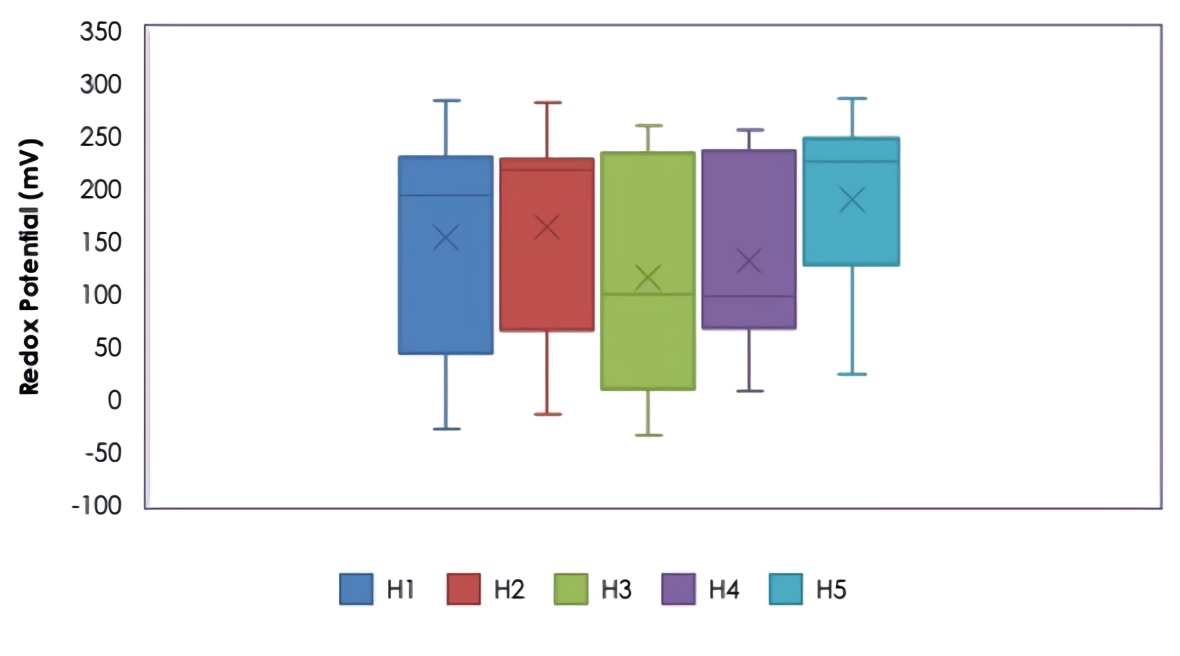
The redox potential is a measure of the activity of electrons. Any system with a high magnitude positive redox potential value (accepts electrons) is indicative of an environment that favors oxidation reactions. Also, a low magnitude negative redox potential value (donates electrons) is indicative of a highly reducing environment. Oxidation and reduction reactions regulate the behavior of many chemical compounds present in natural water bodies, in addition, the redox potential affects the distribution and metabolic activity of microorganisms. Figure 4 shows the variation of the redox potential in the effluent of the different wetlands, where variations were found between +282.30 mV and -34.12 mV and with average values of +153.66 mV for H1, +162.94 mV for H2, +115.92 mV for H3, +130.74 mV for H4 and +189.47 mV for H5, where the redox potentials were higher for wetlands with lower loads of florfenicol (H1, H2) and without florfenicol (H5), the latter being the highest average ORP found. Although there was no statistically significant difference (p > 0.05), between each evaluated florfenicol load and the redox potential, the ORP values were slightly lower for the highest florfenicol concentrations (20 and 25 mg/L), where denitrification processes (anoxic) could occur with nitrates as electron acceptors, this situation may be related to the molecular structure of florfenicol (C12H14Cl2FNO4S) which contains nitrogen, therefore, the higher the concentration of florfenicol in the medium, would expect a higher concentration of organic nitrogen due to the breakdown of the molecule during the degradation process, which would favor nitrification processes in a first aerobic stage and later denitrification in an anoxic stage with a decrease in oxygen present, which would explain the redox potential values found. Denitrification is a heterotrophic anaerobic respiratory process of the anoxic type, where the reduction of nitrate to N2 follows a series of steps that involve the activity of different enzymes. This process originates after the ammonium is oxidized to nitrate, then the latter is reduced to N2 (nitrogen gas) 27.
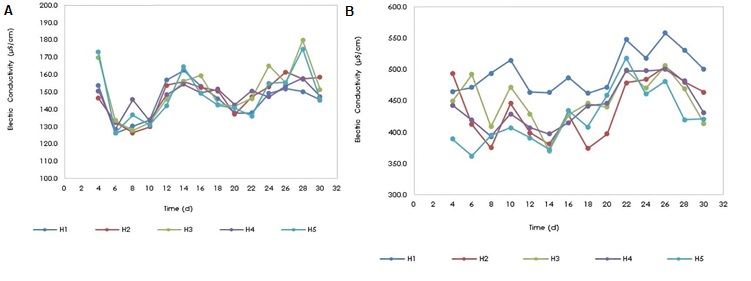
Electrical conductivity is the measure of the ability of water to conduct electricity, which is due to ions in solution, therefore, increasing the concentration of ions causes an increase in conductivity. In the wetlands, the electrical conductivity in the tributary (Figure 5a) and the effluent (Figure 5b) was monitored and it was evidenced that the electrical conductivity in the effluent of all monitored wetlands was higher than in the tributary, where the conductivity it ranged between 179.80 µS / cm and 126.20 µS/cm and that of the effluent between 558.00 µS/cm and 362.00 µS/cm. This increase could be due to the degradation process of organic compounds from synthetic wastewater and florfenicol, which due to biological degradation give rise to the formation of soluble inorganic species, which increase electrical conductivity. Florfenicol contains chlorine, phosphorus, nitrogen and organic sulfur in its molecule, which, when undergoing a biological degradation process, give rise to the formation of chloride, fluoride, ammonium and sulfate ions, and that is why the H5 wetland, which no antibiotic was added, it presented a lower electrical conductivity (absence of the ions from florfenicol mineralization) in the effluent than that of the other wetlands.
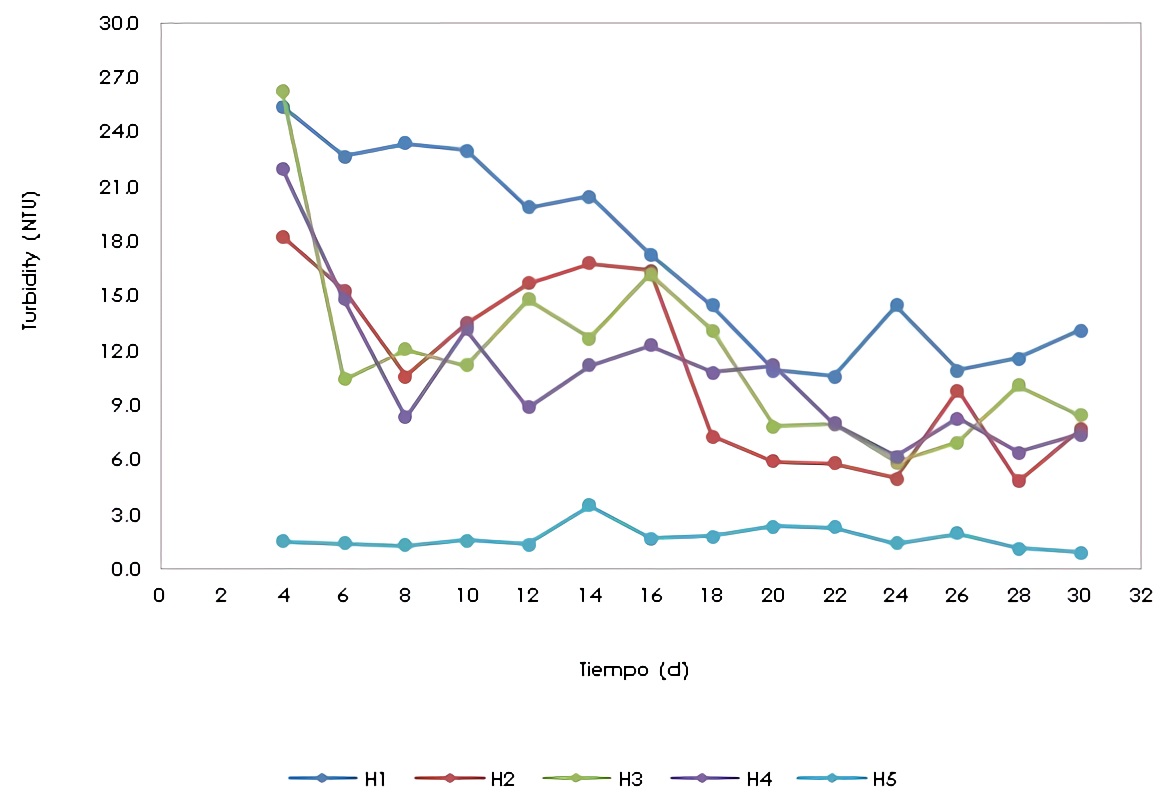
The turbidity in the effluents of wetlands H1, H2, H3, H4 varied significantly compared to wetland H5 (Figure 6). This could be a consequence of the presence of the plants (Phragmites australis) in the H1 to H4 wetlands and not because of the presence of the antibiotic, since the turbidity is affected by the suspended solids and/or colloids, which can be contributed by the plant roots. Turbidity ranged from 0.92 NTU as the minimum value for H5 to 26.30 NTU as the maximum value for H3.
3.2. Variation of removal percentages
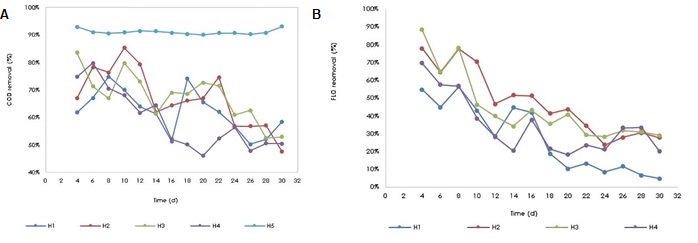
Removal percentages were calculated for both COD (Figure 7a) and florfenicol (Figure 7b) for each of the wetlands, in which a decreasing removal behavior was evidenced over time, with the exception of the H5 wetland (Control), where the COD removal was constant throughout the monitoring time. The COD is made up of 2 fractions; one corresponding to the biodegradable fraction (determined as BOD5) and the other non-biodegradable. The one that is removed in a wetland by microorganisms is the biodegradable one, but the non-biodegradable fraction could also be removed by precipitation, adsorption processes (on gravel and plant roots) and by absorption through the roots. The similar behavior regarding the removal of COD and FLO indicates that there is a common point that may be the inhibition of microorganisms after a certain time, causing the degradation of the antibiotic and other compounds that contribute COD to synthetic water to decline. Therefore, by exposing microorganisms for long periods of time to florfenicol, its bactericidal activity may have acted on the microbial population of the wetland, which generated inhibition in microorganisms, decreasing the efficiency of this treatment system after a certain time. According to Figure 7, the concentration that was used in H4 (25 mg/L FLO) strongly affected the microbial population, and this resulted in lower removal percentages of both florfenicol and COD. The concentration applied in the H2 wetland (15 mg/L FLO) favored the removal of both florfenicol and COD in the first days, indicating that for this concentration, microbial inhibition did not occur, and on the contrary, the microorganisms used florfenicol as a substrate for its metabolism, however, at the end of the treatment a slight inhibition begins to be noticed. The concentration evaluated in the H1 wetland (10 mg/L of FLO) had a lower degradation kinetics than H2, this is due to the higher concentration of substrate, higher degradation kinetics. Comparing the removal of COD in the white wetland (H5), it is verified that florfenicol does influence the degradation kinetics of the synthetic water components and that in the long term it is possible that the microbial population present in the wetlands is affected from continuous exposure to florfenicol. The wetland that obtained the best FLO removal percentages was H2, with a maximum percentage of 77.9% and a minimum of 23.6%. The H1 wetland had the lowest removal percentages, with a maximum value of 56.4% and a minimum of 4.7%.
3.3. Inhibition analysis
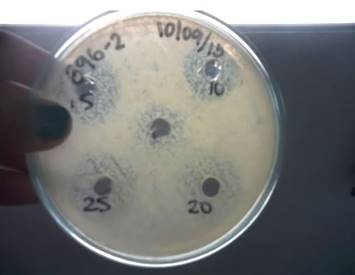
A minin inhibitory concentration (MIC) analysis (Figure 8) was performed, in which all the concentrations of florfenicol used in the research (10, 15, 20 and 25 mg/L) were analyzed, resulting in an inhibition minimal by the antibiotic for all concentrations evaluated; that is, the growth of the microbial population present in the wetlands was not significantly affected even with the maximum concentration evaluated (25 mg/L). These results are consistent with what was found in the removal percentages, where exposure to FLO in the first days resulted in high removal percentages, indicating little inhibition.
3.4. Plant material and gravel
During the acclimatization and stabilization stage and at the end of the tests, heterotrophic microorganisms present in the gravel were counted (Table 1), in order to determine the microbial population present in each of the wetlands and evaluate the initial conditions prior at the entrance of these and ends, resulting in a high count of heterotrophic microorganisms in all wetlands at the beginning of the trials, and a relatively low decrease at the end, especially in wetlands H1, H2, H3 and H4, indicating that the presence of FLO, affected the heterotroph population, as evidenced by the removal percentages found.
Table 1 Heterotroph counting in wetlands
| Wetland | Initial CFU/g gravel | Final CFU/g gravel |
|---|---|---|
| H1 | 3.40 x 10⁵ | 3.01 x 10⁵ |
| H2 | 2.80 x 10⁵ | 1.80 x 10⁴ |
| H3 | 2.60 x 10⁵ | 1.30 x 10⁴ |
| H4 | 2.50 x 10⁵ | 2.10 x 10⁴ |
| H5 | 3.50 x 10⁵ | 2.20 x 10⁴ |
An analysis was carried out on the gravel at the end of the study, in which this granular material was extracted from the wetland with the highest concentration, and was placed under constant stirring for 1 hour with HPLC grade methanol, in order to extract all the FLO that was Present. The results showed a FLO concentration lower than the limit of quantification (< 5 mg/L). Therefore, it could be ruled out that the FLO is interacting with the gravel (adsorption-desorption), to the point that it has accumulated. Likewise, the plant material was analyzed at the end of the tests, the results, as well as the gravel, gave lower than the quantification limit (< 16.67 mg/kg) in all the wetlands (H1, H2 H3 and H4) and in all the parts of plant material. For this reason, it can be inferred that the FLO was not retained in some part of the macrophytes.
4. Conclusions
The decreasing behavior in the removal of florfenicol and COD was associated with a long-term inhibition of bacterial growth due to a prolonged exposure of the microorganisms to the antibiotic analyzed, where the wetland with the best removal of florfenicol was H2 ( 15 mg/L FLO) with a maximum of 77.9% removal the first days and a minimum of 23.6% after 30 days of operation of the wetland, therefore, it is concluded that when exposing the microorganisms to florfenicol, for prolonged times, inhibition processes occur, which reduces the removal efficiency of these processes and makes it necessary to couple this type of low-cost technologies with advanced processes that allow reducing the pollutant load prior to entering the wetland. The results found, allowed to show that florfenicol was not retained in the granular material of the wetlands, nor in the macrophytes, that is, no adsorption processes occurred, and that the predominant removal mechanism was biological degradation. The presence of plants in the wetlands (Phragmites australis) increased the turbidity in the effluents, due to the release of suspended solids and/or colloids, while the electrical conductivity in the effluents of the wetlands increased as a consequence of the biological processes carried out. carried out within these systems, in which organic matter is transformed into inorganic compounds. Finally, synthetic water with and without florfenicol had no relevant effects on pH and alkalinity, which was due to the buffering capacity of these treatment systems.

