


 English (pdf)
 Article in xml format
 Article references
 Send this article by e-mail
 Cited by SciELO
  Cited by Google
  Similars in
SciELO
Similars in
SciELO  Similars in Google
 Permalink
1. Introduction
In Colombia, the water consumption needs of the urban and rural population are not satisfied equitably at 100%, due to different migratory, anthropic, and planning factors, affecting the country's development in health, infrastructure, education, and agricultural projects, among others 1. Paipa is a municipality in the department of Boyacá located in the central-eastern zone of Colombia, whose productive sector is focused on tourism and agriculture for the supply of food such as potatoes and onions in the country.
In Paipa Boyacá, there are 32 aqueducts in the rural area, which respond to organizations that have appeared because of the need to have a basic service of drinking water supply for the communities. In the village El Tunal, which is located south of the town of Paipa, there is an aqueduct of these characteristics in operation, so people have access to drinking water.
The main source of water supply in the rural zone of the municipality is by superficial sources of water, coming from near gorges that diminish their volume in times of drought, gorges that are born in fragile zones and exposed to processes of deforestation, reason why some aqueducts have initiated to acquire these territories to protect and to conserve the hydric rounds, as it is the case of the village El Tunal.
Other risks associated with the deterioration of basins and sub-basins is the advance of the agricultural frontier that is associated with the uncontrolled use of pesticides and fungicides, which not only ensure the reduction of the resource but also the contamination of water 2.
1.1. Research Problem
In the southern part of the municipality of Paipa, Boyacá, the village of Tunal has problems in the supply of water in the dry season, due to the location in the upper part of the mountain where the processes of transport to the upper basin where the population lives are difficult. The current demand for the system is 126,881 liters per day, according to the updated data of the population in the year 2019 3. The increase in consumption generates pressure losses in the system, generating in dry seasons a scarcity of water resources due to lack of pressure, as well as high costs for having the pumping system constantly turned on. For this reason, a diagnosis of the supply system must be made regarding the pressures to be overcome by height, friction, accessories, according to the diameters and pumping system currently used. In this way, a proposal can be made for optimization according to the current needs of pressures and flows.
The inhabitants of the region have requested financial resources from the state and the competent government authorities, however, the assistance received has not been enough. The community had to organize itself by assigning a "water president", who oversees administering the village aqueduct. In times of drought, the main source of water resource (a freshwater spring) decreases, so it is not enough to cover the demand of the village, so the community managed to capture water from a wetland in the lower part of the basin, where there is a distribution system by a pressurized network that has two pumps, three storage tanks, and electric power. The community claims that the energy costs are too high.
By having clarity on the unsatisfactory situation of the population, an ideal scenario can be established for the community, which would be, to have an efficient and economically viable supply network, which covers the needs of people in the low season. It is intended then, to propose a redesign of the water supply network, using the hydrological information of the area using geographic information systems, so that the system can be optimized employing hydraulic simulation of pressures for the different scenarios, current and the proposal to corroborate the information.
2. Methodology
2.1. Phase I. Initial Diagnosis of El Tunal Aqueduct
For the diagnosis of the work area, four technical visits were made in August and September 2018, where a GPS (Global positioning system) was used to position the points of interest in a coordinate system. Data was taken on the geopositioning of the three supply tanks, storage capacity, water demand, existing pumping systems, the elevation of the points above sea level, supply system problems counted by the president of the water supply.
In order to evaluate the efficiency of the current water supply system, an analysis of water supply and demand was carried out, using the number of inhabitants that make use of this aqueduct. The President of Water was consulted, and the result is that there are currently around 984 inhabitants in 2019. To calculate the demand for water resources, the Technical Regulation of the Potable Water and Basic Sanitation Sector - Resolution 330 or RAS 2017 - was used. 4, where the net endowment of hot and temperate-cold climates is contemplated. This data is used to find the water demand for the El Tunal village. To calculate the supply of the resource in El Tunal, the supply system, pipe diameters, pumping systems and topography were reviewed to verify the hydrology of the system, to make a proposal tailored to the territory.
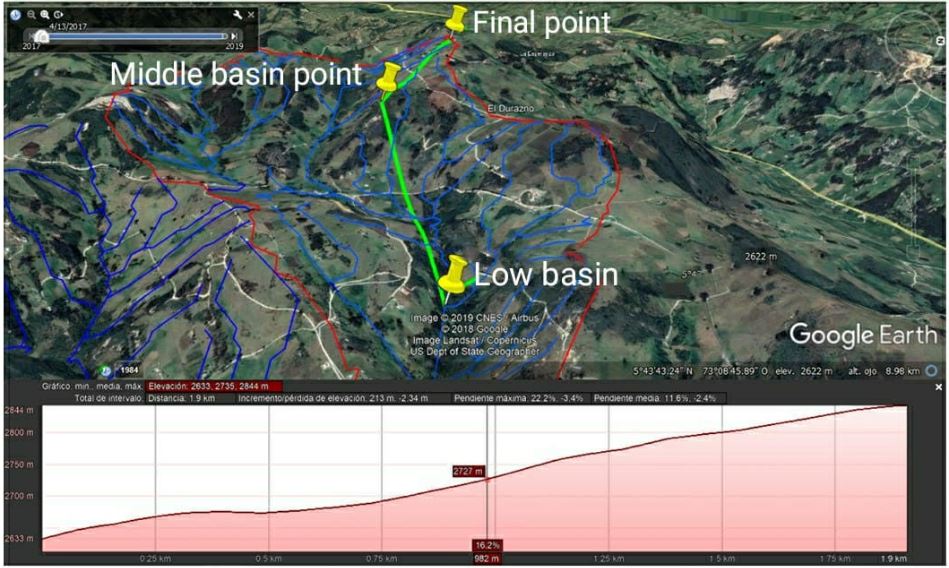
Figure 1 shows the elevation profile of the current aqueduct line, which is divided into the initial or intake point, an intermediate discharge point to some residents, and a final discharge point where the largest amount of population is located.
2.2. Phase II. Information Processing
The relevant calculations are then made, as opposed to obtaining data on the capacities or limitations of the system and the population. These data offer a projection of the needs and opportunities for enhancement. To begin with, a population projection was made to find the future demand of the design flows. Chapter 2.3 was used for the methods of calculating the population projection of the Technical Regulation of the Water and Basic Sanitation Sector - RAS 4, using the geometrical method which was best suited to the growth behavior of the population according to Eq. 1:
Where:
𝑟 = Annual growth rate in decimal form.
𝑃𝑓= Population corresponding to the year for which is wanted to make the projection (inhabitants).
𝑃𝑢𝑐 = Population corresponding to the DANE projection (inhabitants).
𝑃𝑐𝑖 =Population corresponding to the initial census with information (inhabitants).
𝛵𝑢𝑐 = Year corresponding to the last year projected by DANE.
𝛵𝑐𝑖 = Year corresponding to the initial census.
𝛵𝑓 = Year to which you want to project the information.
The annual growth rate is calculated in the following way using Eq. 2:
It was decided to make a 30-year design projection (2019-2049), with the data from the water president's census, as this is the only existing data.
The population, being very specific, is not in the DANE data, however, the data of inhabitants that benefit from the water resource distribution system or aqueduct were obtained from the survey directed to the community managers to have the current data. The growth rate was calculated based on the census of the president of water for 2019 3. With this methodology, we projected and found the population that benefits from the water distribution system or aqueduct, until the year 2049.
We proceeded with the hydrological study of the area (village el Tunal, municipality of Paipa), which was carried out through the study of a digital elevation model (DEM) obtained from the AlosPALSAR database, the most accurate free topographic mission of 12.5 meters in length per pixel 5.
To process the DEM, the Arc Gis version 3.5 software was used along with its HecGeoHms add-on, obtaining, as a result, the water direction layers, basins, sub-basins, flows and main drains.
The resulting layers were added to the Google Earth Pro software version 2019, to join them with the coordinates of the stations of the system presented in Phase I, to have a better and more accurate approach to the terrain and its real conditions of coverage.
With the data of precipitation, catchment areas result of the layers and the rational method Equation 3, a design flow was calculated, according to the methodology of the Technical Service Norm NS-085 of the EAAB 6, for it the data of precipitation of the IDEAM meteorological station nearest to the study zone was organized, with the name "Tunguavita Meteorological Station" 7, located approximately to 4.3 km of the study zone (village el Tunal) from the year 2004 to 2019. With these data, the annual average, daily average, maximum value, minimum value, and the days of rain per year were calculated.
With the previous information, the design flow was found; the "rational method" of the Service Technical Standard NS-085 of the EAAB 6, was used, which consists of the following equation corresponding to the rational method, Eq. 3:
Q= Estimated water discharge at a given site (L/s).
𝐶= Runoff coefficient (non-dimensional).
I= Rain intensity, for a duration equal to the concentration time of the drainage area and for the determined return period (L/s/Ha).
𝐴= Drainage area (Ha).
For area (𝐴), the place that refers to the reservoir to be proposed was taken, the HecGeoHms tool allows to measure the area, slope and all the hydrological variables of the basin, information directly with the technical norm NS-085 6 to assign a value to the runoff coefficient (𝐶) to obtain a quantity of usable water each month with the average monthly precipitation of the nearest meteorological station. For the rainfall intensity value (I), normally it is found with the different statistical methods to find the IDF curves, however, for the present article, the multiannual average monthly precipitation values of the "Tunguavita Weather Station" are taken directly, to have a usable amount of water in liters in each month to contrast with the consumptions and to know in which months a deficit can exist and also to plan the way to supply the population during these water deficits.
Through the HecGeoHms tool, the runoff flows are analyzed, and a point is located to locate the reservoir to be proposed. With this point, an analysis of usable water is made by taking out the amount of square meters of the basin and multiplying them by the amount of usable rain in liters/square meter, taking into account an estimate of the infiltration and runoff from the soil information provided by the IGAC 8 for the area of study.
For the analysis of the water demand, with the future population obtained in the population projection, and its net endowment according to the national regulation Decree 330 (RAS 2017) 4.
With the two values and the population's consumption trends, obtained by the president of water, we then have a table of supply and demand. The supply is subtracted from the demand, thus obtaining negative values when there is a deficit and positive values when there is a surplus to evaluate whether the catchment area of the new reservoir according to the hydrological study and the usable water obtained from the reservoir basin to be proposed can be seen if the proposal is viable in terms of the amount of water to supply the population's demand.
2.3. Phase III. Proposal for the enhancement of the supply system
The information of the previous phases is used, to find the requirements for the energetic and hydraulic improvement of the system, analyzing the viability of technical implementation for the water supply system or aqueduct of the Tunal village.
It was begun to calculate the requirements for the improvement of the storage systems analyzing the quantity of water in excess or deficit every month, with this information it is proceeded to propose a reservoir to store the water in a high point of the basin, near the population to diminish the costs of pumping, assuring through the hydrological analysis that the captured water is sufficient to supply the population in the drought season, improving this way two of the problems identified in the supply system that are the shortage and the high costs in the necessary energy for the distribution system.
With the help of the Pipe Flow Advisor software version 2009, the necessary dimensions for the efficient storage of rainwater were calculated, then the different types of materials for the reservoir were evaluated and the Google Earth Pro software was used to define its geographic location so that it has the characteristics mentioned above.
For the diagnosis of the supply system, in the hydraulic part, the current conditions of the pipelines of the village aqueduct, lengths, pumping systems, accessories, diameters, heights to overcome, materials, among others, are considered. To make a modeling of the hydraulic system, the Pipe Flow Expert software version 7.3 is used, where the characteristics and hydraulic parameters of the distribution system can be modeled and observed. Therefore, the flow speed that must be greater than 0.6 meters per second and, if possible, not exceeds 1.2 meters per second is of main interest, to avoid excessive losses by friction or accessories that would lead to excessive use of electrical energy to overcome them.
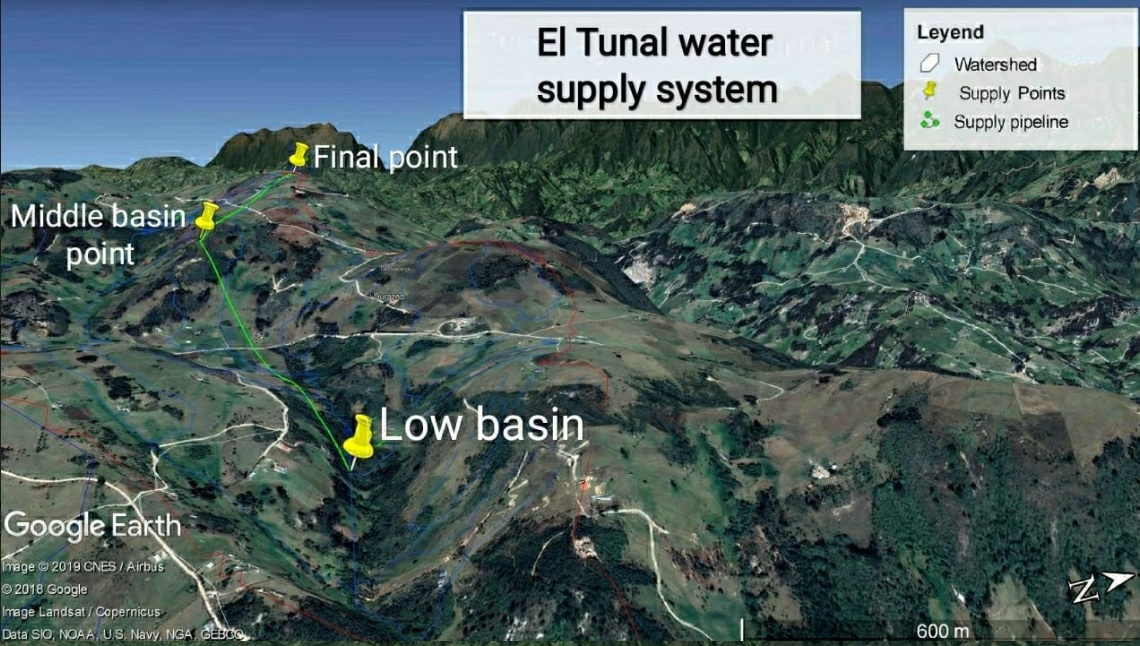
Geographic information systems are used to analyze slopes, lengths, and other variables that influence the analysis to give an accurate diagnosis, as shown in Figure 2.
3. Results and Discussion
3.1. Studies on village aqueducts
In the work of degree titled "Proposal of operative technical improvement to the aqueduct Servimazatas village Riofrío western Tabio, Cundinamarca", a change of the supply source is proposed because the river of which it is supplied does not satisfy the demand, the work is of extreme importance since it does not only emphasize in the amount if not that the complete project includes the phases of potabilization of water that becomes necessary like later phase to the present process in Paipa 9.
According to the inventory "Inventory of supply sources of the aqueduct systems of the municipal heads of Colombia", we were able to see what 39 municipalities are supplied with subway water, in Cundinamarca 7, Antioquia 6, Sucre 5 and Boyacá 4, an interesting conclusion and that by establishing the reservoir in Paipa a mixed system can be used involving surface and subway water if required 10.
In the proposal "Hydrological analysis of the Calandaima river basin and hydraulic modeling for the water supply system for the San Antonio village in Apulo Cundinamarca", in this study, a design was made for the water intake of the Calandaima river for the supply of the population in the high part of the mountain, the quality of the water of that river is not good, it is concluded that with the selected system, the speed, losses and pressures of arrival are acceptable, from modeling in Pipe Flow expert 11.
The article "Dimensioning of canals and reservoirs to conduct and store rainwater to supply the population of Alto de Cazucá (Soacha-Colombia) using D.E.M." Flooding can be avoided in the lower part of the river by using rainwater in towns that require this resource in the upper basin. 12.
The study "Proposal for rainwater storage to supply the municipality of Alban using HEC-GeoHMS" concludes that with computer tools it is possible to study the terrain and hydrology of certain locations; therefore, they should be used to provide water to populations in the upper basins and to help these rural populations have access to the resource 13.
3.2. Identification of the work area and main points
A technical output was carried out in September 2018; with a GPS (Global Positioning System) where 3 strategic points were identified, to carry out the analysis, these points are the initial water collection point, which corresponds to the lowest point of the system, an intermediate point where water supply is given to a part of the population and a point 3 that corresponds to the highest point of the whole system, which has the highest demand of water for a total of 984 inhabitants, data obtained in field in an interview directed to the president of the water of the village El Tunal.
The first storage and pumping point (initial capture point) with coordinates 5°42'49.20 "N; 73°7'28.09 "W, has a storage tank of 72 m³ at an altitude of 2642 MAMSL, has a Hidromac VVKL 40/6 pump, which pumps water at 133 meters high to reach the second water storage and pumping point (Point 2) with coordinates 5°42'37.57 "N; 73° 8'6.64 "W, which is at 2775 MAMSL, in this station, there are two storage tanks, one of 36 m³ and one of 72 m that supplies 29 points.
Once in this (Point 2), the water is driven by a multi-stage IHM iron pump, which moves the water another 68 meters of height since the third storage point (Final Point) is located at an altitude of 2843 MAMSL, with coordinates 5°42'45.69 "N; 73° 8'25.17 "W, which has a storage tank, with a capacity of 146 m³, which supplies around 200 points employing gravity pipes.
3.3. Collection of information from the distribution network
3.3.1. Hidromac VVKL 40/6 pressure pump
It is the first pump of the supply system; it is located at point 1 and drives the water at 144 meters of height towards point 2. The performance curve of the pumping system was found in a manual, having a dynamic height of (133 m) with a capacity in terms of the flow of 90 gallons per minute with a power of 25 HP.
3.3.2. Iron multistage pressure pump IHM VL-180V-5.0T (Ignacio Gómez IHM S.A)
It is located at point 2, it pushes the water 70 meters high to the end point. During the technical visit, the model (VL-180V-5.0T) could be identified, the manual was searched, and the performance characteristic curve was found, with a capacity of 25 gallons per minute and a power of 5 HP.
3.4. Analysis of the population in the village of El Tunal
This section analyzes the supply of rainwater in the area of study and the demand of the population, to be able to know when there is a surplus and when it is theoretically necessary, following design norms present in the regulations of the country's drinking water sector, as well as the technical norm of service of the Bogotá aqueduct NS 085 6 for calculating the flow of rainwater in a basin.
Offer:
The calculation of the rainwater supply in the village El Tunal varies depending on the precipitation and its variation during the year.
For the year 2019 there is no supply of the water resource in the point "Laguna Rica", therefore, only the flow of the point "Ojo de agua" is used, this average flow was obtained consulting the technical expert that manages the system of the aqueduct of the community, according to the expert, this supply flow is of 60.480 liters per day.
Not having the certainty of data of the water supply of the zone, it becomes necessary to make a hydrological estimation of the exploitable flow in the basin according to the catchment area of the basin, the slope, the type of coverage and the average annual precipitation of the nearest meteorological station.
Demand:
To estimate the water demand, chapter "2.5.2" Net allocation per inhabitant" of the "Technical Regulations of the Drinking Water and Basic Sanitation Sector - RAS 4; Title B General aspects of the aqueduct systems" of the year 2010 and Resolution 330 of the year 2017 with its respective modifications were taken as a basis. According to the guidelines of the SAN, the classification of the complexity level of the supply system of El Tunal is Low, since the population of El Tunal is less than two thousand five hundred inhabitants (<2500 inhabitants), likewise, in the same resolution, there is a table of endowment according to the height in meters over the sea level that is observed in Table 1.
Table 1 Maximum net allocation per inhabitant according to the height above sea level of the area served. 4
| Average height above sea level of the area served | Maximum net allocation (L/inhab*day) |
|---|---|
| > 2000 MAMSL | 120 |
| 1000 - 2000 MAMSL | 130 |
| < 1000 MAMSL | 140 |
In the net endowment column, the municipality of Paipa is located at an altitude of 2525 MAMSL, therefore, it is classified as a temperate and cold climate. Therefore, the value of ninety liters (120 L) is taken for the net endowment of each inhabitant per day.
The population served by the aqueduct of El Tunal, according to the survey to the president of the communal action board and the president of the water of the community, where he informs us that 984 inhabitants make use of this aqueduct.
By multiplying the number of inhabitants with the demand per inhabitant, we find that the demand for water per day is 118,080 liters.
If to the latter of water demand per day of the population, we subtract the flow of water supply in the study zone of 60,480 liters per day, it is evident that the lack of water in the village is 57,600 liters per day, a value that causes the deficit of water for the population of the village El Tunal.
3.5. Population Projection
Future population estimates are required to find future demand in a design stream. It is taken as the initial population value (984 inhabitants) data from the survey of water resource managers in the community. The geometric method is used for the population projection, with a design horizon of 30 years (2019-2049), according to the methodology 4. he annual growth rate (r) was calculated with the data obtained by the president of the water of the village in 2019, obtaining this way, a population in the projected year (2039) of 1057 inhabitants.
3.6. Hydrological study of soils using GIS software
To understand the hydrological behavior of the basin under study, specialized software in hydrological studies were used to obtain data that lead to making decisions such as rainwater flow direction in the basin, the catchment area of the basin, the topographic study of the basin, among others, which can be acquired by processing a digital elevation model (DEM) 14. These (DEM), are georeferenced topographic terrain models, downloaded for free that when processed in specialized software allows obtaining the above-mentioned results with acceptable accuracy for the type of study being conducted. For the present study, the (DEM) was downloaded from the United States Geological Survey database obtained in 2000 and published in 2014 15. This DEM was taken to software called SAGA Gis version 2019, to be processed to find the rainwater flow directions when falling to the ground and the water dividers in the sub-basins.
With this information, the analysis of supply for each month of rainwater was carried out, contrasting it with the population's demand to know how the supply system behaves during the year.
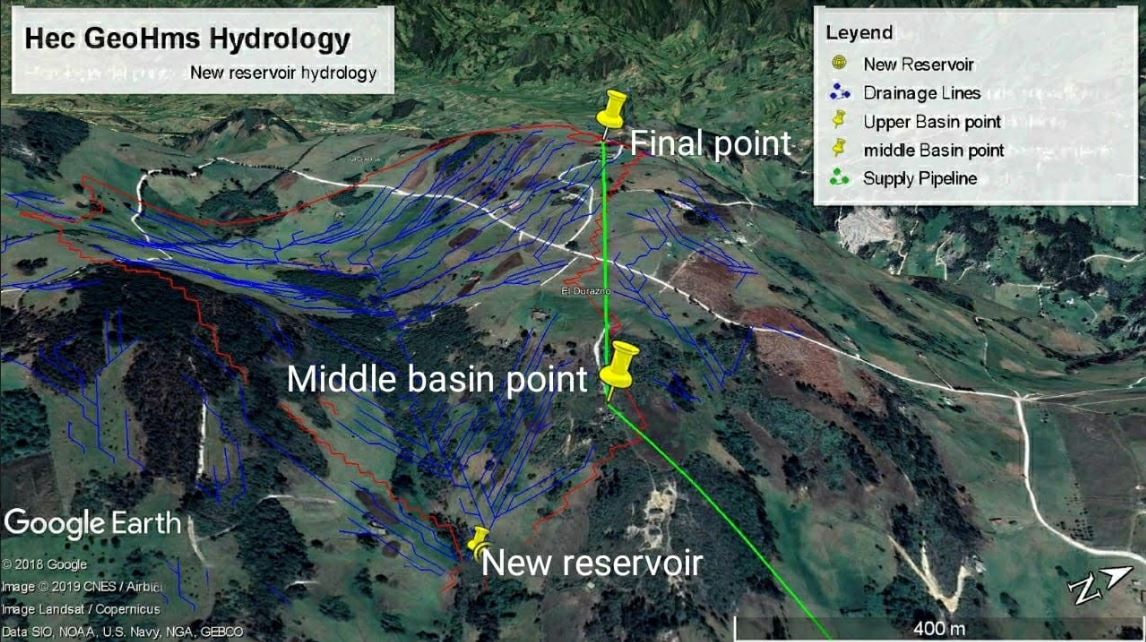
Likewise, the water flows in the basin were verified, to locate a reservoir with a considerable catchment area, besides being close to the highest supply point to reduce energy costs by pumping. Through the hydrological analysis of this new storage point, it was established whether or not it can supply the population with water under the rainy season 16, as can be seen in Figure 3 where the drainage network, the point of the proposed reservoir, the pipeline and water supply points can be seen.
3.6.1. Rainfall behavior
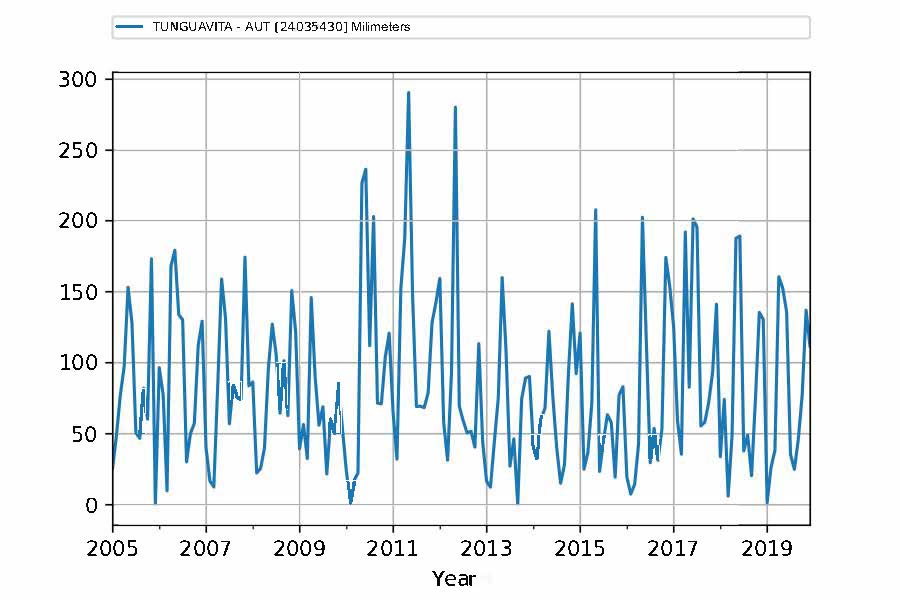
To obtain the precipitation data of the zone, the governmental entity in charge, requested the data of the meteorological station to the Institute of Hydrology, Meteorology and Environmental Studies (IDEAM), called "Tunguavita Meteorological Station" (Table 2). This meteorological station is located 4.3 km from the village of El Tunal. With the historical data of the annual average precipitation, they were organized from the year 2004 to 2019. With the information obtained, a table of monthly average rainfall was elaborated, for the identification of rainy seasons and dry seasons.
Table 2 Rainfall at study area Tunguavita weather station.17
| Month | Average monthly rainfall in liters/meter2 |
|---|---|
| January | 59.59 |
| February | 36.47 |
| March | 39.44 |
| April | 99.68 |
| May | 172.57 |
| June | 125.17 |
| July | 70.78 |
| August | 58.42 |
| September | 53.46 |
| October | 63.74 |
| November | 125.89 |
| December | 99.84 |
With the present analysis, we seek to locate a new reservoir that will allow the capture of rainwater by gravity, so that, by calculating the amount of water, according to the technical standard NS 085 6 that uses the rational method for areas smaller than 80 hectares. The analysis is performed employing the following steps:
Location of the reservoir so that it is as close as possible to the site of demand to reduce pumping costs of the system, the reservoir must be located over the direction of flow identified with the DEM to ensure that it fills by the action of gravity when precipitation occurs.
Find the catchment area upstream of the reservoir to estimate the amount of water that can be used for that projected reservoir.
Multiply the value of the area in square meters by the amount of rain in mm, which is the same as liters/square meter. When multiplied, the units are canceled, leaving the liters usable in each month.
Contrast the amount of usable water per month with the water demand of the estimated population of 1057 inhabitants, resulting from the population projection for the year 2049, taking the value of 120 L/inhab*day for the net endowment per inhabitant per day.
The control point was found, whose afferent area of the basin (A) is 47.15 hectares (471,593 m²), which refers to a water confluence point in the middle of the basin. With the Google Earth Pro tool, the slope of the area was calculated (over 7%), therefore, a value for the runoff coefficient (C) of 0.40 was taken according to Table 3. It is then multiplied by the average of each month from 2004 to 2019, from the precipitation data of IDEAM's Tunguavita weather station.
Table 3 Runoff coefficient according to slope and coverage NS 085. 6
| Surface Type | C |
|---|---|
| Covers | 0.90 |
| Asphalt pavements and concrete surfaces | 0.80 |
| Paved roads | 0.75 |
| Commercial or industrial areas | 0.75 |
| Residential, with adjoining houses, predominantly hardcore | 0.70 |
| Multi-family residential, with adjoining blocks and hard areas between them | 0.70 |
| Single-family residential, with adjoining houses and predominantly gardens | 0.55 |
| Residential, with houses surrounded by gardens or multifamily houses appreciably separated. | 0.45 |
| Residential, with predominance of green areas and cemetery parks | 0.30 |
| Unspoiled slopes | 0.60 |
| Hillsides with vegetation | 0.30 |
| Recreational Parks | 0.30 |
In Table 4, we found the usable flow (Q) for each month, additionally with the value of the monthly consumption, we found the difference, resulting in the amount of water in deficit or excess in each month, to know if it is viable or not the location of the reservoir in this area, for the results obtained, If the demand of the inhabitants for water for the supply according to the catchment area of the location of the reservoir, all values are positive, which indicates that it is theoretically feasible to locate a reservoir in this area, so that the rainwater collected according to the rational method, is sufficient for the supply of the population.
Table 4 Analysis of supply and demand for the population to be benefited
| Average monthly rainfall in L/m2 Tunguavita of IDEAM | Catchment Area (m2) | Runoff Coefficient Standard NS 085 EAAB | Water stored per month (L) | Estimated monthly consumption (L) | Difference between consumption and stored water per month (L) |
|---|---|---|---|---|---|
| 59.59 | 471,593.00 | 0.40 | 28,103,929.84 | 3,857,204.00 | 24,246,725.84 |
| 36.47 | 17,200,568.69 | 3,857,204.00 | 13,343,364.69 | ||
| 39.44 | 18,601,330.89 | 3,857,204.00 | 14,744,126.89 | ||
| 99.68 | 47,010,486.21 | 3,857,204.00 | 43,153,282.21 | ||
| 172.57 | 81,383,721.00 | 3,857,204.00 | 77,526,517.00 | ||
| 125.17 | 59,030,736.79 | 3,857,204.00 | 55,173,532.79 | ||
| 70.78 | 33,378,042.56 | 3,857,204.00 | 29,520,838.56 | ||
| 58.42 | 27,548,498.09 | 3,857,204.00 | 23,691,294.09 | ||
| 53.46 | 25,212,147.77 | 3,857,204.00 | 21,354,943.77 | ||
| 63.74 | 30,058,158.84 | 3,857,204.00 | 26,200,954.84 | ||
| 125.89 | 59,367,139.80 | 3,857,204.00 | 55,509,935.80 | ||
| 99.84 | 47,084,500.11 | 3,857,204.00 | 43,227,296.11 |
From Table 4, it can be established that the water supply is higher than the demand, using the established methodology, even in the driest season which is February with 13.3 million liters, being the demand 3.8 million liters, that is, the supply exceeds the demand by 3.5 times even in the driest season according to the average data of the 14 years of the IDEAM station, where the average data was obtained using Python processing codes. However, it is worth clarifying that this can be done with existing data, the spatial-temporal variability of rainfall can generate a variation in the data, however, since there is no more rainfall data near the project, the data from this IDEAM station is used in its historical 18.
When graphing the totality of data from 14 years of average monthly rainfall data, it gives, as a result, the trend of rainfall in the area, showing a slight increase in 2011 caused by the phenomenon of the girl that occurred in the country this year Figure 4.
3.6.2. Calculation of requirements for the enhancement of storage systems
With the data obtained from the surplus in Table 2, we propose the construction and operation of a reservoir to store rainwater from the months with high rainfall, to counteract the shortages that occur during the months of drought. The reservoir will be built with a 20 mm concrete layer, at the bottom of the reservoir a geomembrane will be adapted, avoiding the loss of the resource due to soil infiltration, and finally, there will be a superior polyethylene cover to avoid evaporation and possible contamination of the water resource. A reservoir of 6052.48 m³ is proposed, which is 1.56 times the value of water needed to supply the population which is 3857.204 m³. For the size of the reservoir, the software "PipeFlowadvisor" was used, from which it is obtained that the reservoir will have the following characteristics giving as result the Table 5.
Table 5 Characteristics of the reservoir.
| Type of structure | Rectangular Hopper |
|---|---|
| Material | Concrete |
| Material Density | 2400 kg/m³ |
| Thickness | 20 mm |
| Upper internal width: | 46 m |
| Upper internal length: | 46 m |
| Internal height | 5 m |
| Lower internal length | 34 m |
| Lower internal width | 34 m |
| Water depth | 4 m |
| Fluid volume | 6052.48 m³ |
| Volume of the material: | 39.15 m³ (concrete) |
3.6.3. Hydraulic analysis of the current supply system
The people of the village are not satisfied with the water service, due to the high costs of pumping and the deficit of water in seasons of drought, for this reason, we seek to make the analysis of the existing system, see its failures, and propose a viable alternative for the community so that it can have access to water. From the point of capture to the Intermediate point there are 1264 meters of pipe with a difference of level of 144 meters with a pipe of 2.5 inches of PVC to supply in the future to 300 inhabitants to 2039, to give a total necessity of water of 36,000 liters per day, if it is wanted to pump that amount of water in 3 hours, it would be a necessity of flow of 9000 liters per hour, with the software Flow Master version 2019, it is possible to be demonstrated that for these conditions, the losses by friction are of 157. 65 meters, having to climb 144 meters make the energy losses are high generating an excessive energy cost, caused by the diameter of the pipe of the second section which is 1.5 inches, but a considerable water flow is needed for the population of the upper basin, as can be seen in Table 6, where the elevation of the initial point must have an energy of 790 meters of water column to supply the system in terms of pressure and is what generates an excessive cost in the pumping system.
Table 6 Verification of diameter, speed and friction losses Flow Master of the current system.
| Pipe Id | Pipe Name | Material | Inner Diameter (mm) | Length (m) | Vol Flow (m³/s) | Velocity (m/s) | dP Total Loss (bar) | Entry Pressure (barg) | Exit Pressure (barg) |
|---|---|---|---|---|---|---|---|---|---|
| 1 | P1 | 65 mm PVC (ANSI) | 59.004 | 1264 | 0.0088 | 3.218 | -45.4912 | 0 | 45.4912 |
| Chlorinated Sch. 80 | |||||||||
| 2 | P2 | 40 mm PVC (ANSI) | 38.1 | 611 | 0.0063 | *5.526 (Flow Velocity is high) | 45.5187 | 45.4912 | -0.0275 |
| Chlorinated Sch. 80 | |||||||||
| Node Id | Node Type | Node | Elevation m | Liquid Level m | Surface Press. bar.g | Press. at Node bar.g | Demand In (Vol) @ Fluid Zone Density Downstream m³/sec | Demand Out (Vol) @ Fluid Zone Density Downstream m³/sec |
For the system to be proposed of the new reservoir, the distance becomes shorter and also the meters of water column to overcome, changing the pipe of the intermediate section at the end, from 1.5 inches to 2.5 inches reduces both the length and the friction to overcome caused by the reduced diameter, thus changing the required energy of 70 meters of water column for the energy of 197 meters of the water column, as can be seen in Table 7.
Table 7 Proposed system.
| Pipe Id | Pipe Name and Notes | Material | Inner Diameter (mm) | Length (m) | Vol Flow (m³/s) | Velocity (m/s) | dP Total Loss (bar) | Entry Pressure (barg) | Exit Pressure (barg) |
|---|---|---|---|---|---|---|---|---|---|
| 1 | P1 | 65 mm PVC (ANSI) | 59.004 | 262 | 0.0088 | 3.218 | -11.69 | 0 | 11.69 |
| Chlorinated Sch. 80 | |||||||||
| 2 | P2 | 65 mm PVC (ANSI) | 59.004 | 624 | 0.0063 | 2.304 | 11.6339 | 11.69 | 0.0561 |
| Chlorinated Sch. 80 | |||||||||
| Node Id | Node Type | Node | Elevation (m) | Liquid Level (m) | Surface Press. (barg) | Press. at Node (barg) | Demand In (Vol) @ Fluid Zone Density Downstream (m³/s) | Demand Out (Vol) @ Fluid Zone Density Downstream (m³/s) | |
| 1 | Tank | N1 | 197 | 0 | 0 | 0 | N/A | N/A |
Below is a table with the main results found regarding the difference between the current situation and how the proposal can be a solution to the inconveniences presented in the operation of the current supply system Table 8.
Table 8 Difference between the current state of the system and the proposal for improvement.
| Current Status | Proposal |
|---|---|
| The total length of pipe of the existing system is 1875 meters, a length that increases losses by friction by its great length 214 meters of height to be overcome which means a greater need for energy for the pumping system. | The total pipe length of the proposed system 886 meters, which is 989 meters less pipe than the current system of 1875 meters, this decreases friction losses. |
| Losses of 790 meters of water column caused by the reduced diameter of the existing pipe of 1.5 inches. As the diameter decreases, the cross-sectional area of the pipe decreases, increasing the velocity. With this increase in speed, the friction loss increases. The friction loss decreases the pressure in the entire system, requiring more energy for the pumping system. | 110 meters of height to be overcome, compared to 214 meters to be overcome in the current system, is 104 meters less height in the proposed system which means an energy saving in the pumping system. |
| The existing 2.5-inch diameter pipe can be reused to replace this 1.5-inch pipe, requiring 197 meters of water column for the total system pressure, which is 4 times less than the current pressure needed to bring the water to the final supply point. |
4. Conclusions
From the lengths of the supply system to be proposed:
The system works with existing consumption peaks at 6:00 am, at midday 1:00 pm, and night 6:00 pm, according to the water president. However, according to the results obtained in terms of the decrease in the loss and height for the system to be proposed, it is assumed that by decreasing the loss of pressure in only 104 meters height there is additional pressure that will supply the demand in the peaks of the system's needs, which should be corroborated with data measured in the field at the time since the idea is not to change the pumping system.
If the project becomes real, it is required to carry out a structural analysis for the reservoir, an environmental study of the impacts of the reservoir, in addition to this, the need for pressure regulating valves or other accessories necessary for the proper functioning of the system.
Theoretically, we check that from the new reservoir to the intermediate point there are 262 linear meters of new pipe to be built and that from the intermediate point to the final point there are 624, for a total of 886 linear meters of new pipe to be built. In this sense, it is proposed to build the network for the transformation of the whole system, which, if we compare the total length of pipe of the existing system which is 1875 meters, with the system to be proposed which is 886 meters, gives a difference of 989 meters of pipe between the two systems. This means that the meters of difference would generate a new system network for optimal operation.
It was found that with a greater number of linear meters or height to travel, increase friction losses, therefore, will also increase the amount of energy to supply the pumping system, for that reason the system that is proposed, to have 989 meters less pipe, you need a lower amount of energy for pumping systems. These data indicate that the system studied would have a reduction in consumption by optimizing the processes based on the pumping system.
From the heights of the supply system, it is recommended:
According to the results obtained in the study, for the area of influence, from the proposed new reservoir to the final point there are 110 meters in height to be overcome and from the initial point to the final point of supply in the existing system there are 214 meters. It is identified then that the difference in height between pumping water from the new reservoir to the final point with the existing system is 104 meters in savings in pumping costs only by locating this new reservoir, which is compensated as a positive impact indicating an environmental benefit within the interactions evaluated.
Hydrologically, the basin can supply the population by locating this new reservoir in the upper part of the basin, in addition to having a better water quality by not having as much runoff as in the lower basin.
The energy-saving is in magnitude, half the length of the pipe section and half the height to be overcome compared to the current supply system, solving the supply and energy cost for the movement of water from the lower basin to the point of supply, thus being able to reuse the existing 2.5-inch pipe although it is suggested to change to a larger diameter to ensure the best hydraulic conditions of flow under pressure as the population increases.
With the simulation, the losses from the middle point to the end as it had been saying before are high, so much so that it would be necessary a pressure for the system in a total of 790 meters of the water column at the beginning to reach the high part with a pressure of 0.0275 Bar or 0.28 m of the water column.
Employing the system to be proposed, reusing the existing 2.5-inch diameter pipe, an initial pressure in the system of 197 meters of the water column is required, that is, 4 times less pressure than that of the system currently in operation, to reach the water with the required flows to the final point with a pressure of 0.0561 Bar or 0.57 meters of the water column.

