


 English (pdf)
 Article in xml format
 Article references
 Send this article by e-mail
 Cited by SciELO
  Cited by Google
  Similars in
SciELO
Similars in
SciELO  Similars in Google
 Permalink
1. Introduction
In the last few years, a large amount of environmental pollution and wastewater contamination, mainly due to dyes and toxic metal ions, have been continuously discharged into the atmosphere and effluents causing serious harm to human health and water reservoirs 1-3. Therefore, advanced oxidation processes (AOPs) such as heterogeneous photocatalysis could be a promising method for the degradation of various organic pollutants in wastewater 1-10.
Metal oxides-based semiconductors like ZnO and TiO2 have been the most studied photocatalysts for oxidation of organic contaminants in wastewaters 1-9. Together with ZnO, TiO2 is an effective and very well-known semiconductor with interesting optical and electrical properties 2,9. In nature, the TiO2 exists in different phases: rutile and anatase with tetragonal structure, and brookite with orthorhombic structure, being anatase the phase most attractive for a photocatalytic activity 11.
However, a new phase known as TiO2(B) with monoclinic structure (considered as a metastable phase) has been previously reported 11-14. In addition, mixed TiO2 (e.g. Ag/Co/Mn-TiO2 (6,7,19, TiO2/SnO28, TiO2/CS 10, CuO/CeO2-TiO233) has been widely used and studied as active catalyst for photodegradation of organics pollutants. However, TiO2 is active under ultraviolet light (UV), and it is inactive in the visible region due to its wide band gap (Eg ~ 3.2 eV), rendering it less efficient for its use in solar photocatalysis 1,6,9.
Moreover, the enhanced photocatalytic activity can be attributed to the synergetic effect of morphology, crystallinity, and surface area of the TiO2 and these features can be effectively tuned controlling the synthesis conditions of the nanostructures 15. Recently, Quintero et. at., 14 reported that the properties of the synthesized TiO2 nanostructures by sol-gel technique strongly-depend on the synthesis route and their processing condition (reagent concentration, pH, acid catalysts, stirring time and calcination temperature). To prepare TiO2 nanoparticles with excellent adsorption performance through an eco-friendly route, several methods have been applied to improve the photocatalytic efficiency of TiO24,9-16 Therefore, it has been reported that the synthesis methods have an important effect on the morphology, homogeneity, and photocatalytic activity of metal oxide semiconductors 1,16-19.
Thus, the aim of this study is to synthesize nanoparticles of TiO2 at different temperatures by an easy and reproducible preparation route. The synthesis by sol-gel technique has been one of the most promising methods to prepare nanostructured powders with interesting properties, due to its simplicity and low production costs (14.
Additionally, the incorporation of ultrasound in several chemical synthesis has been an effective process to reduce the particle size of nano powders 14,20,21. Also, is a process used to disperse the ions and nanoparticles into the polymer matrix. However, in this research, an ultrasonic-assisted sol-gel method is employed to obtain TiO2 nanoparticles with reduced particle size and their structural and optical properties investigated. A quantum size effect (QSE) is considered to explain the blue shift, which could be the cause of the enhancing in the photodegradation of methyl orange (MO) in the visible light spectral region.
2. Methodology
2.1. Materials
For the synthesis of pure TiO2, titanium tetra isopropoxide (TTIP, supplied by Sigma-Aldrich with purity of 97 %) and acetic acid (purity of 100 % supplied by Emsure) were used without further purification. For the photocatalytic reaction tests, methyl orange (MO, with purity ≥ 97 %) dye was purchased from Sigma-Aldrich. All the aqueous solution was prepared using distilled and deionized water.
2.2. Synthesis of TiO2 nanoparticles
In this work, 5 mL of acetic acid was dissolved in 250 mL of distilled and deionized water in a beaker. The mixed solution was used as the hydrolysis catalyst. Then, 5 mL of the TTIP precursor was placed in a syringe and instantly added to the above solution. Immediately, the resulting solution was sonicated at 70 °C for 3 h and then dried in a hotplate at 70 °C for about 36 h. After that, the dried sol-gel product was pulverized with mortar to obtain a fine powder for analysis. The finely pulverized sample was subjected to a heat treatment in a muffle furnace at 400, 450 and 500 ° C for 3 h. A yellow-white powder was obtained. The present method used for the synthesis of TiO2 nanoparticles was described by Quintero et al. 14 with different conditions of synthesis.
2.3. Characterization
XRD analyses were carried out in a Bruker D8 Advance diffractometer with CuKα1 radiation (( ( 0.154nm) at room temperature (RT). The XRD was operated at 40 kV and 30 mA, with scanning angle range of 20-80º and increment of 0.02°, respectively. A FTIR spectrophotometer (IRAffinity-1S, Shimadzu) was used to obtain the IR spectra of the samples using the KBr method. A Jeol/JSM-6490 scanning electron microscope (SEM) operated at 20 kV, equipped with an energy dispersive X-ray (EDX) detector was used for compositional analyses. A Tecnai F20 FEG-S/TEM operated at 200 kV was used to characterize the samples. Absorbance measurements was analyzed using a Chromtech spectrophotometer CT-8600. Photoluminescence (PL) measurements were performed at RT in a Jasco Spectrofluorometer FP-8500. The concentration of MO solutions was analyzed using a Rayleigh UV-Visible Spectrophotometer, UV1800.
2.4. Test of MO degradation
The photocatalytic activity was carried out in a batch reactor using an Illuminator LuzChem LZC-4V photoreactor equipped with 14 lamps (Sylvania F13T8 13W, Cool White, 412 K Color Temperature) with emission in the visible range, from 400 to 700 nm. The energy density of the light irradiation on the surface of the sample was 4.5 J/cm2, as measured with a UVX radiometer under continuous illumination. The synthesized samples were used as a catalyst for the degradation of MO solution. Without the presence of the catalyst, the MO was first tested to observe its stability.
Reaction mixtures were prepared by adding 1g/L of photocatalyst into MO solution (5 ppm). The mixture (MO solution and nanoparticles) was kept in stirring and darkness for 1 hour until adsorption equilibrium was achieved. The photoreactor was irradiated under continuous shaking, and samples from the suspension were collected at regular time intervals, centrifuged, and filtered. The MO concentration in solution was measured through a calibration curve of the absorbance at 465 nm using a UV-visible spectrophotometer, which is the maximum absorption of MO. The results were corrected for the decomposition of the MO dye in the absence of a photocatalyst. The Eq. 1 was used to determine the degradation efficiencies of MO dye,
where, C 0 and C are the concentrations of the solution at t = 0 and t minutes under visible light.
3. Results and discussion
Figure 1 shows XRD patterns of the synthesized TiO2 nanoparticles (NPs) and calcined at 400, 450, and 500 °C. The prepared TiO2 NPs crystallize in the anatase structure (JCPDS 89-4921) 1 with diffraction peaks located at 2( values and Miller´s indexes (101), (004), (200), (105), (211), (204), (116), (220) and (215), respectively. This indicates that no relevant changes were obtained in their crystalline structure due to the calcination during the preparation of these photocatalysts. Therefore, the formation of anatase TiO2 nanoparticles can be confirmed.
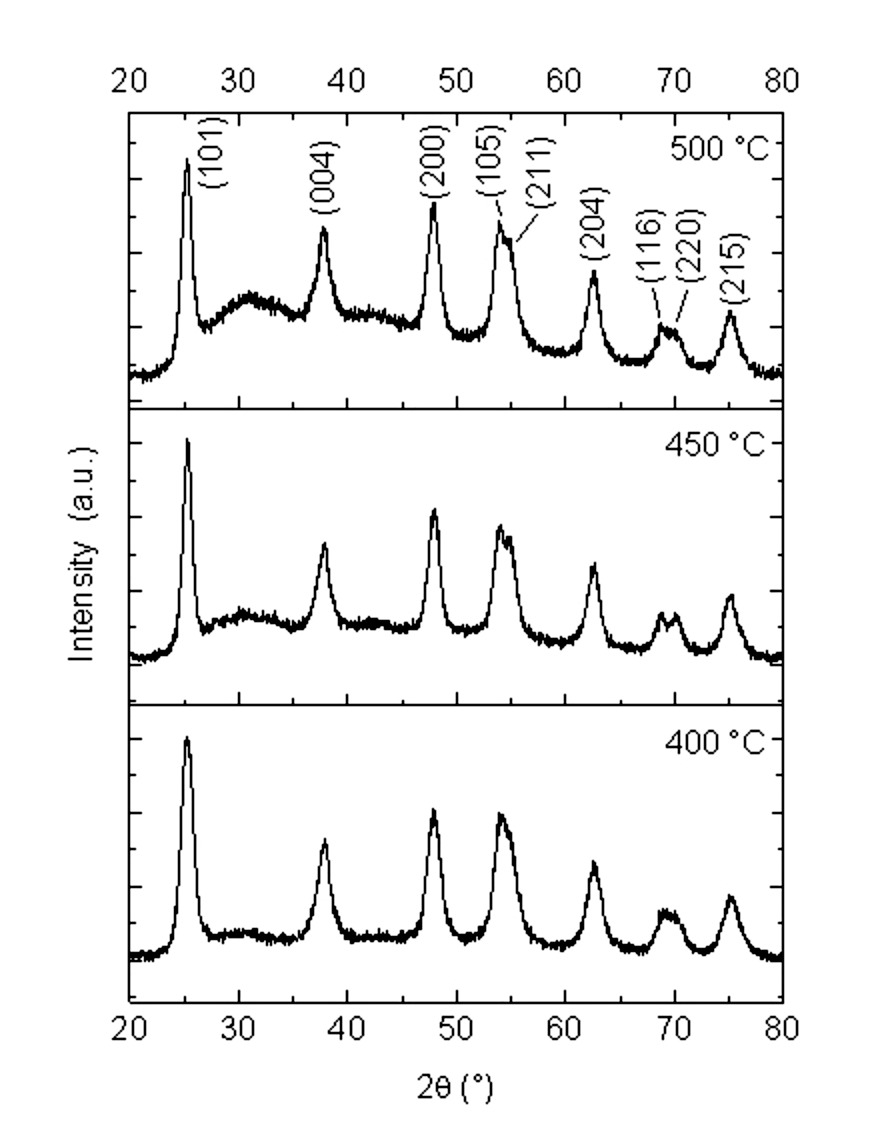
In addition, XRD can be used to determine the crystallite size which was calculated by the x-ray line broadening method employing the average of the three principal peaks at (101), (004) and (200), using the Scherrer formula (Eq. 2) 3,22-24:
where D is the crystalline size, 𝑘 is the shape factor (0.9 for spherical particles 25) and assumed the peak to be Gaussian, 𝜆 is the wavelength of CuK( source (0.15405 nm), and 𝛽 is the full width at half maximum (FWHM) of each the diffraction peaks. The TiO2 crystallite sizes varied each other according to XRD patterns when the synthesis temperature is changed. The crystallite size is reported in Table 1. Further, the smaller sized TiO2 nanoparticles here reported possess a similar crystallite size to the anatase phase without calcination from a previous work 14. Instead, for the samples calcined at 450 and 500 °C, the crystallite size increased.
Table 1 Crystallite size and bandgap values, along with the degradation efficiency of all samples under visible light irradiation.
| Sample | Crystallite size, D, (nm) | Band gap (eV) | Degradation efficiency (MO dye, 60 min, visible light) (%) | Degradation efficiency (MO dye, 240 min, visible light) (%) |
|---|---|---|---|---|
| 400 °C | 7.1 | 3.59 | 10.2 | 29.6 |
| 450 °C | 9.1 | 3.79 | 13.2 | 41.1 |
| 500 °C | 8.6 | 3.64 | 12.5 | 27.9 |
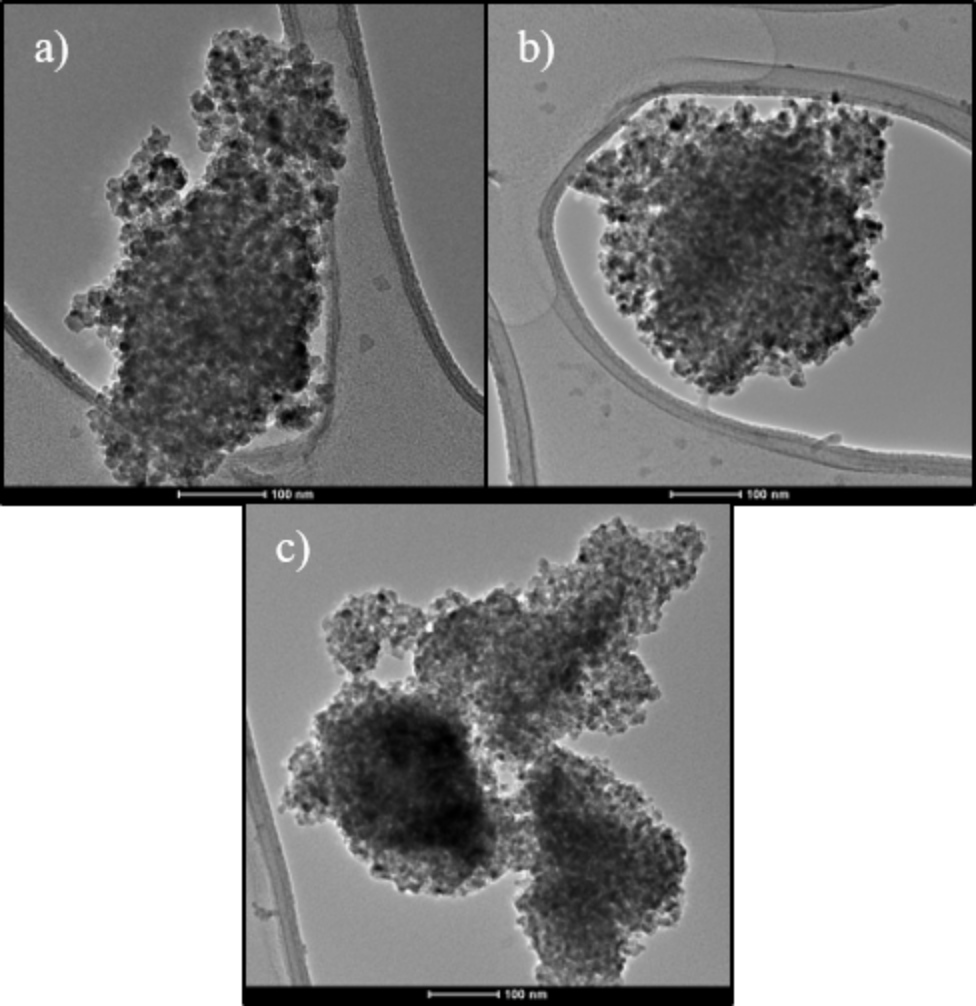
Figure 2 shows the energy dispersive X-ray spectroscopy (EDX), which indicates that the elements Ti, and O are present in the samples (the presence of Al is due to the sample holder). No other impurities are observed, indicating the high quality of the product. The morphology (size and shape) of the NPs was investigated with TEM technique (Figure 3). In all samples there is agglomeration of nanoparticles which are spherical shape. The typical micrographs consist of agglomerated TiO2 nanoparticles with an average diameter less than 15 ( 2 nm, which is slightly larger than the crystallite size calculated by Scherrer´s formula (see Table 1) from XRD analysis. Therefore, XRD analysis is used to estimate the crystallite size in a nanocrystal while TEM micrographs are used to determine the particle size 14,21. In addition, increasing the calcinated temperature will favors an increase in the nanoparticle size or promote change in the crystalline phase.
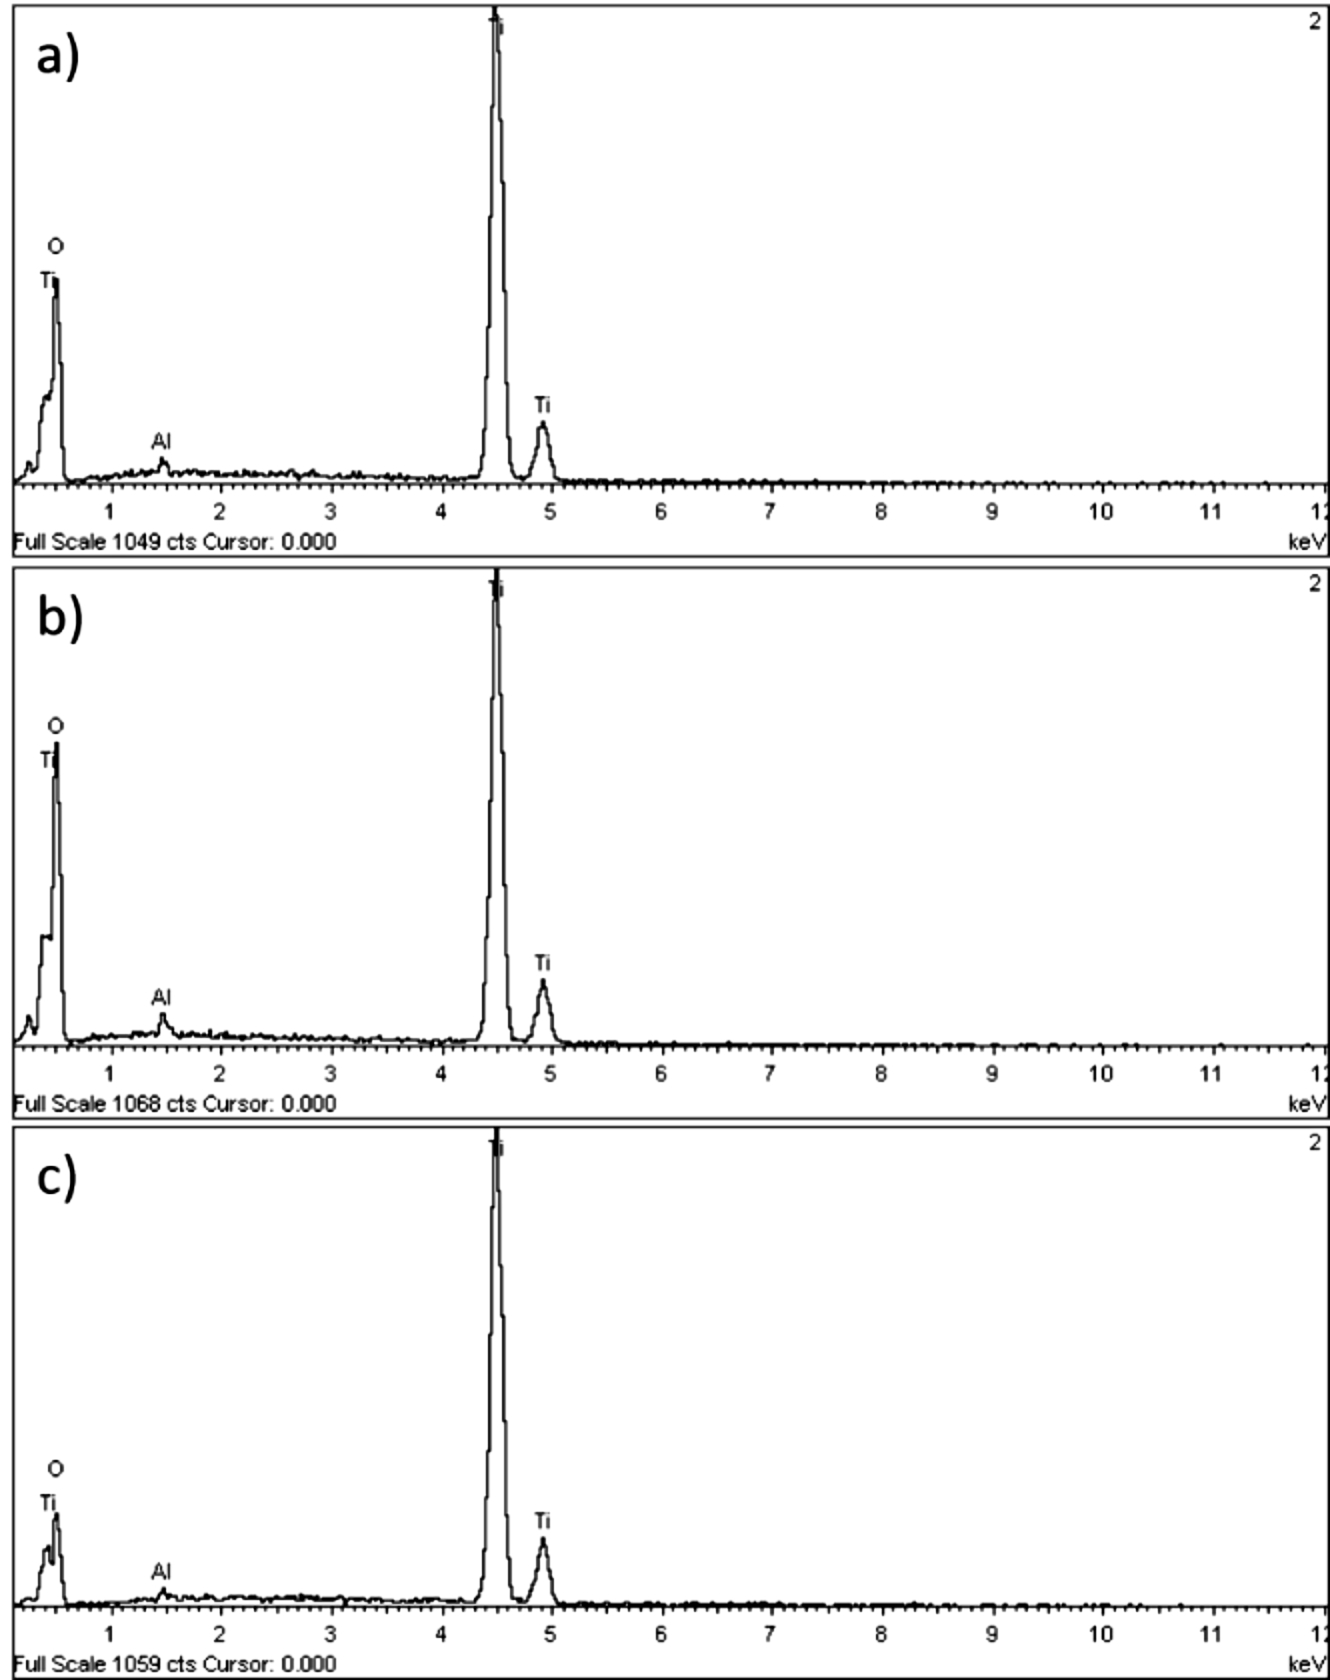
Figure 2 Compositional analysis of TiO2 nanoparticles calcined at: (a) 400 °C (b) 450 °C, and (c) 500 °C.
An FTIR was used to determine the functional groups of the samples. The vibrational frequencies have been recorded in the range of 4000- 500 cm-1 (Figure 4a). The bands present at ( 3330 and 1635 cm-1 is due to the stretching vibrations of O-H groups and to the H-O-H bending vibrations of adsorbed water. In addition, peaks around 1000 and 500 cm-1 are related to the metal-oxygen stretching mode in the TiO2 lattice.
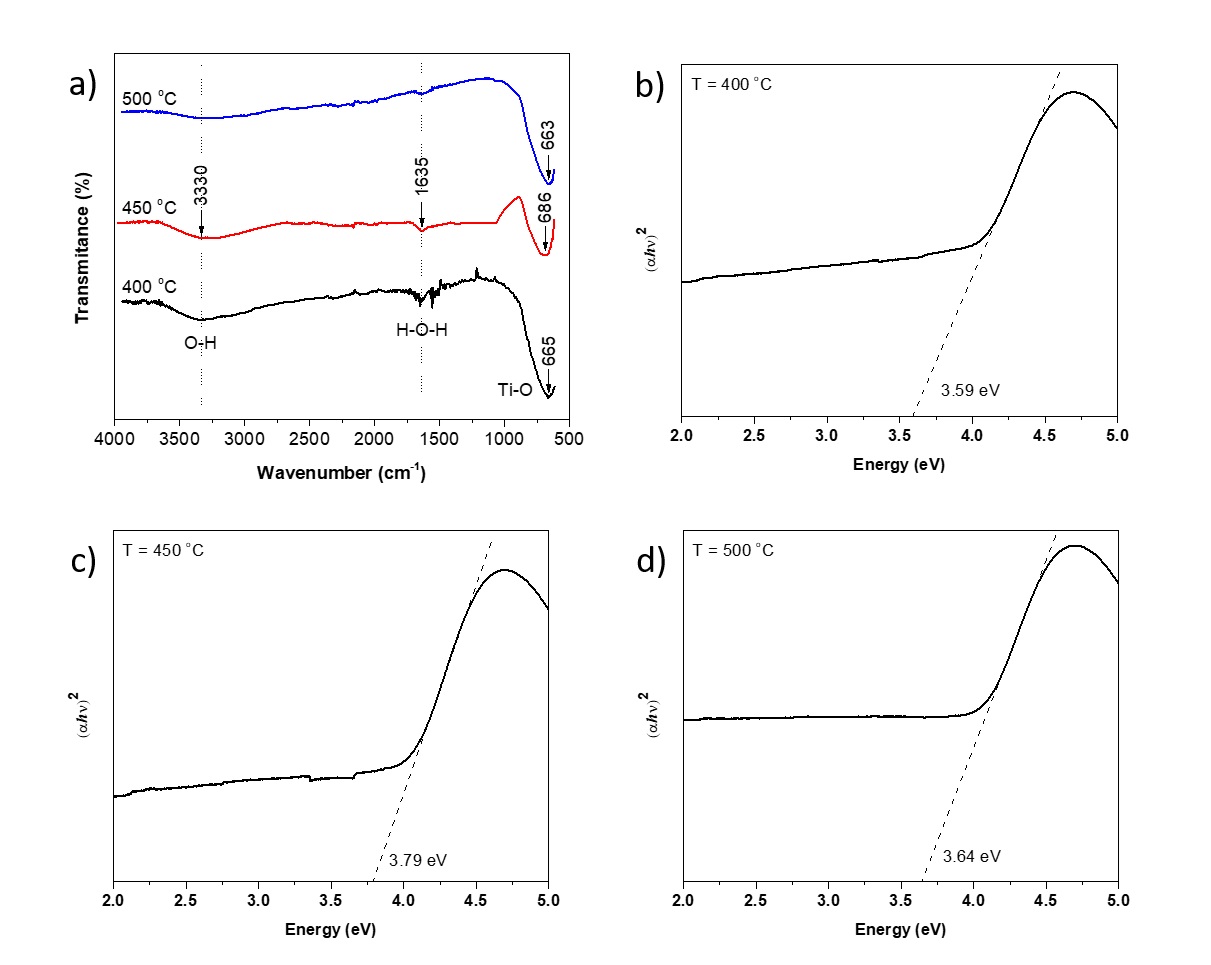
UV-vis absorbance and photoluminescence (PL) studies performed at room temperature (RT), have been employed to examine the optical properties of the samples. Here, we observed that the optical absorption edge exhibits a blue shift (∆E g = 0.49 ± 0.10 eV) with respect to the bulk (Anatase phase, 387 nm, E g ( 3.2 eV 1,2,10,19).
The optical band gap of the samples, Fig. 4b-d, was determined based on the dependence of the absorption coefficient (() and the photon energy (h(). For direct transitions, the corresponding band gap energy (E g ) were estimated through Tauc´s plot 1,11,27 ((( h()2 versus h( plot to ( = 0). It is observed that the E g of the samples increases with respect to the synthesis temperature showing a blue shift, which could be explained by the quantum size effect (QSE) of TiO2 nanocrystals, see Table 1.
However, a photocatalyst with the large E g will have a better performance in the near-solar UV region. But the observed results demonstrate that TiO2 anatase nanocrystals will be prospective visible light active photocatalysts ever if their E g is considerably larger than the bulk (anatase phase) as reported by Vorontsov and Valdés 27.
Room temperature photoluminescence (PL) spectra were recorded for further analysis of the electron-hole recombination process of the samples (see Figure 5a-c). The samples were excited using light of wavelengths at 254, 312, and 365 nm, respectively. No change was observed both in the shape and emission peaks in the PL spectra of all samples tested. The peak observed around 342 nm (3.63 eV) corresponds to the band-edge emission of the TiO2 nanocrystals 1.
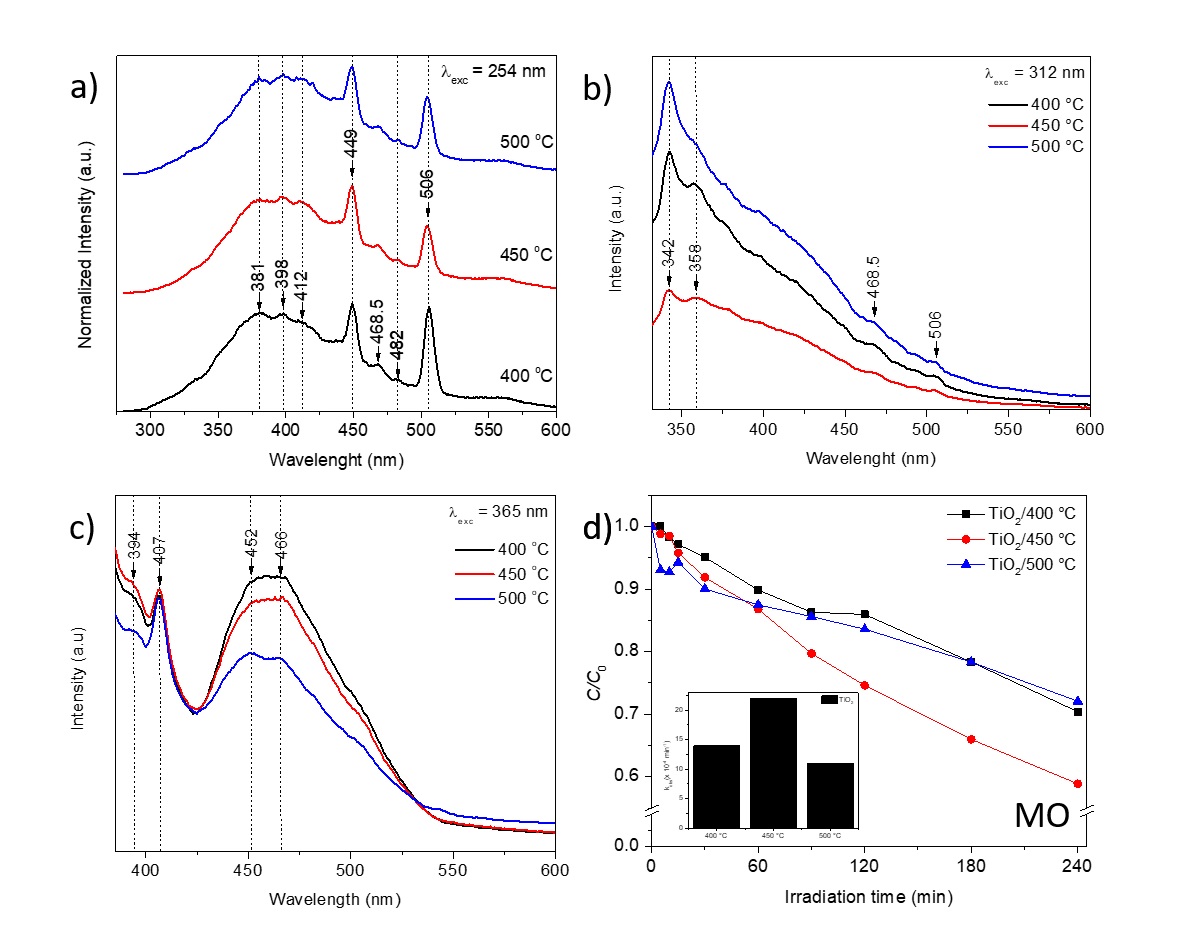
Figure 5 RT-PL spectra of samples excited at (a) 254 nm, (b) 312 nm, and (c) 365nm (d) Photocatalytic activity of synthesized photocatalysts. The inset shows the plot of the observed degradation rate constant of MO for different samples under visible light irradiation.
This result match very well with obtained by UV-vis and is in agrees with the reported values of electronic band gap and optical band gap obtained by Vorontsov and Valdés (27. Instead, the TiO2 absorption edge is characteristic of an UV material. In addition, the origin of the violet-blue emission observed in PL measurements could be ascribed to shallow trap levels induced by the presence of oxygen vacancies (Vo) 28-31. Romero Sáez et. al, 1 reported that in pure TiO2, the PL emission is attributed to oxygen vacancies (Vo), which was confirmed by XPS measurements 32-35. In addition, Romero Sáez et al, 1 and Saravanan et al, 10 reported that incorporation of carbon (C) and chitosan (CS) in the TiO2 structure increase the photocatalytic activity of TiO2 nanoparticles in the visible region.
The synthesized TiO2 NPs have been examined as a photocatalyst for the photodegradation of MO. Figure 5d displays the MO degradation curves versus irradiation time for all samples. The degradation of MO dye under visible light and its efficiency are determined from Eq.1 and the calculated values are reported in Table 1.
After 240 min of samples illumination, the results showed how the MO concentration decreased with irradiation time (less than 50 %). The maximum efficiency is achieved for the sample calcined at 450 °C, which shows 41.1 % efficiency, followed by 29.6 % (at 400 °C) and 27.9 % (at 500 °C). Therefore, the photocatalytic performance of the samples is attributed to the structural and optical characteristics of the material. In addition, extending the absorption spectrum to the visible light region provide opportunities of designing advanced photocatalytic materials.
On the other hand, the photocatalytic first order rate constant (𝑘) was calculated using the Eq. 3:
which was reported by Gnanasekaran et al 19. Here, it is also found that the observed degradation rate (k) for sample calcined at 450 °C is higher than those calcined at 400 and 500 °C (Figure 5d, inset). Therefore, the results show that the photocatalytic activity of TiO2 nanocrystals mainly depends on the synthesis method, crystallinity, morphology, the energy gap and lattice defects 1,3-19.
4. Conclusions
In summary, TiO2 NPs were successfully synthesized employing an ultrasonic-assisted sol gel method. The TiO2 NPs crystallize in the anatase structure with a highly crystalline order. Based on the quantum size effect (QSE), the optical properties show that the absorption and emission peaks are blue shifted in comparison to the bulk. In addition, the optical band gap was found to be 3.69 ± 0.10 eV for crystallites size less than 10 nm. PL analysis showed that oxygen vacancies were generated in all samples, which can also cause absorption and reaction under visible light, enhancing the photocatalytic activity of the nanomaterial prepared. All samples were photoactive for MO degradation after 240 min of being irradiated with visible light. The best performing TiO2 nanocrystals we obtained, according to their degradation efficiency on MO, correspond to those calcined at 450 °C. The results provide new insights about the synthesis of TiO2-based photocatalysts with notable visible light activity for interesting and potential environmental applications.

