


 English (pdf)
 Article in xml format
 Article references
 Send this article by e-mail
 Cited by SciELO
  Cited by Google
  Similars in
SciELO
Similars in
SciELO  Similars in Google
 Permalink
1. Introduction
In the mining and quarrying phase or any design in rock mechanics, it is necessary to determine the unconfined compressive strength (UCS) of the materials present in the area, because with this parameter, together with others, it is possible to develop geomechanical classifications such as the Rock Mass Rating or Q Index, which lead to the determination of safety factors in the stability of surface mining structures and also to the possible types of fortification in underground works. Mining projects have basic equipment for the execution of the exploitation of minerals, due to this and the location of mineral deposits, often it is difficult for the shipment of samples to the laboratory for the value of the compressive strength by what technicians and engineers in mines they develop in situ testing for and establish a solution to the problem. Due to the above, a methodology is proposed that relates the granulometry and the resistance to the simple understanding of the rocky material, through the Point Load Index (IS 50). The results are encouraging and help to determine the property, with an acceptable approximation for the purposes of subsequent calculations
1.1. Unconfined Compressive Strength (UCS or 𝜎𝑐)
The resistance of a rock or of sediments no consolidated is influenced by the mineralogy of his particles and by the contact that there is between them 1.
It is used to understand by “resistance” to the specific load (by unit of section), that is necessary to apply to a material to produce his break. According to the effort that apply the resistance can be to compression, to traction, to flexion, to cut, to torsion, etc. The resistance to the simple compression (or compression uniaxial) of the rocky matrix, is the value that obtains when it applies a load of compression in a direction given, without applying any another effort in any another direction. It is used to express with the symbols described in the Eq.1:
Where P is the load of break and A is the section on which applies 2.
The behavior of a rocky massif is different from a rocky material, because the rocky material is stronger, and a rocky massif almost always presents systems of structural weaknesses called joints. We speak of rocky material when the material is intact, for example a control or small sample without fractures. A rocky massif refers to the entire set of rocky material and discontinuities that make it up.
Regarding the rocky matrix, rocky material or simply rock, there are many parameters that are used for its identification and description of its characteristics. These properties together with the mineralogical composition determine its behavior. The rocky matrix breaks in favor of the fracture surfaces that are generated when its peak resistance is exceeded. Thus, in an indirect way, compression tests measure the shear strength of rocks. The uniaxial compressive strength of the rocky matrix is a highly variable parameter that depends on many factors:
Intrinsic factors:
Type of rock (factor basic conditioning).
Degree of microcracking.
Porosity and degree of alteration and / or weathering.
This means that not only does the resistance vary from one type of rock to another, but within the same type of rock, a wide range of values can be given 2. This dispersion of values corresponds to "measured" resistance values, which are also influenced by:
Extrinsic factors:
Simple compressive strength has been one of the rock classifying parameters from an engineering point of view 2. It is also an important factor when material removal methods are to be used using explosives. The rocks respond in a very different way to the detonation wave of the explosive regarding the first stage of fissure formation, the primary and origin of the phenomenon of breakage and fragmentation 3. Extremely hard but brittle rocks break well while as tic soft rocks are hardly fragmented 3.
Similarly, it is important for the calculation of the use of explosives in methods such as the one proposed by López-Jimeno for the respective blasting parameters 4. The resistance to simple compression is also related to the IS 50, through the relation of Eq. 2:
1.2. Point Load Test Index (IS 50)
The point load index is one of the most important tests used for the indirect determination of UCS, since in the implementation of the press it can be used in situ or in the laboratory, it also requires little or no preparation of the samples for testing 5.
The point load or break test between points is a basic test that can be carried out in the field with unmodified cores or with rock fragments. This is based on applying a point load to a piece of rock until it breaks, obtaining an Is index that is correlated with the simple compressive strength of the rock 6.
The point load test value can be used as an indirect estimate of the uniaxial or simple compression of the rock, the sample that is carried out can be a rock core, a block, or an irregular rock lump 7. The point load test consists of breaking a piece of rock between two conical points of hardened steel. The samples that will later be placed between said tips can be of any shape, but it is recommended that their diameter is not less than 50 mm, since the volume of said test piece influences its resistance.
The Eq.3 allows calculate the index of punctual load without correction:
Where:
P = Loads applied in N.
De = Diameter of the equivalent core in mm 8.
The distances of the fragments are taken which must comply with the provisions indicated in the standard. The ratio 0.3 < D/W < 1 is preferably close to 1. The distance L > 0.5W (L distance from the end of the rock to the conical tips and W distance perpendicular to L measured on the rock). In Eq. 4 the equivalent diameter De is determined, depending on the dimensions of the irregular fragments:
Where A is defined by the Eq.5:
Where A is the minimum cross-sectional area parallel to the load direction in mm².
The corrected point load test index, IS 50, of a rock sample is defined as the value of Is that has been measured by a diametral test with D = 50 mm. When a rock classification is essential, the most reliable method to achieve IS 50 is to carry out the tests with diameters of D = 50 mm or very close to this value.
Most point load tests are carried out using sample sizes other than the mentioned diameter 9. With the Eq.6 you get the correct size:
1.3. Trituration
To discuss the crushing process must know the types of machines that exist n for this activity. Different types of crushing machines are used industrially. They are classified according to the stage and size of the material treated.
Primary Shredders: Chunks large chunks down to 8" to 6" product. I have two types of machines:
Secondary Crushers: They fragment the product of the primary crushing up to sizes of 3'' to 2'' among these machines are:
Tertiary Crushers: They fragment the product of the secondary crushing up to sizes of 1/2" or 3/8", among these machines are:
Conical crushers.
Crushers Rollers 10.
From now on, the pertinent information on this topic is developed. The most common pieces of equipment found in the middle are jaw, cone, hammer, impact (vertical and horizontal), and roller crushers. These crushers can be classified into two large groups: compression crushers and impact crushers 11.
1.3.1 Compression crushers.
They are those machines that mechanically compress the rocks inside a chamber until the rock is fractured into smaller particles. Jaw, cone and roller crushers operate according to the compression principle 11.
1.3.2. Jaw crusher.
Jaw crushers are mainly used in the primary stage. Rock fracturing occurs in the crushing chamber, which is made up of a fixed jaw and a movable jaw. These jaws are fitted with toothed manganese steel plates called liners. The fixed lining is installed on the jaw that has no movement and it is this that receives the pressure, the mobile lining is mounted on the jaw that has the oscillating movement by action of an eccentric shaft. There are two basic types of jaw crushers, single acting, and double acting. The single acting shredder has an eccentric shaft at the top of the frame. A double acting shredder basically has two shafts and two tilting plates.
The oscillating motion that causes compression, both at the material intake and discharge, gives the single acting crusher better capacity than similar sized double acting crushers. The jaw crusher is a robust and reliable equipment, and therefore very popular in primary crushing plants 11.
The production capacity of the crusher depends on the characteristics of the materials to be crushed (intensity, hardness, and composition of graininess fed, etc.), and the operating conditions (cases of feeding and dimension of the exit of materials), etc. 12.
1.4. Classification
Sorting or screening is the process where the rock fractions are separated. The granulometric analysis is a test in which the distribution of particles of different sizes is determined by means of sieves 13. This selection is made through metallic, or polyurethane meshes that are mounted on the vibrating screens. The screening principles for any type of material in vibrating screens are basically the same, the results will depend a lot on the configurations that have been applied. Once the material is on the surface of the screen box, the phenomenon of stratification is generated, in which process by effect of the vibratory movement, the coarse particles emerge to the upper part of the material layer and the smaller particles they find their way to the bottom of the layer through the gaps created between the coarse particles. The factors that affect stratification are:
Material flow velocity, material layer thickness, screen inclination characteristics.
Characteristics of the motor power, amplitude configuration, direction of rotation of the eccentric element, type of movement and frequency.
Surface moisture of the particles, a high moisture content makes stratification difficult with little probability of separation. Degree of cleanliness with reference to plasticity.
By this procedure, the size of particle is be associated with the number of openings having sieve per linear inch, using the concept of size of FERET defined as the size corresponding to the distance between two parallel tangents to the particle, plotted in the same direction of measurement 14.
The granulometric analysis or particle distribution of the treated material is important in the investigation processes for an operation control. This analysis, also called particle size analysis, of the treated material, whose result can be represented in the form of a table or by means of the respective granulometric curve, is of great importance for any treatment process, be it in the project and study phase in the laboratory, for the control of operations during the operation of a plant. The granulometric analysis is generally carried out with mechanical methods (series of sieves or sieves) or with hydraulic and pneumatic methods. In general, screens are used for classifications up to sizes above 40 microns indicatively, while hydraulic and pneumatic classifications are used to classify smaller sizes. For classification to sizes smaller than 40 microns, the new field of electronic techniques is also being developed 15.
The granulometry, subject to be discussed, is the composition, in percentage, of the various aggregate sizes in a sample. This proportion is usually indicated from largest to smallest size, by a figure that represents, by weight, the partial percentage of each size that passed or was retained in the different sieves that are obligatorily used for such measurement 16.
The separation of a material into different fractions, according to their sizes, is necessary to know its competence from a geotechnical point of view. This classification comprises two parts: by sieving for coarse particles (gravel and sand) and by sedimentation for the fine fraction of the soil (silts and clays). By granulometry or granulometric analysis of an aggregate it is understood any manual or mechanical procedure by means of which the constituent particles of the aggregate can be separated according to sizes, in such a way that the amounts by weight of each size that contribute the total weight can be known.
To separate by size, meshes with different openings are used, which provide the maximum aggregate size in each one of them. In practice, the weights of each size are expressed as percentages retained in each mesh with respect to the total sample. These retained percentages are calculated both partial and accumulated, in each mesh, since with the latter, the graph of material values (granulometry) is drawn.
The curves can be represented in various ways, the most used form provides the use of semi-logarithmic diagrams, with the abscissa (mesh sizes or classification in general) on a logarithmic scale and the ordinate (percentage of through or retained) on a linear scale. The need to use the logarithmic scale for the sizes of classifications would cease, in the case of very homogeneous samples granulometrically 15.
A parameter to generating a granulometric curve is called D80, which is defined as the size that allows spend 80% by weight of the population of particles. To determine the D80 is used the model Schumann, described by Eq. 7 17:
Where:
𝐹(𝑥) = % by weight accumulated weight passing through each mesh.
n = Distribution parameter.
𝐾 𝑆𝑐h = Schumann’s constant.
𝑥= Particle size.
2. Methodology
For the development of this work, samples were obtained from an outcrop located in the province of Cañar (Ecuador), and 60 rock samples have been obtained.
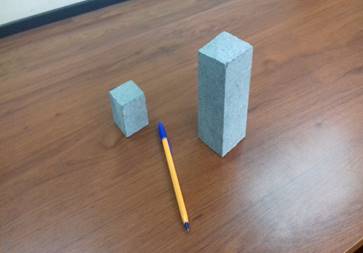
The samples should not be obtained from the superficial part of the outcrops, in order to avoid effects of alteration and erosion, the samples should be as healthy as possible, without fractures and without signs of weathering. The next stage is to develop the specimen that will generate each sample, in this case 60 specimens were obtained, 30 of these specimens were made with approximate dimensions of 5 cm x 5 cm x 5 cm and 30 with approximate dimensions of 5 cm x 5 cm x 10 cm. The small specimens went to the breaking or Is 50 process and the large specimens went to the crushing and classification process (Figure 1).
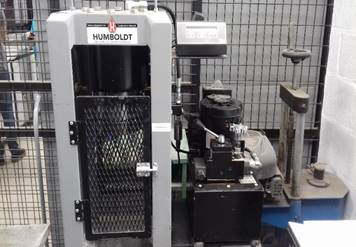
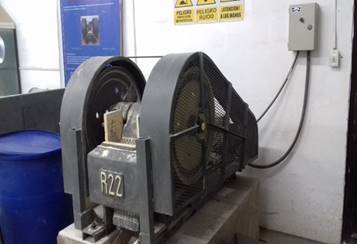
Work began with point load tests with small specimens. For the execution of the tests, a Humboldt press was used, which has the power to subject materials to tension and compression tests. The pressure is achieved by plates or jaws actuated by screws or hydraulics (Figure 2). At the same time, the crushing and classification process was carried out with large specimens and a MEM R22 jaw crusher was used for crushing (Figure 3).
Once the material was obtained from the crusher, it was subjected to classification with the 12.7 mm, 9.52 mm, 4.75 mm and 2 mm sieves. The classification time was 2 minutes (Figure 4). This process end is different masses that are retained on the sieves and through semilogarithmic plots can generate different granulometric curves provides, to finally determine the D80 of each larger specimen. It should also be noted that the different values of the point load index of the small specimens have already been obtained.

3. Results and Discussion
Different granulometric curves obtained with the respective D80, and the values of the point load test index, we proceeded to determine a relationship between them. In Tables 1a and 2a the results obtained from the processes can be observed. It is evaluated that the dispersion of the values of D80, ranges between 7.549 mm to 8.141 mm, being its average 7.806 mm (Table 1b) and the dispersion of the values of Is (50), ranges between 1.46 MPa and 3.53 MPa, being its average 2.93 MPa (Table 2b).
Table 1a Results D80
| Test tube | D80 (mm) | Test tube | D80 (mm) | Test tube | D80 (mm) |
|---|---|---|---|---|---|
| 1 | 7.549 | 11 | 7.74 | 21 | 7.872 |
| 2 | 7.608 | 12 | 7.757 | 22 | 7.875 |
| 3 | 7.638 | 13 | 7.76 | 23 | 7.875 |
| 4 | 7.659 | 14 | 7.765 | 24 | 7.922 |
| 5 | 7.671 | 15 | 7.766 | 25 | 7.953 |
| 6 | 7.672 | 16 | 7.79 | 26 | 7.963 |
| 7 | 7.677 | 17 | 7.794 | 27 | 7.964 |
| 8 | 7.732 | 18 | 7.806 | 28 | 8.019 |
| 9 | 7.735 | 19 | 7.809 | 29 | 8.126 |
| 10 | 7.735 | 20 | 7.815 | 30 | 8.141 |
Source: own elaboration
Table 1b Dispersion of results D80
| D80 minimum (mm) | 7.549 |
| D80 maximum (mm) | 8.141 |
| Average (mm) | 7.806 |
Source: own elaboration
Table 2a Results Is (50)
| Test tube | Is (50) (MPa) | Test tube | Is (50) (MPa) | Test tube | Is (50) (MPa) |
|---|---|---|---|---|---|
| 1 | 3.53 | 11 | 3.15 | 21 | 2.96 |
| 2 | 3.49 | 12 | 3.14 | 22 | 2.95 |
| 3 | 3.38 | 13 | 3.12 | 23 | 2.94 |
| 4 | 3.30 | 14 | 3.10 | 24 | 2.64 |
| 5 | 3.25 | 15 | 3.08 | 25 | 2.62 |
| 6 | 3.25 | 16 | 3.08 | 26 | 2.59 |
| 7 | 3.23 | 17 | 3.07 | 27 | 2.56 |
| 8 | 3.20 | 18 | 3.03 | 28 | 2.05 |
| 9 | 3.19 | 19 | 3.01 | 29 | 1.49 |
| 10 | 3.15 | 20 | 2.97 | 30 | 1.46 |
Source: own elaboration
Table 2b Dispersion of results Is (50)
| Is (50) minimum (MPa) | 1.46 |
| Is (50) maximum (MPa) | 3.53 |
| Average (MPa) | 2.93 |
Source: own elaboration
The proposal presented refers to the fact that the lower D80 is obtained, the greater the resistance presented by the rocky material, since it is proposed that the greater the amount of particles generated in the crushing process, it implies that the rock has a greater resistance to compression, the inverse represents that the lower the compressive strength of the rock, the amount of particle production decreases, so initially the results were plotted in a set D80 - Is (50), this can be done see in Figure 5.
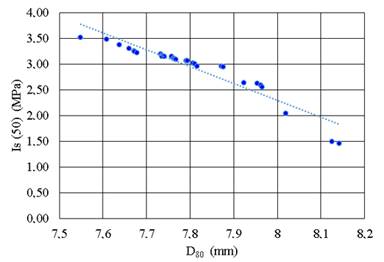
The relationship existing between the D80 and the point load test index allowed to obtain the Eq.8:
Where Is (50) is in MPa and D80 is in mm. This relationship presents an R2 equal to 0.8924, which leads to the proposed objective.
It should be emphasized that this expression is exclusively for the rock material in the Cojitambo area, which is an Andesita Amphibole, which has a typical range and apoline in its microcrystalline mass of light gray, perfectly crystals amphibole distinguished, mica black and fairly large fragments of white plagioclase (andesite) 18. In the case this condition isn’t fulfill, samples of the rocky materials should be sent to a laboratory for the determination of the Is (50) or UCS.
4. Conclusions
The test execution crushing and on samples of rock, with the dimensions described in this work, for the determination of the D80 as well as assays Is (50) are feasible to be executed in situ, since most mining companies have the appropriate equipment for such tests. It was found that there is one relationship between the D80 and Is (50), as different samples of rock analyzed, which provides a way quick, direct and economic to determine an approximate value for the property (UCS).
It is also proposed, for the case study presented, a correlation between D80, Is (50) and UCS (σc), which is expressed by Eq. 9:
The proposed relationship allows characterizing the rocky material present in the area, consequently, values of D80 have been obtained ranging from 7.5 mm to 8.2 mm and the value of Is (50) for this material ranges from 1.5 MPa to 3.5 MPa.
This proposal allows the UCS to find these rocks and my ma is between 34 MPa and 80 MPa, bone from moderately soft rock to hard rock. If the values of D80, obtained in other rock samples are not framed within the range obtained in Figure 5, it is necessary that these materials be sent to the laboratory for determination of the UCS.

