


 English (pdf)
 Article in xml format
 Article references
 Send this article by e-mail
 Cited by SciELO
  Cited by Google
  Similars in
SciELO
Similars in
SciELO  Similars in Google
 Permalink
1. Introduction
The current demand for water resources worldwide is on the rise, and given that the population, as well as economic growth, has increased over the years, water scarcity problems that compromise the world economy and the future supply of water resources are the consequence 1-4. According to UNESCO 5, if these levels of consumption continue, by 2030, the planet will face a deficit of 40% of freshwater. Worldwide, 70% of the water used is invested in agricultural production, and it is estimated that in developing countries, withdrawals for agriculture will reach 82% 4,6. Thus, it is urgent that actions for the sustainable management of water resources in agricultural systems are put in place 7.
The need of countries for water sustainability has prompted many studies focused on water management using measurement indicators such as the water footprint (WF). This is a sustainability indicator that quantifies the total volume of consumed and/or contaminated water that is used for the production of goods and services consumed by an individual or a community 8, and this indicator allows us to identify the impacts on water due to scarcity in a certain area and time 8-10. A water footprint has three components: blue, green and gray; the first two components are related to consumption, and the last component relates to the quality of the resource.
Reports on water consumption at a global scale are available for the agricultural sector. However, local and regional reports make it possible to highlight the risks to water resources and capture more effective actions 11,12. Mekonnen and Hoekstra 13 generated WF reports for oil palm products, with general information for Colombia; in the same way, Arévalo et al. 10 estimated water consumption for agricultural products in the country. However, no regional estimates of the WF of oil palm have been published in the Piedmont Llanero of Colombia, where the edaphoclimatic conditions are different to those in the remainder of the country. Thus, the present study aimed to estimate the water consumed (L/kg) during the production of fresh fruit bunches of oil palm at a subregional scale (Piedemonte Llanero).
2. Methodology
2.1 Study Area
The Piedemonte Llanero of Colombia is located on the right margin of the subregion of the foothills of the Eastern Cordillera and is a border area between the Andean zone and the lowlands. Heights above sea level vary between 250 and 1,000 meters. The region has a monomodal climatic regime, with a marked rainy season between March and October and a dry season between November and February. Precipitation varies from 2,400 mm/year to 5,000 mm/year, and the average temperature is 27°C between January and March and 26°C between April and December 10,14.
The study focused on oil palm production systems located in the Guayuriba River basin, which has an area of 353,166.83 ha and a main channel length of 118.45 km, and in the Caño Quenane-Quenito basin, which has an area of 52,600 ha and a main channel length of 52.6 km (Table 1). The productive units (PUs) of oil palm were determined from the analysis of land use.
2.2. Estimation of the water footprint of fresh fruit bunches (FFBs)
The estimation of the water footprint was carried out using the Global Standard for the Evaluation of the Water Footprint and its blue and green components 15. In this study, the gray water footprint was not considered because obtaining the necessary data for the calculation required mathematical models and had global constants 7; in addition, the gray water footprint considers fertilizer and pesticide residues, and given their diffuse nature, their quantification is complex in agricultural systems. Satellite images were obtained with the RapidEye sensor, had a spatial resolution of 5 m, and were processed with ENVI 5.0 software (ESRI), and these data and the CORINE land cover method for Colombia were used for the analysis of land cover and land use in the watersheds to describe, characterize, classify and compare the characteristics of land cover at a scale of 1:25,000. The estimation of the water footprint of oil palm FFBs considered the green and blue components, as shown in Eqs. 1 and 2.
Where CWUcrop is the blue and green water requirement of the crop (irrigation or precipitation) expressed in m3/ha. The CWU was calculated using Eq. 3.
Where Kc is the crop evapotranspiration coefficient, obtained from Allen 16 and the evapotranspiration (ETo) was calculated using the Penman-Monteith model. The effective precipitation is the real volume of precipitation used by the crop and was estimated using the USDA SCS model (USDA Soil Conservation Service). Finally, the WF of FFBs was estimated using Eqs. 4 and 5. All calculations were developed using CROPWAT 8.0 software 17.
2.3. Data collection
The climatic data information was obtained from the monthly averages of the last 20 years from Vanguardia (35035020-IDEAM), (35010020-IDEAM), Unillanos (35035070-IDEAM), La Libertad (35025020-IDEAM), Pompeya (35020060- IDEAM) and Nare (35010080-IDEAM), administered by the Instituto de Hidrología, Meteorología y Estudios Ambientales (IDEAM). Information related to the soil, total available water (TDA), maximum infiltration rate, maximum root depth and initial depletion of soil moisture was obtained from the general study of soils and land zoning in the Department of Meta 18.
3. Results
3.1. Water footprint of fresh fruit bunches (FFBs) from the oil palm plantation
Oil palm is considered the oilseed with the highest productivity, reaching oil yields between 6 and 10 times greater than those of other species 19. By 2019, Colombia was the fourth producer in the world and first in Latin America, according to the Federación Nacional de Cultivadores de Palma de Aceite 19. The research included the analysis of 15 productive units (PUs) of oil palm (the units were determined from the continuity of land use), for a total of 2,938.22 ha. The average yields of the palm cultivation were determined in consultation with local producers, where the average was 18 tons per hectare, a value that was taken as a reference for the calculations of the blue and green components of the WF of the FFBs. In Table 1, the results of the WF and its respective descriptive statistical analysis are presented. The total WF per hectare/year of the PU analyzed was 12,227.4 ± 401.0 m3, of which 8,696.0 ± 741.2 m3 represented the green water footprint (WFgreen), that is, water taken by the crop from precipitation or humidity of the soil without surface runoff processes, and 3,531.4 ± 730.3 m3 corresponded to the blue water footprint (WFblue), associated with the irrigation needs of the crop.
Table 1 Results and descriptive statistical analysis of the water footprint for oil palm production units (PU) in the Piedemonte Llanero, Colombia
| Area (Ha) | WFgreen/Ha (m3/year) | WFblue/Ha (m3/yea) | WWtotal/Ha (m3/year) | WFgreen_FFBs (L/kg) | WFblue_FFBs (L/kg) | WFtotal_FFBs (L/kg) | ||
|---|---|---|---|---|---|---|---|---|
| Guayuriba river basin (353,166.83 Ha) | PU 1 | 1 | 10,335.0 | 2,582.0 | 12,917.0 | 413.4 | 103.3 | 516.7 |
| PU 2 | 72 | 9,432.2 | 2,774.9 | 12,207.1 | 377.0 | 111.0 | 488.3 | |
| PU 3 | 109 | 9,232.2 | 2,960.7 | 12,192.9 | 369.3 | 118.4 | 487.7 | |
| PU 4 | 36 | 9,432.3 | 2,775.0 | 12,207.3 | 377.3 | 111.0 | 488.3 | |
| PU 5 | 1.101 | 8,993.0 | 3,004.2 | 11,997.1 | 359.7 | 120.2 | 479.9 | |
| PU 6 | 523 | 7,919.9 | 3,008.6 | 10,928.5 | 316.8 | 120.3 | 437.1 | |
| PU 7 | 313 | 9,034.6 | 3,143.5 | 12,178.2 | 361.4 | 125.7 | 487.1 | |
| PU 8 | 187 | 9,113.5 | 3,122.1 | 12,235.6 | 364.5 | 124.9 | 489.4 | |
| PU 9 | 201 | 9,056.3 | 3,151.1 | 12,207.3 | 362.3 | 126.0 | 488.3 | |
| Caño Quenane-Queanito basin (52,600 Ha) | PU 10 | 33,2 | 7,984.8 | 4,429.1 | 12,413.9 | 319.4 | 177.2 | 496.6 |
| PU 11 | 3,25 | 8,083.3 | 4,454.3 | 12,537.6 | 232.3 | 178.2 | 501.5 | |
| PU 12 | 96 | 7,960.8 | 4,399.8 | 12,360.6 | 318.4 | 176.0 | 494.4 | |
| PU 13 | 2,81 | 7,932.5 | 4,371.2 | 12,3037 | 317.3 | 174.8 | 492.1 | |
| PU 14 | 124,36 | 7,963.4 | 4,388.2 | 12,351.6 | 318.5 | 175.5 | 494.1 | |
| PU 15 | 135,6 | 7,966.7 | 4,405.8 | 12,372.5 | 318.7 | 176.2 | 494.9 | |
| Mean | 8,696 | 3,531 | 12,227 | 347.8 | 141.3 | 489.1 | ||
| SD | 741.2 | 730.3 | 401.0 | 29.6 | 29.2 | 16.0 | ||
| CV (%) | 8.52 | 20.68 | 3.28 | 8.52 | 20.68 | 3.28 | ||
| Maximum | 10,335.0 | 4,454.3 | 12,917.0 | 413.4 | 178.2 | 516.7 | ||
| Minimum | 7,919.9 | 2,582.0 | 10,928.5 | 316.8 | 103.3 | 437.1 | ||
Source: own elaboration
The standard deviation for WFgreen was 8.52%, that of WFblue was 20.68%, and that of the total water footprint was 3.28%, which shows that homogeneous behaviors are present for the different PUs studied. WFblue had the highest value, and this was associated with the water supply (rainfall) in some sectors, which reduces the need to include irrigation in the production system. In terms of product, the water footprint generated for the production of one kg of oil palm FFBs on average was 489.1±16 m3/kg, representing 347.8±?29.6 m3/kg of WFgreen (71%) and 141.3?29.2 for WFblue (29%) (Figure 1).
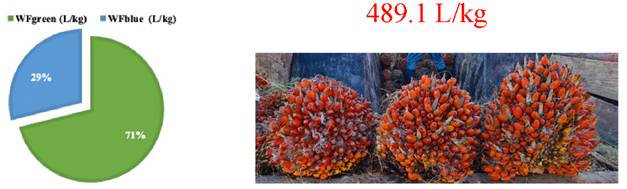
Source: own elaboration
Figure 1 Percentage distribution of the water footprint for the production of fresh oil palm fruit at a subregional scale (Piedemonte Llanero).
These values are lower than those estimated by Mekonnen and Hoekstra, 13 where the WF of FFBs reached 1595.7 m3/kg, differences that can be explained due to the details of the information incorporated in the analysis. Mekonnen and Hoekstra 13 used generic averages at the country level, an analysis strategy that may be valid for global studies, while the present study used data on climate and crop production at the local level. However, the WF values are still below the data reported by Rueda-Punina20 for the Province of Guayas, where the WFblue reached 588.5 m3/kg and the WFblue reached 231.49 m3/kg, and in Thailand, the estimatations by Suttayakul et al.21 were 821 m3/kg for the WFgreen and 60 m3/kg for the WFblue in the Krabi region and 770 m3/kg for the WFblue and 142 m3/kg for the WFgreen in Suratthani. These data show that Piedemonte Llanero has comparative advantages in terms of the production of fresh oil palm fruits because they require less water in this region. Thus, the need to consider local data for each region is reaffirmed, and considering local data guarantees effective tools for decision-making related to the management of water resources.
Regarding the temporality of the WFgreen and WFblue, it was found that in the months of April, May and June, the WFgreen represented 100% of the consumption, and in October, it reached 80% of the consumption (Figure 2), which is related to the seasons of rains in the Piedemonte Llanero 22.
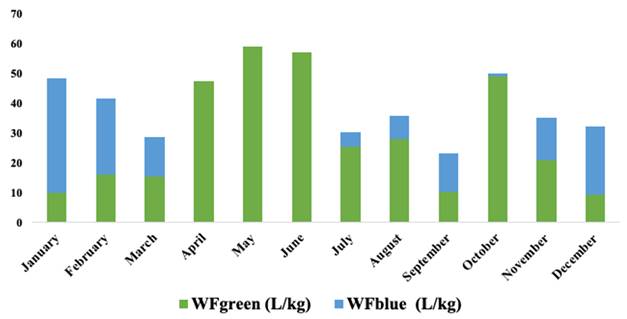
Source: own elaboration
Figure 2 Temporal distribution of the green and blue water footprint for the production of fresh oil palm fruit in the Piedemonte Llanero.
The WFblue increased in the months corresponding to times of less rain or drought. With the above information, the approach of Hoekstra et al. 15 related to the temporal and spatial influences of the territory on water requirements was confirmed, especially in terms of agricultural production systems, where rains (green water) are the main source of water. Green water sources represent between 70-80% of the total world agricultural water use, while only the remaining 20-30% is derived from blue water sources 23,24. Relatedly, Tovar-Hernández et al. 10 suggest the need to include agricultural planning where localities with a high capacity are assigned to each production system and thus maximize water productivity and contribute to the efficient use of the resource in this production sector.
4. Conclusions
The production of oil palm FFBs in the Piedemonte Llanero is supported by 71% green water or rainwater between April and June, when there is no blue water needed for cultivation, thus reducing pressure on the water resource. This scenario is in contrast to that during the period of drought, when in January, the greatest contribution of water from surface or underground sources are required.
It should be noted that in comparison to other regions, the foothills of the plains require less water for the production of fresh oil palm fruit, represented by a WFgreen that reached 347.8 m3/kg and a WFblue that reached 141.3 m3/kg. This type of study reiterates the need for agricultural planning based on the water requirements of crops, which, as in the case of oil palm, should be cultivated in regions with agroclimatic advantages, such as the natural supply of water from rainfall throughout the year.

