


 English (pdf)
 Article in xml format
 Article references
 Send this article by e-mail
 Cited by SciELO
  Cited by Google
  Similars in
SciELO
Similars in
SciELO  Similars in Google
 Permalink
1. Introduction
Fruit consumption is increasing worldwide due to the social and scientific recognition of the nutritional and functional properties of fruits. In the last two decades, global horticultural imports increased their participation among food imports 1). The promotion and development of the fruit sector is an important source of agricultural growth for Colombia, to promote rural employment and equitable development for the different regions 2,3). Given the great diversity of climates and soils, Colombia is a large producer of a wide variety of citrus fruits. This scenario enables exploring new markets and satisfying the demand for citrus fruits in countries that lack suitable climate conditions for this type of crop 4). According to the Food and Agriculture Organization (FAO), in developing countries, most of the products destined for rural and urban markets are harvested by hand. Due to the different stages of fruit ripening and the need for gradual harvesting, an optimized manual harvesting process reduces the probability of product damage compared to mechanized harvesting 5.
One of the greatest topographic difficulties in agriculture is field slope, which refers to the inclination of the land compared to a horizontal plane that passes through its base. It is expressed as a gradient calculated in sexagesimal or centesimal degrees or percentage and, in trigonometric terms, corresponds to the tangent of the angle formed between the decline and its corresponding horizontal 6,7. Several studies focus on the slope of the land and its relationship with agricultural processes. Researchers such as 8,9) agree that soil quality attributes are related topographic properties such as slope position, slope gradient and slope aspects, on the other hand 10), reference the field slope as one of the factors that influences the crops, another aspect attributed to the slope of the land refers to accidentality, the investigation of 11 on the harvest and felling of trees indicating that the risk of suffering an accident increases with the slope of the land.
In the context of the effect of the slope of the land on the use of agricultural machinery are the works carried out by 12 which compared tree harvesting systems by analyzing the productivity of two winch procedures and the influence of soil conditions. One of the procedures was analyzed on flat ground and the other on steep ground. The authors reported significant differences in wind speed of cut trees caused by slope conditions, 13 they determined or the effect of terrain slope on the productivity, cycle time, and elementary times of a Valmet 450 FXL self-leveling processor that processes a pine plantation. In contrast to previous research, no significant differences were found between processor productivity, Cycle time and elementary times (movement/positioning, balancing and processing) between slope classes, 14 presents an Integrated Forest Information System (FIS) for optimizing forest production in mountainous areas, Finally, 15 evaluated the operational performance and efficiency of a coffee harvester on a steep slope under different situations and speed fluctuations, finding that the field slope influences the performance of the machine.
In Colombia, the harvesting process greatly depends on manual labor, which affects harvest yield due to different factors, including the topography, the lack of uniformity in fruit ripening, tree height, and the absence of new technologies 16. The agricultural sector displays a limited integration of technologies, which leads to increased production costs that affect harvest indicators, such as quality and productivity 17,18.
According to the National Administrative Statistics Department (DANE, for its acronyms in Spanish) of Colombia, Caldas holds fifth place in orange fruit production nationwide 19). Consequently, the cultivation of citrus is one of the priorities for the department to strengthen the competitiveness of the region. This requires developing more productive and sustainable agricultural systems to meet the growing demand for food. According to 20), mechanization is crucial for transforming agricultural systems and improving productivity, but as stated above, topographical conditions make it difficult to apply.
This study aimed to determine whether there is an influence between ground slope conditions and indicators of quality, losses, efficiency, and effectiveness measured during manual citrus harvesting.
2. Methodology
2.1 Characteristics of the terrain area
For the choice of the farms studied, a non-probabilistic sampling was carried out for convenience in which farms that are in the range greater than 20 hectares cultivated in citrus fruits and that meet the following criteria of inclusion were selected:
Meet the characteristics of owning terrain ranging from plain to slope greater than 76 degrees of inclination.
Possess Valencia orange planting.
Extension of planting of valence orange greater than 100 hectares.
Express your desire to belong to research and collaborate with access to information.
The different field slopes were classified into four categories, according to the percentage and degree of inclination, as shown in (Table 1).
2.2. Harvesting indicators
As in agricultural operations where manual harvesting processes are presented, the variables involved in the operation are affected by climatic conditions, land, experience, and method of collection among others, as expressed by 21 "an excellent collection reconciles the indicators of quality, efficiency, efficiency and losses, and allows an optimization of the resources used in the process". the harvest indicators are described in (Table 2).
Table 2 Harvesting indicator
| Harvesting Indicator | Harvesting measurement |
|---|---|
| Efficiency | Number of baskets/Working day (baskets =23.4 kg of fruits) |
| Effectiveness | Number of oranges left on the tree/Working day |
| Quality | Percentage of fruits classified: Big-medium-small-stained/baskets |
| Losses | Number of fruits falling on the ground while harvesting a tree |
Source: adapted from Velez et. al21
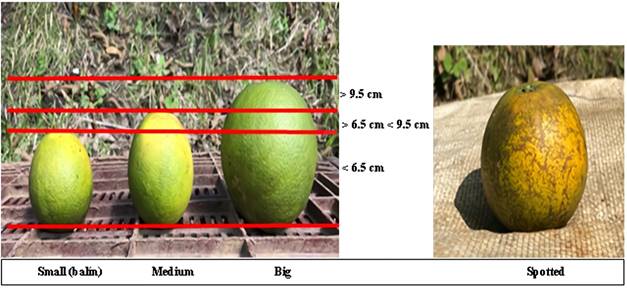
The quality indicator was assessed based on the number of large, medium, small (i.e., “balín” fruits), and spotted Valencia orange fruits harvested in each slope condition. We estimated fruit quality based on the diametric range groups illustrated in (Figure 1), except for spotted oranges, which were found in the three size groups. The qualification of spotted fruit was assigned by the harvester and was based on the presence of spots that exceed approximately 20% of the fruit surface area.
We sorted and counted the number of oranges in the baskets, which were randomly selected at intervals of 12 minutes in the low season and 6 minutes in the high season (i.e. 5 baskets per harvester per hour/working day in low season and 10 baskets per harvester per hour/working day in high season). Additionally, we recorded the weight of the fruits to determine the average weight, the amount in kilograms (Kg) collected, and the percentage share of each Valencia orange quality group.
2.3. Statistical analysis
We performed an analysis of variance (ANOVA) to establish if the slope condition significantly affects harvest efficiency, effectiveness, and losses. Our null hypothesis was that there is no effect of slope condition on the harvest indicators. First, we evaluated the assumptions of normality, homogeneity of variance, and randomness of the indicators to determine the adequate statistical tests for our analyses (e.g. parametric or non-parametric). We found three indicators that did not adjust to the assumptions of normality and homogeneity of variances, so we performed a non-parametric analysis of Kruskal-Wallis H variance.For the non-parametric Kruskal-Wallis H test, we compared the median values of each indicator in the four slope conditions, according to the following hypotheses:
Ho: The medians of the variables are the same or show no significant differences (Me1 = Me2 = Me3 = Me4); therefore, there is no relationship between the variable slope condition and the harvest indicator.
Ha: The medians of the variables are not equal and there are significant differences (Me1 ≠ Me2 ≠ Me3 ≠ Me4); therefore, there is a relationship between the variable slope condition and the harvest indicator.
When the null hypothesis was rejected for the non-parametric ANOVA, we performed a Mann-Whitney U test to determine which indicators showed significant differences between slopes. For this, we compared pairwise medians considering the following hypotheses:
Ho: The pairwise medians are the same or show no significant differences (Me1=Me2).
Ha: The pairwise medians are not equal and there are significant differences (Me1≠Me2).
Finally, the results are graphically analyzed through box-and-whisker plots to determine the differences between the slope conditions.
3.Results
We found significant differences for indicators of harvest efficiency, effectiveness, and losses between slope conditions, demonstrating an effect of the topography (i.e. field slope) on the manual harvesting process.
3.1. Quality indicators
We determined that the average weight of a harvested fruit basket is 23.5 kg, of which 14.8 kg correspond to large oranges (62.9%), 5.16 kg to medium-size oranges (21.9%), 1.18 kg to small or balín oranges (5.01%), and 2.36 kg to spotted oranges (10.1%). The results obtained for the quality indicators at each slope condition are shown in (Table 3). We found no significant differences in quality values between slope conditions; therefore, we infer that the quality indicators are not affected by the slope conditions of the crop field.
Table 3 Average weight of oranges per basket for each slope condition according to quality indicators.
| Slope condition | Quality indicator average per basket (Kg) | Average Weight (Kg) | |||
|---|---|---|---|---|---|
| Big (Kg) | Medium (Kg) | Small (Balín) (Kg) | Stained (Kg) | ||
| Nearly level to gently sloping | 15.01 | 5.22 | 1.15 | 2.36 | 23.74 |
| Moderated and strongly sloping | 14.59 | 5.25 | 1.21 | 2.32 | 23.37 |
| Steep | 14.96 | 5.21 | 1.18 | 2.37 | 23.73 |
| Very steep | 14.62 | 4.97 | 1.19 | 2.41 | 23.19 |
| Total average (kg) | 14.80 | 5.16 | 1.18 | 2.36 | 23.51 |
| Total average (%) | 62.9 | 21.9 | 5.01 | 10.19 | 23.5 |
Source: own elaboration
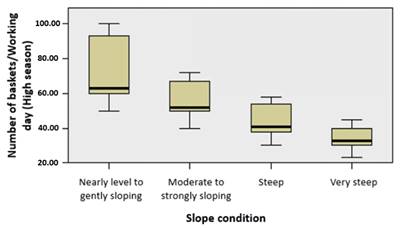
Regarding the high season, we found statistical differences for all pairwise comparisons between slope conditions (Table 4 and 5). Our results indicate that the number of baskets collected per working day during high season is influenced by field slope conditions, mainly steep and very steep slopes.
Table 4 Mann-Whitney u-test for effect of slope on efficiency indicators in low season.
| Condition1-Condition 2 | Test Statistic | Error | Test Statistic Desviation | Significance | Adjusted Significance |
|---|---|---|---|---|---|
| Very steep-Steep | 39.49 | 11.566 | 3.414 | 0.001 | 0.004 |
| Very steep- Moderate to strongly sloping | 80.5 | 11.566 | 6.96 | 0 | 0 |
| Very steep- Nearly level to gently sloping | 111.13 | 11.566 | 9.608 | 0 | 0 |
| Steep- Moderate to strongly sloping | 41.01 | 11.566 | 3.546 | 0 | 0.002 |
| Steep- Nearly level to gently sloping | 71.64 | 11.566 | 6.194 | 0 | 0 |
| Nearly level to gently sloping-Moderate to strongly sloping | 30.63 | 11.566 | 2.648 | 0.008 | 0.49 |
Source: own elaboration
Table 5 Mann-Whitney u-test for effect of slope on efficiency indicators in high season.
| Condition1-Condition 2 | Test Statistic | Error | Test Statistic Desviation | Significance | Adjusted Significance |
|---|---|---|---|---|---|
| Very steep-Steep | 42.71 | 11.57 | 3.691 | 0 | 0.001 |
| Very steep-Moderate to strongly sloping | 89.18 | 11.57 | 7.708 | 0 | 0 |
| Very steep-Nearly level to gently sloping | 122.67 | 11.57 | 10.602 | 0 | 0 |
| Steep-Moderate to strongly sloping | 46.47 | 11.57 | 4.016 | 0 | 0 |
| Steep - Nearly level to gently sloping | 79.96 | 11.57 | 6.911 | 0 | 0 |
| Nearly level to gently sloping-Moderate to strongly sloping | 33.49 | 11.57 | 2.895 | 0.004 | 0.023 |
Source: own elaboration
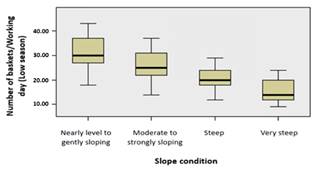
Similar to our findings for the low season, the box and whisker diagram (Figure 2), shows differences in variability ranges between slopes. We also observed an inverse relationship between the efficiency indicator and the field slope condition; therefore, the number of baskets collected is greater when the angle of inclination of the terrain is lower. Likewise, the lack of outliers suggests that the variation in harvest efficiency in each slope condition during high season is under control.
3.3. Effectiveness indicator
We found statistically significant differences for effectiveness indicators between the following slope conditions: “nearly level to gently sloping - steep”, “nearly level to gently sloping - very steep”, and “moderate to strongly sloping - very steep”, (Table 6).
Table 6 Mann-Whitney u-test for effect of slope on effectiveness indicators
| Condition1-Condition 2 | Test Statistic | Error | Test Statistic Desviation | Significance | Adjusted Significance |
|---|---|---|---|---|---|
| Nearly level to gently sloping- Moderate to strongly sloping | -18.54 | 11.548 | -1.605 | 0.108 | 0.65 |
| Nearly level to gently sloping- Steep | -47.97 | 11.548 | -4.154 | 0 | 0 |
| Nearly level to gently sloping- Very steep | -60.17 | 11.548 | -5.21 | 0 | 0 |
| Moderate to strongly sloping- Steep | -29.43 | 11.548 | -2.548 | 0.011 | 65 |
| Moderate to strongly sloping- Very steep | -41.63 | 11.548 | -3.605 | 0 | 0.002 |
| Steep -Very steep | -12.2 | 11.548 | -1.056 | 0.291 | 1 |
Source: own elaboration
Furthermore, the number of oranges left on the tree in a working day differed significantly depending on the degree of inclination of the field slope.
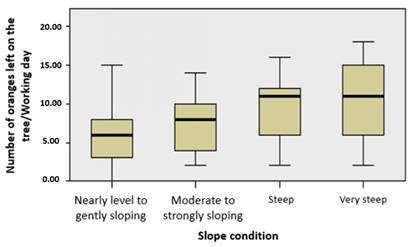
The slope conditions showed significant differences regarding the median number of oranges left on the tree/working day, as shown by the box and whisker diagram in (Figure 3). Based on differences in quartile proportionality, we observed that this indicator is most variable under steep and very steep slopes, while nearly level to gently sloping and moderate to strongly sloping conditions show more homogeneity regarding the number of oranges left in the tree.
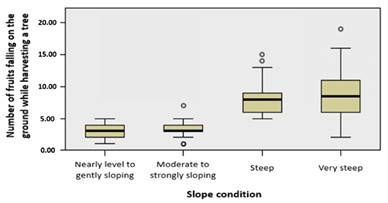
3.3. Losses indicator
We found no statistically significant differences in the number of unrecovered fallen oranges (losses) between “nearly level to gently sloping - moderate to strongly sloping” and “steep - very steep” slope conditions (Table 7). These results can be explained by similar degrees of inclination of these slope conditions. Therefore, a greater angle difference between slopes leads to a higher variation in the number of fallen oranges.
Table 7 Mann-Whitney u-test for effect of slope on losses indicators.
| Condition1-Condition 2 | Test Statistic | Error | Test Statistic Desviation | Significance | Adjusted Significance |
|---|---|---|---|---|---|
| Nearly level to gently sloping- Moderate to strongly sloping | -11.34 | 11.499 | -0.986 | 0.324 | 1 |
| Nearly level to gently sloping- Very Steep | -96.48 | 11.499 | -8.39 | 0 | 0 |
| Nearly level to gently sloping- Steep | -98.74 | 11.499 | -8.587 | 0 | 0 |
| Moderate to strongly sloping- Very steep | -85.14 | 11.499 | -7.404 | 0 | 0 |
| Moderate to strongly sloping- Steep | -87.4 | 11.499 | -7.601 | 0 | 0 |
| Steep -Very steep | 2.26 | 11.499 | 0.197 | 0.844 | 1 |
Source: own elaboration
Furthermore, the box and whisker diagram (Figure 4 and 5) showed significant differences in the variability ranges and quartile proportionality of number of fallen fruits at steep and very steep slopes. Furthermore, the presence of outliers in the number of fallen oranges per working day for a slope condition suggests uncontrolled variation due to special events occurring during manual harvesting.
Source: own elaboration
Figure 4 Box and whisker diagram for assessing the influence of slope conditions on effectiveness indicators.
4.Discussion
Regarding the quality indicator and supported by the results obtained, it is presumed that the quality of the fruit, measured in terms of size and surface appearance, does not present statistical association with the slope conditions of the terrain, the quality depends on external factors, attributed temperature, which as indicated by22) , it must be taken into account that citrus fruits, as well as other tropical and subtropical fruits, present a special sensitivity to low temperatures, which is manifested by different alterations and spots on the skin, known generally as cold injury, cold damage or chilling injury (CI), and which can involve a high loss of commercial quality, moisture, substance or fertilizer used to improve soil quality, fumigation techniques and efficient herbicide management. Like citrus leprosis, as it is known, it is caused primarily by citrus leprosis virus C (CiLV-V) 23.
As previously expressed, the harvest seasons were separated into high and low seasons, due to the significant difference that occurs in the average number of fruits collected in basket units per working day. As the slope softens, there is an average increase in the efficiency indicator, finding percentage increases of 32% when going from the very steep slope to the steep slope, 27% when moving from the steep slope to the moderated to strongly sloping and 27.5% of the moderated to strongly sloping to the Nearly level to gently sloping, in the high season and the same phenomenon occurs in the low season with percentages of 33%, 26% and 20% respectively, presenting a greater percentage difference in each inclination in the season with the fewest number of fruits on the tree.
Finally, the effectiveness indicator did not show any significant difference between harvest seasons, since the fruits suitable for harvesting and that are not collected during the day, are due to the location they present in the tree, making it difficult for the collector to reach them with his hands, being necessary in some cases the use of additional elements such as rods with adapted devices to grasp the fruit; On the other hand, the indicator of losses occurs when the collector drops the fruits to the ground, due to the difficulty of holding it when taking them from the tree, this indicator increases when conditions of steep and very steep slope are present, since the shape of the fruit, this rolls and it is not possible to recover it from the areas close to the process. evidently ratifying that slope conditions affect this indicator.
5.Conclusions
There is a clear influence of field slope condition on harvest efficiency, effectiveness, and losses, while harvest quality is affected by factors other than the slope of the terrain. By categorizing the field slope in ranges and pairs, we determined statistically significant relationships at extreme slope conditions, such as nearly level to gently sloping and very steep.
As demonstrated by the Mann-Whitney U test, the efficiency indicator is the one that presents the greatest alterations in the terrain with a very steep and extremely steep slope, the slope type factor, allows us to see an inverse relationship, so that the number of baskets collected is greater if the angle of inclination of the terrain is smaller.
Field slope conditions hinder the automation and mechanization of the harvesting process; therefore, determining the impact of field slope on manual harvesting indicators is a promising research topic to improve the productivity of the agricultural sector.
The project did not consider the experience of the collectors, because the ranges of experience calculated in years did not present statistically significant differences, but the authors consider that the experience of the collectors is an important factor that should be considered and analyzed in future research with a larger population sample.
The study of harvesting indicators will help to identify the main factors that are involved in the manual harvesting process of citrus, helping to develop new tools with ergonomic characteristics that allow to improve the yields of the process and contribute to the improvement of the postures that they generate. musculoskeletal injuries to collectors.

