


 English (pdf)
 Article in xml format
 Article references
 Send this article by e-mail
 Cited by SciELO
  Cited by Google
  Similars in
SciELO
Similars in
SciELO  Similars in Google
 Permalink
1. Introduction
Computer-aided diagnostics (CAD) refers to the set of processes that support medical specialists in the interpretation of visual content related to patient examinations 1,2. A CAD system is based on image preprocessing, segmentation and structuring for subsequent classification and evaluation 3. In the preprocessing and segmentation stages, imperfections are corrected and structures of interest are searched for and analyzed individually as regions 4, which are inspected in the structuring stage according to size, shape, conformation, etc. CAD processes are developed using software based on algorithms that allow their application on digitized images, which usually correspond to ultrasounds, radiographs, CT scans and mammograms 5,6. Its purpose lies in the detection and identification of suspicious regions, which in some cases is represented as smaller information in the image and may appear as elusive to the human eye 7.
Specific medical areas of application for computer-aided diagnosis include the analysis of mammograms and Chest CT scans. Mammograms are images captured by X-rays applied to the initial search for distinctive features and signs of breast cancer and are generally the first tool available to specialists for the detection of breast cancer or associated diseases 8. Mammograms can be classified as screening, applied to detect alterations in women who have no signs or symptoms of abnormalities or diagnostic focused on the analysis of suspicious changes in the breasts, or findings in screening mammograms. On the other hand, Chest CT scans use computer processing to generate cross-sectional slices of the organ from different angles 9,10. With these, signs of inflammation, injury or disease in the lungs are detected and performed by radiology professionals 11. The quality of the images and the diagnosis generated by the specialist when analyzing mammograms and Chest CT scans become relevant 12, if we take into account that lung cancer and breast cancer were two of the five leading causes of death in the world with 1.8 and 0.685 million deaths, according to figures from the World Health Organization 13.
In image processing systems, edge detection is one of the stages of greatest interest and is performed by analyzing abrupt changes in pixel intensity 14. In medical imaging and for computer-aided diagnosis, the denotation of regions of interest is required, so that only those sectors of the image related to the object of study, such as breasts and lungs, for mammograms and Chest CT scans, are taken into account to start processing 15. As for the internal study, the detection and analysis of breast borders allow the identification of dense breast tissues with particular shapes and borders different from the rest of the tissue. On the other hand, for Chest CT analysis, the size, borders and solid component are some of the characteristics that are taken into account when defining whether a nodule is benign or malignant 16.
In their study, Dhruv et al 17 review the edge detection techniques most commonly used in the medical field, emphasizing the operators based on Roberts, Sobel, Prewitt and Canny, where they highlight for the latter algorithm the use of the Gaussian filter as a method of image defocusing, to subsequently obtain the magnitude and orientation of the gradient of the image. Likewise, Devkota et al 18 developed a method for the detection of early-stage tumors using mathematical morphology reconstruction, where they initially subject the image to preprocessing accompanied by median filtering, and where the morphological operation used is erosion to complement initial segmentation stages. In addition, Manikandan et al 19. show in their study the implementation of a bilateral filter and edge detector based on the Canny algorithm for telemedicine applications. The bilateral filter was used as an edge-preserving alternative to the Gaussian filter since the latter is applied uniformly to the image. In addition, the authors indicate as 5 the maximum kernel size, followed by the application of convolution masks to determine the gradient of the image. Conventionally developed methods and systems for image processing are based on pre-trained algorithms (such as the Canny algorithm, one of the most widely used in the literature), which, like methods based on machine learning and deep learning, require more hardware resources for real-time implementation.
This work presents and develops a method for edge detection in medical images, applicable to computer-aided diagnosis processes using a personal computer with a Core-i7 processor and 4GB of RAM. The method consists of the analysis of pixel distribution histograms accompanied by the morphological gradient operation and is applied to mammography and chest CT images, in the framework of an image processing-based system. The developed method is validated by comparison with other thresholding techniques, as well as with specialized edge detection algorithms such as the Canny algorithm, and with deep learning techniques based on neural networks such as the Holistically-Nested Edge Detection (HED) algorithm. The image processing steps are visualized through a graphical user interface that, together with the processing, were developed in Python programming language. The developed processing system plans to contribute to improvements in the features of medical mammography and CT images through a first approximation of edges and contours, and to reduce the computational requirements for large-scale implementation with respect to specialized edge and contour detection methods. The developed study is presented as the initial stage of a computer-aided diagnostic processing system, that preserves and improves image characteristics and initially approaches image edge detection.
2. Methodology
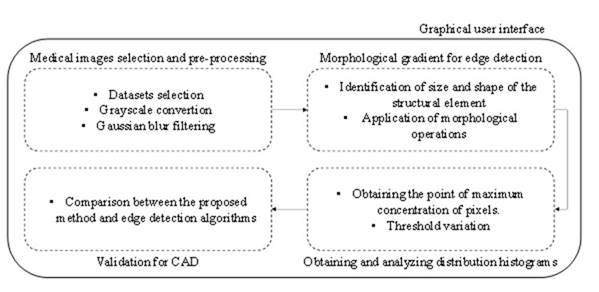
Figure 1 summarizes the methodology proposed for the research development. In the first stage, the medical images to be used are selected and preprocessing stages are applied by conversion to grayscale and Gaussian smoothing filtering. In the second stage, the gradient morphological filter is used for edge detection by implementing morphological operations accompanied by a structural element. Likewise, in the third stage, pixel distribution histograms are obtained, emphasizing the histogram peaks and defining a threshold variation. Finally, in the fourth stage, the developed method is validated for its implementation in a CAD system by comparing it with algorithms for edge detection. For the implementation of the processing system, a graphical user interface is developed.
2.1. Medical images selection and preprocessing
The images used for testing the edge detection method in medical images by histogram and morphological gradient analysis are from two of the most common medical examinations, mammograms and Chest CT scans 20.
For the mammograms, images from the MINI-MIAS Dataset, a database of the Mammographic Image Analysis Society MIAS were used 21. The dataset contains 322 images and was originally presented with a pixel border of 50 microns, but a modification to the dataset was used that increases the pixel border from 50 to 200 microns. Also, the images are padded so that the image size is 1024 x 1024 pixels. The format of the images is Portable Gray Map (PGM), a special format with image data in the form of grayscale maps 22. Additionally, the dataset contains information about the character of the background tissue, classifying them as fatty, fatty-glandular and dense-glandular, as well as information regarding the type of abnormality such as calcification, well-defined or circumscribed masses, spiculated, ill-defined, architectural distortion, asymmetry or normality.
As for Chest CT scans, we used images belonging to the COVID-CT Dataset 23, a database supported in open source and developed in 2020, as a research strategy in the framework of the COVID-19 pandemic, which, for detection and classification processes, achieved hits of approximately 90 %. The dataset consists of images from 216 patients, with 349 images of COVID-19 positives, and 463 corresponding to NON-COVID, classified manually by visual inspection of the CT images. The images in the dataset present height dimensions from 153 to 1853 pixels, with a mean of 491, while the width dimensions are between 124 and 1485 pixels, with a mean of 383. Additionally, some images in the dataset contain information related to the age and sex of the patients, which is not a parameter of importance when talking specifically about image processing. The images are in Portable Network Graphics (PNG) format. In general terms, the datasets used for both mammography and CT Scan studies are presented as the easiest to use and acquire, since they present labeled, recent data and with files of lower weight than some of the datasets available in Kaggle, medical centers, university centers, among others.
Preprocessing is applied to reduce redundancies in images and facilitate processing 24. The preprocessing stages contribute to the reduction of the amount of intensity variations between nearby pixels, as well as the elimination of those pixels whose intensity is considerably different from that of their neighbors. Among the most important stages of preprocessing are the grayscale conversion and the application of a Gaussian blur filter 25. For the conversion to grayscale, it is necessary to analyze the format in which the images to be processed are found, since for formats such as PGM for mammograms, the image delivered in the dataset is in grayscale, so a grayscale conversion stage is not necessary, while for Chest CT images, which are in PNG format, an initial conversion to grayscale is required. The conversion is performed as shown in Eq.1, where R, G, and B refer to the red, green, and blue color channels, respectively. The second preprocessing stage corresponds to Gaussian blur filtering, in which low-frequency components are added to a previous grayscale image, generating a blurring or smoothing effect to the image. In this case, a Gaussian filter with a mask of size 5x5 is applied. The filter size was defined according to the literature, whereby means of weightings to determine the effect of the kernel size in different applications, it was indicated that good results are obtained with 3x3 kernel, but that in some cases the performance increases when applying filters with 5x5 size. The Gaussian filter with these kernel size values improves the performance behavior of the processes, for example with respect to the Wiener filter, which requires larger kernel sizes to make adaptive changes in the smoothing according to the variance of the pixels 26. Additionally, although the Gaussian smoothing filter is applied uniformly to the image, it manages to blur all sections of the image, while edge-preserving smoothing filters such as anisotropic diffusion filters, besides being iterative (which triggers processing delays), perform adequately only at noise levels that do not exceed 3 % of the image intensity levels 27. Eq.2 presents the mathematical basis of the applied Gaussian filter, where sigma represents the standard deviation, and X,Y represents the size of the mask with a midpoint at coordinates X=0 and Y=0.
2.2. Morphological gradient for edge detection
Morphological operations are a set of image processing techniques that alter images with shape-based structures. The operation is based on applying a structural element to an input image, generating an output image of the same size by a pixel-to-pixel comparison of the input image with its neighbors 28. The two main morphological operations are dilation and erosion. With dilation, objects are more visible and some object spaces are filled, while with erosion, small objects are removed so that only relevant objects intervene in the image 29. For the specific case of medical image processing, it would not be convenient to apply filtering that fills small image spaces or, failing that, eliminates objects of minimum size, since it would alter the original characteristics of the study. For this reason, we propose the use of the morphological operation of gradient, a modification and combination of the operations of dilation and erosion 30.
The morphological gradient corresponds to the subtraction between dilation and erosion operations and generates an image in which the values of each pixel indicate the contrast intensity with respect to its neighbors. The morphological gradient is useful in edge detection and segmentation processes since the output image refers to the contour or silhouette of the image 31. The structural element used is of rectangular type with a matrix of size 3x3 (the nine positions of the matrix will take a value of 1). The morphological gradient operation is represented mathematically in Eq.3.
2.3. Obtaining and analyzing distribution histograms
In digitized images, a histogram refers to a graph containing information corresponding to the distribution of the number of pixels according to the gray level. In typical grayscale images, a histogram presents 256 values, ranging from 0 to 255 32. From the histogram of an image, it is possible to modify characteristics such as brightness and contrast, but it does not provide information on the origin of the pixels, i.e., it does not present information on the spatial relationship of the image. The method is based on tracking the point of highest pixel concentration when inspecting the distribution histogram. With this, a threshold value is obtained that functions as an approximation of the image contours, so that those pixels with concentration values that equal or exceed the threshold value are considered as the image contour 33. Also, a variation of up to ±10% of the threshold value obtained by inspecting the histogram is proposed, so that a larger number of image pixels are taken into consideration. This is because, both in mammograms and in Chest CT scans, different sectors of the image may present similar behaviors in the distribution of pixel concentration along with the digitized image.
2.4. Validation for CAD
For the validation of the proposed method for edge detection based on histogram analysis and inspection and morphological gradient operation, 70 random images from MINI MIAS Dataset, without discrimination of tissue characteristics, class and severity of the anomaly, and 70 random images from COVID-CT Dataset, without discriminating whether the images correspond to COVID-19 positive or negative patients, are used. The 70 images used correspond to images with variable shapes and information to test in all possible states the system based on image processing. Since it is not a system based on computational learning (machine learning or deep learning), it does not initially require a large number of images. Also, the performance in edge detection is compared with respect to other thresholding methods such as mean thresholding, and Gaussian thresholding. The comparison is performed considering thresholding methods since it is at this stage where the separation of classes in the image (border, image interior, image background) is achieved and it is one of these classes that is of interest for the processing. In addition, the comparison is made with respect to the method based on the Canny algorithm, specialized for edge detection, and with respect to Holistically-Nested Edge Detection, a method used for edge detection based on deep learning. Edge detection validation is performed by visual inspection of both the inner and outer contours of the image. Likewise, the response time of the proposed method and of the methods with which it is compared is calculated, taking into account that the developed tool is presented as a support in the processes of computer-assisted diagnosis, in which both efficiency and speed in the processing are required 34.
2.4.1. Graphical user interface
The graphical interface is developed in the Python programming language in the Thonny development environment. The tool is developed based on analysis, design, development, implementation and testing stages, according to ISA-101.01-2015 and IEC/TR 62366 standards, which establish the conditions for interfaces in automation and their application orientation in medical device engineering, respectively 35. In the analysis stage, the requirements are identified, as well as the applicability of the interface, where it is mainly required that the interface shows in a step-by-step manner the image processing stages of both mammography and computed tomography. In the design stage, the spaces in which the information can be entered into the system are taken into consideration. In addition to the title and presentation, the interface has 12 buttons, so that one button is used to load the image into the system and 5 buttons are used to execute each of the processing sections (grayscale conversion, smoothing filtering, gradient morphological filtering, distribution histogram and output image). There are also 3 buttons corresponding to help information, credits and closing the interface. Also, the application has 3 form-like spaces, in which the size of the masks for the smoothing filtering, as well as the size and shape of the structural element for the gradient morphological operation are entered manually. The manually entered information is uploaded to the system by pressing each of the 3 other buttons, respectively. The development and implementation correspond to coding in programming language applying mainly the Tkinter tool, and the tests were performed with images from both MINI-MIAS Dataset and COVID-CT dataset.
3. Results
Initial processing is performed on the medical images with respect to grayscale conversions and Gaussian blur filtering, as shown in Figure 2.
Source: own elaboration
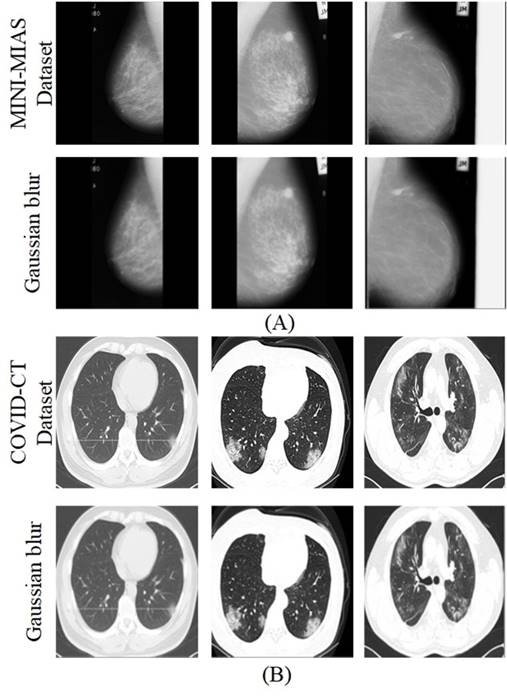
Figure 2. Mammography and Chest CT Scan images preprocessing. Source: MINI-MIAS and COVID-CT Datasets and authors. (A) mammography, (B) CT scans.
The first two rows present the images from the MINI MIAS dataset of mammograms with the Gaussian blur filtering process respectively, while the last two rows present the images from the COVID-CT dataset of chest computed tomography with the Gaussian blur filtering. As mentioned, for the image format the mammograms did not require grayscale conversion, while for the CT scans grayscale conversion was applied before the Gaussian filtering process.
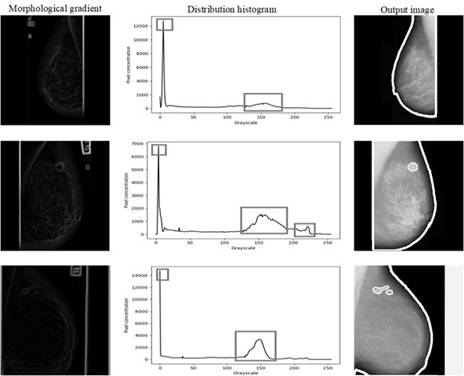
As shown in Figure 3, the gradient morphological filter is applied, and the frequency distribution histogram of the mammography images is obtained and the image with demarcated contours is presented. The threshold value for edge demarcation is obtained from the image histogram. As illustrated, the mean threshold value for mammography images is at approximately T=150, with variable values between T=135 and T=165.
Source: own elaboration
Figure 3. Processing of mammography images by morphological gradient and pixel concentration histogram analysis.
In the distribution histogram more than one peak is represented (referring to high pixel concentration values), where recurrently, in the analyzed images of the MINI MIAS Dataset, the first peak was found with a tendency to the value 0, while the second peak was found in a medium value of the scale between 0 and 255, with varying pixel concentration values according to the characteristics of each image. MINI MIAS Dataset, being a modification to MIAS dataset with image filling for 1024 x 1024-pixel size, presents a variation when obtaining the distribution histogram, since it takes into consideration the dark sections of the image used as filler, so, to obtain the histogram, only the section of the image referring to the breast was used.
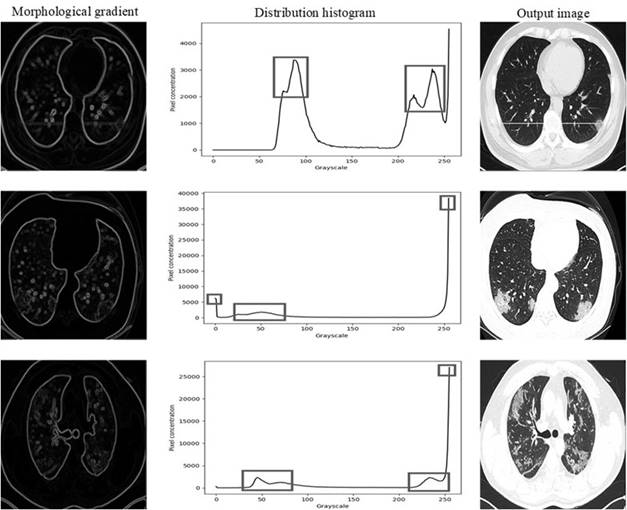
In addition, a morphological gradient filtering process is applied to the Chest CT scans and the concentration histogram is obtained. This is presented in Figure 4. These images show a tendency towards a white hue in the pixels, since the pronounced and relevant peaks were found in the pixels close to 255. Unlike the MINI MIAS Dataset images, the COVID-CT Dataset images do not present any significant filling, so they do not require special treatment to obtain the pixel concentration histogram. In general terms, CT images presented characteristics that generate the threshold value to be in a wider range and not uniform as in the case of mammograms. For CT, the first representative peak is selected and is found between T=50 and T=70, since the peaks found in the sections with T>200 tend to present the background of the image.
Source: own elaboration
Figure 4 Processing of Chest CT Scan images by morphological gradient and pixel concentration histogram analysis.
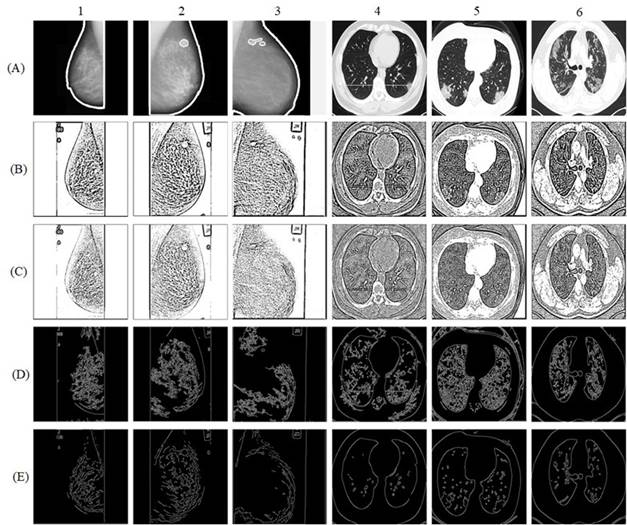
Finally, Figure 5 presents a comparison at the image quality and detection level between the proposed method and other thresholding techniques, such as mean thresholding and Gaussian thresholding, as well as the Canny algorithm and the HED algorithm for mammography and CT images and are shown respectively from top to bottom.
Source: own elaboration
Figure 5 Comparison of edge detection techniques. [1-3] mammography and [4-6] CT scans. (A) Proposed method, (B) mean thresholding, (C) Gaussian thresholding, (D) Canny algorithm, (E) HED algorithm.
The images obtained by applying the mean and Gaussian thresholding techniques generate effects in the image in sections of no interest and demarcate almost the entire image as a region of interest. Under the same behavior, applying the Canny algorithm also generated sections of no interest as if they were regions of interest, and in the case of the mammograms, the identification of the external border was not completed, while in the CT scans the external borders were identified, but redundancy was generated in the internal contours. In addition, the HED algorithm-generated redundancy in the internal contours in mammograms, while in CT scans it improved its performance in terms of external contours. In general, the proposed method improved image features, identified regions of interest and mitigated redundancy effects in both mammograms and CT scans.
In addition, Table 1 shows the comparison of the techniques with respect to response time and CPU requirements, considering that computer-aided diagnosis processes are generated under a processing system. The values used for comparison were chosen randomly from the sample of images used from each dataset. The proposed method presents the third-best average response time with 1.054 seconds, surpassed by the mean thresholding and Gaussian thresholding method by 0.034 seconds and 0.014 seconds. Also, the proposed method is 1.7 and 4.9 times faster than the Canny algorithm and the HED algorithm. In addition, the proposed method is the one that showed the lowest CPU requirement, with an average requirement of 2.54 %, improving to the mean thresholding method and the Gaussian thresholding that required 2.63 % and 2.64 % of the CPU. In addition, the developed method required 1.22 and 3.36 times less of the central processing unit with respect to the Canny algorithm and the HED algorithm respectively.
Figure 6 shows the graphical interface developed. Box 1 shows the title and presentation of the interface. Box 2 shows the button for image loading and visualization. Box 3 shows the buttons for activating the processing steps, while Box 4 shows the spaces for loading the sizes and shapes of the masks for the filters and structural elements. Similarly, box 5 shows the visualization of the processing steps, while box 6 illustrates the help button with information for the use of the graphical user interface.
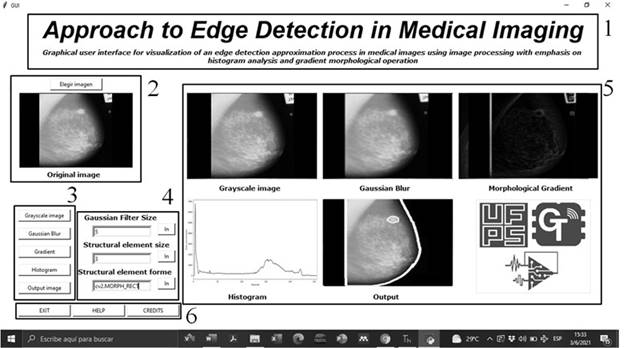
Table 1 Comparison between the proposed method and other techniques of edge detection for CAD
| Response time (s) | Requirements of CPU (%) | |||||||||
|---|---|---|---|---|---|---|---|---|---|---|
| # | Propose | Mean | Gaussian | Canny | HED | Propose | Mean | Gaussian | Canny | HED |
| 1 | 0.98 | 0.99 | 0.96 | 1.65 | 5.5 | 2.50 | 2.55 | 2.65 | 3.12 | 8.65 |
| 2 | 0.99 | 1.01 | 0.99 | 1.85 | 5.4 | 2.43 | 2.54 | 2.63 | 3.25 | 8.43 |
| 3 | 1.1 | 1.03 | 1.1 | 1.45 | 5.34 | 2.67 | 2.57 | 2.47 | 2.99 | 8.39 |
| 4 | 1.5 | 0.98 | 0.99 | 1.73 | 5.21 | 2.38 | 2.43 | 2.63 | 3.05 | 8.53 |
| 5 | 1.6 | 1.01 | 1.05 | 1.68 | 4.99 | 2.46 | 2.75 | 2.87 | 2.98 | 8.76 |
| 6 | 1.04 | 0.96 | 0.95 | 1.69 | 4.98 | 2.50 | 2.71 | 2.69 | 3.12 | 8.54 |
| 7 | 1.01 | 0.94 | 0.93 | 1.87 | 5.1 | 2.67 | 2.65 | 2.64 | 3.06 | 8.51 |
| 8 | 0.94 | 0.99 | 1.1 | 1.98 | 5.2 | 2.47 | 2.54 | 2.53 | 3.17 | 8.49 |
| 9 | 0.96 | 1.05 | 1.3 | 1.83 | 4.98 | 2.53 | 2.63 | 2.76 | 3.22 | 8.63 |
| 10 | 0.95 | 1.03 | 0.93 | 1.77 | 4.99 | 2.45 | 2.48 | 2.65 | 3.27 | 8.45 |
| 11 | 0.96 | 1.1 | 0.99 | 1.54 | 5.05 | 2.68 | 2.67 | 2.51 | 3.12 | 8.53 |
| 12 | 0.99 | 0.97 | 1.103 | 1.93 | 5.1 | 2.75 | 2.69 | 2.57 | 3.21 | 8.56 |
| 13 | 1.03 | 0.96 | 1.2 | 1.95 | 5.25 | 2.73 | 2.75 | 2.67 | 2.99 | 8.57 |
| 14 | 1.1 | 0.99 | 0.99 | 1.84 | 5.4 | 2.62 | 2.72 | 2.53 | 3.19 | 8.45 |
| 15 | 0.9 | 1.13 | 0.96 | 1.78 | 5.37 | 2.41 | 2.56 | 2.47 | 3.11 | 8.56 |
| 16 | 1.05 | 1.17 | 1.102 | 1.83 | 5.5 | 2.45 | 2.68 | 2.67 | 3.09 | 8.53 |
| 17 | 1.1 | 0.98 | 1.01 | 1.87 | 5.29 | 2.53 | 2.89 | 2.69 | 2.97 | 8.65 |
| 18 | 1.03 | 1.1 | 0.99 | 1.9 | 4.96 | 2.55 | 2.56 | 2.75 | 3.15 | 8.49 |
| 19 | 0.95 | 0.99 | 0.96 | 1.84 | 5.29 | 2.67 | 2.64 | 2.79 | 3.21 | 8.52 |
| 20 | 0.91 | 0.96 | 1.1 | 1.76 | 5.23 | 2.38 | 2.61 | 2.69 | 3.12 | 8.59 |
| 𝑥 | 1.054 | 1.02 | 1.04 | 1.79 | 5.21 | 2.54 | 2.63 | 2.64 | 3.12 | 8.54 |
4. Conclusions
The proposed method visually improves edge detection performance over detection methods based on techniques such as median thresholding and Gaussian thresholding, as it focuses exclusively on image regions where sharp changes (which may signify benign or malignant sections) in image hue are observed. With respect to the Canny algorithm and HED algorithm methods, the performance is also superior, since the Canny algorithm failed in some cases to detect and identify the entire outer edge of the image and focused on regions that are potentially of no diagnostic interest. Likewise, the HED algorithm, while mostly successful in identifying the outer contours of medical images, also identified regions of little interest within the image.
Basing the proposed method on the morphological gradient operation allowed a clear image with relevant objects of interest to be obtained from the outset since the subsequent analysis was based on the silhouette appearance of both mammograms and CT scans. In this way, the histogram graph generated shows the trends in image tonality. In addition, it was convenient to obtain the threshold value following the point of maximum pixel concentration in the distribution histogram, since the image hue changes are considerably reduced to the edges or non-edges of the image sections, which is reflected in a pronounced peak in the histograms.
The proposed method presents robustness at the time of processing, since, both for mammography images with reduced image quality conditions and CT images with marked tonalities, the accurate detection of edges and contours of interest in the images is achieved, checked by visual inspection. Likewise, the time employed by the developed method is less concerning the techniques based on mean thresholding, Gaussian thresholding, Canny algorithm and HED algorithm. The proposed method offers the doctor or specialist an image with improved image quality, in addition to the demarcation of potential regions of interest on the original image. Also, the structure based on morphological gradient and pixel concentration histogram analysis improves the internal and external contours of the image facilitating the diagnostic steps and presents a better performance in terms of response time and CPU requirements, making it efficient for computer-aided diagnosis processes. In addition, the developed method is replicable in the future in other types of medical images.

