


 English (pdf)
 Article in xml format
 Article references
 Send this article by e-mail
 Cited by SciELO
  Cited by Google
  Similars in
SciELO
Similars in
SciELO  Similars in Google
 Permalink
1. Introduction
1.1 Research problem
Nowadays, data has become a source of power; the case of Cambridge Analytica is an example of this, where personal data from Facebook was processed to establish profiles based on the users’ physiology and then used to influence U.S. citizens during political campaigns by generating dominant advertisements. Data creates value for companies since it is the fuel of digital transformation 1. Initially, the data may be incomplete, inconsistent, inaccurate, or not updated data; these anomalies in the quality of information can seriously impact the efficiency and effectiveness of organizations and businesses 2. Abnormalities can be caused by many factors that can be technical, such as deficiencies in information processing systems or humans, which vary from errors in information handling procedures to failures due to lack of attention from people who manipulate data. The term data anomaly describes any distortion of information resulting from the data collection process 3.
The relevance of information quality is evident given its impact on decision-making and some operational processes. Thus, international organizations such as the European statistical system 4) have also recognized its importance, which has the mission to provide Europe with high-quality data and statistics. Data quality can also help build and maintain customer relationships that drive real business growth; according to 5, this also means increased regulations and greater strategic recognition of the value of verified business data. According to 6, the poor quality of the data has a cost of 3 trillion dollars per year. These indicated costs 7) include human effort and wasted resources, undetected fraud or compliance penalties, indirect costs ranging from lost customers to diminished brand equity. No less important, poor quality of the data can also lead to critical situations as stated 8, in which the theory is raised that one of the factors that also led to the explosion of shuttle “Challenger” was the problems with the quality of its system data.
Data is collected for different purposes, and there is a need to identify and extract relevant information for analytical purposes. In the particular case for machine learning applications, each model has specific requirements for how the data should be presented for analysis, explains 3. For this reason, data preparation is a critical activity in machine learning exercises, and therefore it is generally the most time-consuming process; according to 9, data scientists spend 60% of their time preparing digital data before it can be explored for helpful information.
This work aims to show how machine learning could be a powerful tool to face data quality problems in the completeness and coherence dimension. However, the purpose of this work isn’t to make a framework, library, or discover which model is the best to solve these quality problems, due that the machine learning model performance depends on the kind of data and its context and wouldn’t be the correct judge a model with only one case of study.
1.2 Data quality
The quality of information is a complex issue; the term quality is defined in 10 as the totality of the characteristics of a product that influence its ability to satisfy declared or implicit needs. The information quality characteristics are distributed in various dimensions; in 11, accuracy, reliability, completeness, and coherence are explained. Because the quality of information has several evaluation dimensions, achieving an adequate quality level is complex. It is also a multidisciplinary area of research that has been approached from statistics, administration, and computer science, as stated in 2.
This work intends to contribute on the dimensions of completeness and coherence. According to the data quality model defined in 10 , completeness is the degree to which the data associated with an entity have values for all expected attributes and related entity instances in a specific usage context. The coherence dimension is defined as the degree to which the data is free of contradiction and consistent with other data equally in a specific usage context.
The activities described in 12 were used to improve the quality of the information in these dimensions, among which are:
The new information acquisition: it is an information acquisition process carried out to update it.
Standardization (or normalization): it is the modification of information with new information following the standard or defined reference formats.
Identification of the object (or linking of records, matching of records, resolution of entities): given one or more sources of information, it has the purpose of identifying those records in the different sources that represent the same object in the real world.
Source reliability: it aims to rate sources based on the quality of information offered by other sources in an open or cooperative context.
Error localization (or error detection): it given one or more sources of information and a set of semantic rules specified in them, it finds records that do not respect such rules.
Error correction: it given one or more sources of information, a set of rules, and a set of errors identified in the records, erroneous values are corrected in the data to respect the general set of rules.
1.3 Case study
This work addresses the problem from a computing perspective by evaluating different machine learning techniques that will allow cleaning and improving data quality, making this a more straightforward task to execute. The dimensions on which the experimentation process is carried out in the search to enhance the quality of information through data cleaning processes with machine learning are completeness and coherence. In the latter, a more in-depth analysis of the concept of duplication takes place, not seeing it as a problem of repeating a record in the same table, but from identifying objects under the business framework, rules applied to the data set.
The work primary focus is based on experimentation with supervised learning techniques, then establishing a methodology for constructing the model and later applying it to a case study. The case study consists of a data set provided by a government entity, which is in charge of monitoring and promoting the well-being of children between 0 and 10 years old. The model was tested on the health and beneficiary files, which will be described in detail in further sections.
2. Machine learning and data quality
Information quality is a multifaceted concept, and the cleaning of poor quality information can be performed by measuring different dimensions and setting out several other activities with various goals. An information quality activity is any process that is performed directly on information to improve its quality. The activities are performed using different techniques that result in different efficiency and effectiveness for measuring and improving information quality dimensions 12. The goal of this chapter is to expose the activities in which machine learning has an impact on their performance, and one of the most representative activities is object identification.
2.1 Object Identification
Object identification is the most important and the most extensively investigated information quality activity13. The goal is to identify objects that may be identical or similar but with different labels or names and link them together. Identification is the process of matching objects from several data sources that refer to the same entities 14. According to 13, object identification has these activities;
Preprocessing: the activity that aims to work on data to standardize it and correct evident errors.
Search space reduction: the object identification problem has a search space dimension equal to the cardinality of A x B, given two sets of records A and B to be compared. The reduction of the search space can be made by three different methods, namely, blocking, sorted neighborhood, and pruning.
Comparison and decision: decision model is used to decide if records in the reduced search space C correspond to the same object, do not match, or no decision can be made automatically, and a domain expert has to be involved.
Quality assessment: activity can be performed, during which measures are evaluated to assess if the result is satisfactory.
Machine learning techniques are used as a solution to perform activity three, comparison and decision, and are classified into the knowledge-based approach. Atlas is one technique that belongs in this approach.
2.1.2 Atlas
This technique improves the knowledge-based approach in the following directions:
The rules include a wide set of domain-independent transformations.
Structural information on rules can be obtained first from an analysis performed on tuples in the input in order to extract knowledge on recurrent similarities between the different pairs of attributes of objects to be matched.
Rules can be obtained through a learning process on a training set, with or without active expert user involvement.
The mapping rule learner is a key concept used in Atlas; the purpose of learning the mapping rules is to achieve the highest possible accuracy for object mapping across various application domains 15. The final goal of determine the most accurate mapping rules, given threshold values. Accuracy of mapping rules is seen as their ability in dividing a given set of training examples in matched/unmatched. Decision trees and active learning procedures are the two methods to perform mapping rule learning.
2.2 Machine learning techniques
Machine learning is a subset of artificial intelligence 16. Basically, machine learning is algorithms that are designed to emulate human intelligence by learning from the surrounding environment 17. According to 18, there are three categories in which machine learning techniques could be divided, supervised learning, unsupervised learning, and reinforcement learning. This work is focused on supervised learning. The defining characteristic of supervised learning is the availability of annotated training data. The name invokes the idea of a “supervisor” that instructs the learning system on the labels to associate with training examples 19. The algorithms used in the experiments of this work were selected by the inspection of other cases of study in 18,20-22, with similar characteristics to the regression and classification problems treated here.
Supervised machine learning techniques explain 20, involve training a model to operate on a set of features and predict a label using a dataset that includes some already-known label values. The training process fits the features to the known labels to define a general function Eq.1 that can be applied to new features for which the labels are unknown, and predict them. The function like this, in which 𝑦 represents the label we want to predict and 𝑥 represents the features the model uses to predict it.
In most cases, 𝑥 is actually a vector that consists of multiple feature values, so to be precise, functions could be expressed in Eq.2
The goal of training the model is to find a function that performs calculation to the 𝑥 values that produce the result 𝑦. This process can be made by applying a machine learning algorithm that tries to fit the 𝑥 values to a calculation that produce 𝑦 reasonably accurately for all the cases in the training dataset.
There are lots of machine learning algorithms for supervised learning, and they can be broadly divided into two types:
2.2.1 Regression algorithms
Algorithms that predict a 𝑦 value that is a numeric value, such as the price of a house or the number of sales transactions or the children beneficiaries weight and height like the case of study.
2.2.1.1 Multiple linear regression
This algorithm examines the relationship between more than two variables Eq.3. Each independent variable has its corresponding coefficient 23.
2.2.1.2 Polynomial regression
In polynomial regression models state 23, the relationship between the independent variable X and the dependent variable Y as an 𝑛𝑡ℎ degree polynomial in X as is shown in Eq.4.
2.2.1.3 Lasso regression
Lasso regression works by introducing a bias term, but instead of squaring the slope, the absolute value of the slope is added as a penalty term called alpha; as alpha increases, the slope of the regression line is reduced and becomes more horizontal, and the model becomes less sensitive to the variations of the independent variable. This model helps reduce overfitting, and it is particularly useful for features selection; it also can be useful when there are several independent variables that are useless 23.
2.2.1.4 Decision Tree Algorithm
As an alternative to a linear model, there's a category of algorithms for machine learning that uses a tree-based approach in which the features in the dataset are examined in a series of evaluations, each of which results in a branch in a decision tree based on the feature value. At the end of each series of branches are leaf nodes with the predicted label value based on the feature values 20.
2.2.1.4 Gradient boosting
Gradient boosting is additive regression models by sequentially fitting a simple parameterized function (base learner) to current “pseudo”-residuals by least-squares at each iteration 24. In gradient boosting machines, or GBMs, the learning procedure consecutively fits new models to provide a more accurate estimate of the response variable. According to 25, the principle idea behind this algorithm is to construct the new base-learners to be maximally correlated with the negative gradient of the loss function associated with the whole ensemble.
2.2.2. Classification algorithms
Algorithms that predict to which category, or class, an observation belongs. The 𝑦 value in a classification model is a vector of probability values between 0 and 1, one for each class, indicating the probability of the observation belonging to each class.
2.2.2.1. Decision trees classification
The decision trees algorithms are a good tool for the description, classification, and generalization of data. It is a way to represent rules underlying data with hierarchical, sequential structures that recursively partition the data. The work in 26 explains how decision trees can be used for data exploration in more than one way, such as description, generalization, and classification in this last discovering whether the data contains well-separated classes of objects.
2.2.2.2 Neuronal network
Neuronal network are information-processing models inspired by the human brain. Artificial neural networks (ANNs) describe 27 are comprised of node layers containing an input layer, one or more hidden layers, and an output layer. Each node, or artificial neuron, connects to another and has an associated weight and threshold. If the output of any individual node is above the specified threshold value, that node is activated, sending data to the next layer of the network. Otherwise, no data is passed along to the next layer of the network.
3. Methodology
For the development of this work, a data set from a government entity with more than 27 million records were used. The methodology for its development is based on the processes for data cleaning that it explains 28 and the quality activities of information mentioned in 12.
3.1 Technological Infrastructure selection
This phase focuses on selecting the necessary infrastructure for processing the files supplied by the entity. It is a crucial phase since the tool chosen must efficiently process files with more than 4 million records, keeping a balance between the costs and benefits of its use. On the other hand, its selection also depends on the language on which the algorithms or models are generated; these languages can be Python, Scala, R.
3.2 Data exploration
The records or observations provide a series of data that must be ordered and used intelligently. Descriptive statistics develop a set of techniques whose purpose is to present and reduce the observed information 29 to characterize the data set through summary measures, tables, or graphs and make a preliminary assessment of the quality of the data. It is essential to highlight that pre-processing is carried out in this phase. It consists of handling null, duplicates, and normalization data.
3.3 Identification of data quality problems
This phase aims to identify the anomalies present in the information that affect its quality in the dimensions of completeness and coherence. These anomalies will be based on experimentation with algorithms and machine learning models to improve the data quality.
3.4 Experimentation
The experimentation is carried out on a representative sample of the data set with the machine learning algorithms for the dimensions of completeness and coherence. In this phase, the model performance is also validated by verifying the various evaluation criteria such as precision, accuracy, and F1 value.
4. Results
4.1 Technological infrastructure selection
For data processing, two types of infrastructure, which are summarized in Table 1, were used. Colaboratory is the first tool used, developed by Google, that allows executing instructions in Python language in the browser. Collaboratory defined in 30 is not a static web page, but an interactive environment called “Colab notebook” that allows writing and code executing . This tool was used to perform file analysis of up to three million records. It was selected because it is a free tool and has good capabilities for the efficient processing of this amount of data. For files with many records greater than three million, Azure HDInsight was used; it is an open-source analysis service and fully managed in the cloud for companies.
Technically explained, 31 Azure HDInsight is a Hadoop component cloud distribution; this tool makes it easy, fast, and cost-effective to process large amounts of data. HDInsight uses the most popular open-source platforms such as Hadoop, Spark, Hive, LLAP, Kafka, Storm, and R, among others; the costs of this tool are shown in Table 1. The programming languages used are Python for the Colab tool and Pyspark for the HDInsight.
4.2 Data exploration
This research used the following files provided by the domain expert, which are described in a general way to contextualize the reader of the kind of data and the quality problems in the different dimensions:
Beneficiaries File: the general characteristics of the file are shown in Table 2. It contains the details of the beneficiary children who are part of the government entity program. It is one of the most relevant files since it includes descriptive information about the beneficiary, providers, and assigned financial resources. Also, this file describes the services that the user takes at a specific time and place. In the dimension of completeness, the file presents 302’364,060 records of null data, representing 35,097% of the total data. Some attributes must be normalized using the StandardScaler functionality of the Python sklearnpre-processing library.
Health File: This file is focused on providing greater detail of the beneficiary children in terms of health status and nutritional monitoring; the general description of the file is set out in Table 3. In the dimension of completeness, the file presents 69’143.474 records of null data that represent 29.72% of the total data.
Table 1 Description of the different infrastructure used for data processing
| Details | Colaboratory | HDInsight Head Node | HDInsight Worker Node |
|---|---|---|---|
| Processor | Not apply. | 4 Core tech | 8 core tech |
| Memory RAM | 25.51 | 28 G | 56 G |
| GPU | K80 de NVIDIA | N/A. | N/A. |
| Hard Drive | 107G | N/A. | N/A. |
| Nodes | Not apply. | 2 | 4 |
| Cost | $0 | $0.75 USD/hour | $2.99 USD/hour. |
Source: own elaboration
Table 2 General characteristics of the beneficiary file
| Characteristics | Value |
|---|---|
| File Name | Beneficiarios.txt |
| Size | 7.7 Gigabyte |
| Record numbers | 4'656.697 |
| Number of columns | 185 |
| Total data | 861’488.945 |
Source: own elaboration
Table 3 General characteristics of the Health file
| Characteristics | Value |
|---|---|
| File Name | Salud.txt |
| Size | 2.3 Gigabyte |
| Record numbers | 2’673.386 |
| Number of columns | 87 |
| Total data | 232’584.582 |
Source: own elaboration
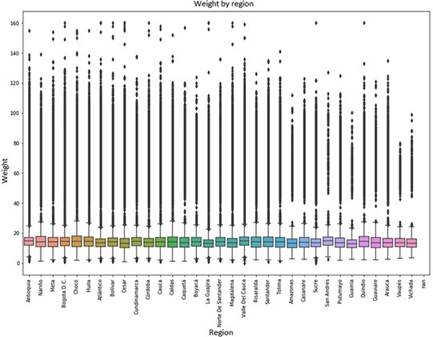
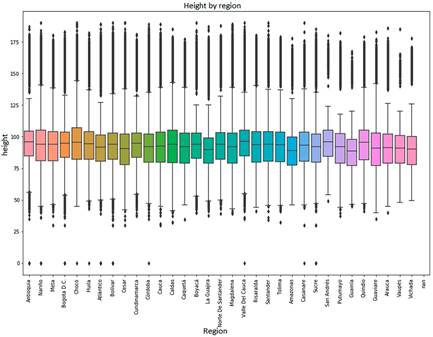
Figures 1 and 2 show the distribution of the data by region of the weight and height of the beneficiary children; reviewing these graphs is possible to affirm that two situations affect the quality of the information. The first one is a considerable amount of atypical data that is a detriment to the quality of the data in the coherence dimension. The second is null data for these attributes, which affects quality in the dimension of completeness.
4.3 Identification of data quality problems to address with machine learning
This phase aims to identify the anomalies present in the information that affect its quality. It is possible to experiment with the different machine learning algorithms to improve the quality. Among the anomalies identified in the descriptive analysis of the data set and treated with machine learning techniques are the following:
4.3.1 Completeness Dimension
The health file has 29.72% of null data, but the null data does not always mean a deficiency in the quality of the information, as stated 2. The missing data can have several representations, that is, the data exists but is not known for some reason, or in fact, does not exist. If the last representation is the correct one in a particular attribute, the quality of the information is not affected. However, within the percentage of null data in the Health file, there are 80,950 null records of the weight and height attributes of the children beneficiaries, and due to their meaning, it is sure that these attributes exist, but they are not available, which represents a quality problem.
There are several ways to replace null data, the most common is to replace it with the average. However, this solution does not apply since the average size is 96.25 cm and the weight is 18.69 kg. This replacement may cause inconsistencies in the information, taking into account that the averages of weight and height may be inadequate for the age of some children and thus affect the quality of the information in another dimension. Therefore, to improve the quality in this dimension, the objective is to predict the weight and the height using different machine learning algorithms.
4.3.2 Dimension of coherence
On the other hand, quality problems were identified in the coherence dimension concerning business rules, but before going into detail about the problem identified, it is crucial to clarify the context of the data provided by the government entity. The data results from executing a program of the entity, whose objective is to promote comprehensive care for children between zero and ten years old. This comprehensive care is made up of the development of vaccination, nutrition, and education activities. These activities are carried out by different service units managed by other contractors, a service unit being understood as adequate physical space for providing, vaccination, nutrition, or education services.
Among the cases of inconsistency identified in this context, there is the provision of services to the same children in the same period in different service units, which is not allowed by the entity. For some cases, the inconsistency is more marked, considering that the different service units involved in a situation such as the one described above are geographically located in distant places, making it physically impossible for the children to be receiving services by these units.
This quality problem is approached from an object identification perspective using machine learning techniques. The objective is to treat the beneficiary entity as a real-world object with spatial and temporal characteristics to identify when a record corresponds to the same object in the real world within the millions of records in the beneficiary file, and which in turn is violating the business rules causing a contradiction in the information.
4.4. Experimentation
4.4.1 Completeness Dimension
As stated in the previous section, the objective to improve quality in this dimension is to predict weight and height to reduce the number of null data for these attributes.
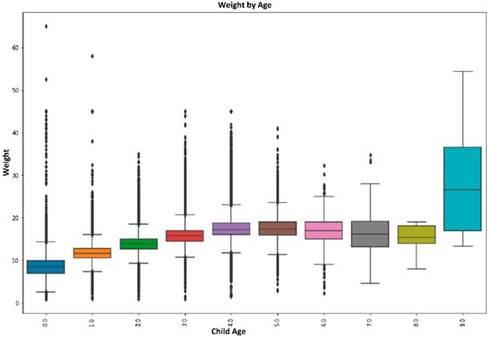
The first activity is identifying some pattern in the behavior of the target variables. To intuit which regression method may be the most appropriate to make the prediction, Figure 3 shows the behavior of the weight while the beneficiary child age increases.
The selection of variables is an important activity in creating a machine learning model. Identifying the correct variables can help save time and reduce space problems 32. The following independent variables are selected; according to 33, these variables impact the value of the target attributes.
Age: many people gain weight as they get older. Adults who have a normal BMI (body mass index) often begin to gain weight during early adulthood and continue to gain weight until they are between 60 and 65.
Region: Social, ethnic, or religious group culture can also affect weight and health due to shared eating and lifestyle habits. In some cultures, foods and beverages high in fat, salt, and added sugar are consumed. Some common food preparation methods, such as frying, can result in high-calorie intake.
Sex: A person’s sex can also affect where fat accumulates on the body. Women tend to get fat in the hips and buttocks. Men generally accumulate fat in the abdomen or stomach.
Ethnicity: some groups that include racial and ethnic minorities are more likely to be obese.
Social security scheme in which a user is classified: this information serves to infer the person’s socioeconomic situation, an aspect that impacts the children’s weight and height.
This preliminary selection of independent variables is made based on evidence present in the literature to rapidly reduce the universe of options without the need to use memory resources evaluating the p-value in the 85 attributes the health file contains.
Some of the selected independent variables present anomalies, such as atypical data, null data, and non-normalized values. A pre-processing is carried out as indicated in 34 of the dependent and independent variables to correct these anomalies. The activities are data filtering to eliminate outliers, eliminate or replace null data, and normalization of values.
The independent variables are transformed because some qualitative variables are present. A machine learning model cannot be trained with qualitative variables; these must be transformed into quantitative ones. For the transformation of variables, the sklearn.compose library was used, which allows the conversion of a qualitative to a quantitative variable. The qualitative sex variable is an example; two values for this variable, “M” and “F” represent Male or Female, respectively. The result of processing this variable with the ColumnTransformer object is shown in Table 4. It can be seen that now the sex attribute is being represented by two columns of binary values.
Finally, the result of the transformation is the representation of 3 qualitative variables: region, sex, and ethnic group in 47 columns of binary data. Considering that the health file has more than two million records, the cost of processing the model is increased by having 47 columns as input parameters. Two processes must be applied to reduce that cost, the elimination of variables that are not statistically significant and the reduction through the use of Linear Discriminant Analysis (LDA). LDA is a supervised learning technique that generates a linear projection that maximizes the separation of classes 35.
With a data set composed of 989,687 rows by two columns, resulting from the execution of the activities mentioned above, the data is divided into two groups, 80% of the data for training the model and 20% for testing it. In this activity, we used the train_test_split object of the Python sklearn.model_selection library.
Experiments were carried out with different machine learning; the results are shown in Table 5. Some models are required to set various parameters in the training phase called hyperparameters to select the best value to the parameter was used library GridSerachCV with a value of three in cross-validation.
Table 5 Evaluation of the regression models
| Model | MSE | 𝑹2 |
|---|---|---|
| Multiple lineal regresion. | 0,93 | 0,91 |
| Polinomial Regresión. | 0,69 | 0,93 |
| Decisión trees (Regresion) | 0,68 | 0,93 |
| Random Forest (Regresion) | 0,68 | 0,93 |
| Laso | 0,98 | 0,90 |
| Gradient Boosting | 0,68 | 0,93 |
| Average | 9,98 | -0.00 |
| Monte Carlo Simulation | 19.73 | -0,97 |
Source: own elaboration
In order to evaluate the model, the parameter mean square error (MSE) is used, which represents the mean of the squared differences between predicted and actual values. This yields a relative metric in which the smaller the value, the better the fit of the model. The Coefficient of Determination R2 is also used; it is a relative metric in which the higher the value, the better the fit of the model. In essence, this metric represents how much of the variance between predicted and actual label values the model is able to explain. On the other hand, also were implemented the traditional methods used to solve this kind of problem, such as average and monte carlo simulation; however, its results weren’t satisfactory.
The multivariate linear regression model was implemented, and the weight and height of 66,086 children were calculated to affect a total of 132,172 records.
4.4.2 Dimension of coherence
The procedure to address the quality problem in the coherence dimension from the perspective of machine learning consists of three activities: generate a set of rules for identifying inconsistent data, create a data set for training the model from these rules, and implement a classification algorithm.
Once the different results of the exploration of the data and its descriptive analysis were validated with the domain expert, a set of rules was created in Table 6, with their respective labels for their representation in the training and test sets.
It is important to note that a single record can contain one or all the classifiers; in other words, a record can violate more than one of the established rules. Some algorithms can perform multiple classifications. However, preliminary classification with machine learning does not show good results in precision and accuracy; therefore, to obtain a better response in the data category, this problem is addressed with four approaches independently. The evaluation of the service approach, using SDP, SFEP, and OK classifiers, the region evaluation using the RDP and OK classifiers, the review of the city with the MDP and OK classifiers, and the document evaluation using the DOCDUP and OK classifiers.
For the training and test data set generation, 80% of the records were assigned for training and 20% for testing. The characteristics of the sets are shown in Table 7.
Table 6 Rules for the generation of the training and test set
| Label | Description |
|---|---|
| SDP | Duplicate service in the same period for the same beneficiary |
| SFEP | Service not allowed provided in the same period for the same beneficiary. |
| RDP | Beneficiary served in two regions in the same period. |
| MDP | Beneficiary served in two cities at the same time. |
| DOCDUP | Children with equal identification number but with other different attributes. |
| OK | Record OK. |
Source: own elaboration
Table 7 Characteristics of the training and test set for the models used to improve quality in the coherence dimension.
| Feature | Services Approach | Region Approach | City Approach | Document Approach |
|---|---|---|---|---|
| Data Number | 140.518 | 140.518 | 140.518 | 140.518 |
| Classifier SPD | 19.067 | 0 | 0 | 0 |
| Classifier SFEP | 10.313 | 0 | 0 | 0 |
| Classifier RDP | 0 | 2.856 | 0 | 0 |
| Classifier MDP | 0 | 0 | 6.569 | 0 |
| Classifier DOCDUP | 0 | 0 | 0 | 143 |
| Classifier OK | 111.138 | 137.662 | 133.949 | 140.375 |
Source: own elaboration
The following characteristics of each of the models were evaluated: accuracy, precision, sensitivity, confusion matrix, and 5-fold; this last is the cross-validation technique in order to guarantee the independence of the partitions that are made for training and test sets. Table 8 shows the comparison of the results obtained by each experimented model in the service evaluation approach and Figure 4, their respective confusion matrix. Implementing the model that uses the random forest technique is carried out for all the approaches, considering that it was the best model to classify inconsistent data. Table 9 shows the results of the implementation.
An example of an inconsistent record identified by the model is shown in Table 10. The model managed to identify that the two records correspond to the same object in the real world or, in other words, are the same person. Despite the differences in the ID of the beneficiary and the syntactic in the writing of the name, the two records have other similar attributes such as age, sex, city, and parents’ names that allow us to infer that they are the same person. In addition, this beneficiary receives the program services by two different service units in the same periods, which violates the business rules.
Table 8 Evaluation of the service approach classification models
| Model | Accuracy | precision | sensitivity | 5-Fold | confusion matrix |
|---|---|---|---|---|---|
| Neuronal Network | 1 | 0.20 | 0.82 | 86,99 | 5-A |
| Decision Trees | 0.86 | 0.70 | 0.54 | 0.85 | 5-B |
| Random Forest | 0.86 | 0.70 | 0.54 | 0.86 | 5-C |
Source: own elaboration
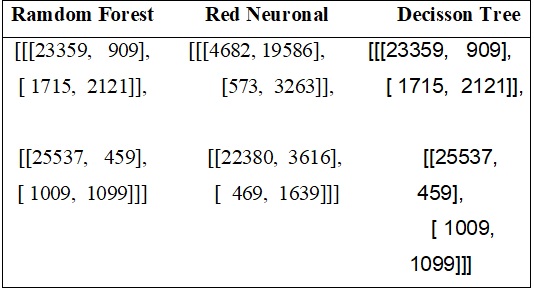
Table 9 Results of the implementation of the Random Forest model for the coherence dimension
| IT | Classifier | Services Approach | Region Approach | City Approach | Document Approach |
|---|---|---|---|---|---|
| 0 | OK | 380.555 | 462.990 | 450.039 | 471.647 |
| 1 | SDP | 59.508 | 0 | 0 | 0 |
| 2 | SFEP | 32.182 | 0 | 0 | 0 |
| 3 | RDP | 0 | 9255 | 0 | 0 |
| 4 | MDP | 0 | 0 | 22.206 | 0 |
| 5 | DOCDUP | 0 | 0 | 0 | 598 |
Source: own elaboration
Table 10 Inconsistent record
| Child’s Id | Names | Service unit | Affiliation date | Disaffiliation date | City | Sex | Age |
|---|---|---|---|---|---|---|---|
| 165462 | Jhoanna NaN Cordoba Palomeque | Tiempo de Dios 2 | 2018-02-01 | 2018-10-31 | Bogotá | F | 3 |
| 175676 | Yhoanna NaN Cordoba Palomeque | San Cristobal 1 | 2018-05-08 | 2018-07-14 | Bogotá | F | 3 |
Source: own elaboration
4.5 Discussion
Most people think that the data quality depends only on its accuracy, and they do not consider analyzing other dimensions to achieve a higher quality in the data, as stated 36. However, the importance of data quality in recent years must be recognized, especially due to the increasing speed with which the data is generated, the variety in the structure and types of data that exist, and the immense volumes of data that must be managed today. For this reason, data quality is a complex issue that is approached from different perspectives and sciences that try to develop models, methodologies and create norms that standardize and improve the quality of information. Among the initiatives that have emerged to deal with data, quality is the one set out in 37. The author states that the best practices for data quality include implementing an API architecture that allows efficient integration of different information systems, the information must be verified at the point of entry, add value to the data through the use of visualization tools, implement a data governance strategy and previous situations that may impact the quality of the data.
In addition, the trends for data quality affirm 5 that by the year 2020, there were validations as a service, through access to reference databases that allow to increase the capacities of companies, the implementation of machine learning for the detection of fraudulent information or transactions. Delving into the machine learning initiatives that are of the main interest of this research, 38 makes a machine learning application for data cleaning by implementing unsupervised algorithms and tries to show that cleaning the data does not always have to be a tedious job.
The problem aborded with this job has to do with classifying hundreds of articles in HTML and PDF formats according to the quality of their text. In the review of one of the articles, text that does not represent words is identified due to the suppression of spaces, the omission of some characters, or the addition of inappropriate characters to form the word. These errors make the text lose semantic quality and make the document lose meaning. The experiment presented in this work uses algorithms in Python for the content and identification of the words, which is part of the pre-processing of the information; later, the unsupervised machine learning algorithm K-means is used to classify the articles. According to the number of identified and unidentified words, this algorithm classifies the papers. Articles with a greater number of unknown words will be grouped into a cluster, and these correspond to low-quality articles due to their poor interpretability.
The work presented in 39 uses clustering and classification techniques to identify quality problems such as duplicate data, null data, and erroneous entries, among others. On the other hand, the first contribution made by the work in 14 presents an initiative to treat data quality in the object identification activity by developing a framework that identifies and corrects errors in the data. The framework identifies and joins related data and then classifies it using a data cleansing process. The second contribution of this work is to develop an algorithm that generates structural and descriptive metadata as the data type. There are also public initiatives that address the problem of data quality, such as the recent work carried out by the unit of data scientists of the Colombian government’s National Planning Department. They make the Leila library in Python language 40, whose main objective is to be a tool that facilitates the verification of database content and quality metrics so that users can decide if their databases need to be modified to be used in projects.
As evidence, most of the work described here is intended to solve quality problems using machine learning unsupervised techniques, a different approach from the one used in this work that uses supervised techniques to improve the quality of data in the dimension of completeness and coherence. In order to reproduce this work the code could be cloned from this google drive repository: https://drive.google.com/drive/folders/19zNuIjAf7CRobIPE7aAH1xcU6AcoFil5?usp=sharing .
5. Conclusions
The quality of the information is a fundamental factor in obtaining good results from the different analyses on a set of data. For this reason, the cleaning processes must be carried out as part of the pre-processing of the data. However, due to its large volumes, they are impossible to perform manually as stated 24. With this work, it is concluded that it is possible to minimize the efforts of this activity by using supervised learning techniques.
Machine learning technics are a powerful tool to face quality information problems; due to the training of supervised learning models, the algorithm can infer many rules that the domain expert didn’t state. This is one reason for don’t apply those rules directly to the dataset. In many cases of data quality problems is too difficult to identify all rules that can apply to a particular case of quality information; also while there are many rules, more complex is the code to implement and its maintenance.
This work also let to demonstrates that supervised learning is very useful in the field of object identification, is a common use the object identification when there are many sources or databases but here was possible to identify the same object in the same database using their attributes of space and time, an example of this was the identification of the same child that according to the registers was being attended in a different place but in the same time.
On the other hand, with the results of this research, it is evident that with supervised learning techniques, data cleaning processes can be implemented in different dimensions of the quality of the information, for this case, in the dimensions of completeness and coherence.
Although the models selected in this work had a good result in the evaluation phase, they could be improved by using more data and adjusting some hyperparameters. This is additional work for the future.
In the future, in order to continue with the research, it is proposed to use machine learning techniques in other dimensions of information quality, in particular at the schema level in relational databases, to validate the integrity of the tables due to the lack of restrictions, foreign keys, and attribute redundancy, among others.

