


 English (pdf)
 Article in xml format
 Article references
 Send this article by e-mail
 Cited by SciELO
  Cited by Google
  Similars in
SciELO
Similars in
SciELO  Similars in Google
 Permalink
Introduction
This work presents the design and implementation of a monitoring device that has the capability of acquiring flight data from an aircraft. The initial prototype acquires data on pressure, temperature, altitude, speed, positioning (GPS), acceleration (x,y,z), and orientation (x,y,z) of a model aircraft (RPAS) to emulate some of the sensors that a commercial aviation aircraft has, since there were not enough resources to access a real one. In general, the system acquires and sends data through wireless communication to a web page implemented using IoT (Internet of Things) technology.
The use of this system is projected for future use in the total monitoring of a commercial flight to support a pilot in the shortest possible time by knowing all the behavior of the aircraft. Additionally, the methodology used for the development of the project is shown, along with the results obtained, and some conclusions.
Background
Web platform for a distributed drone telemetry system 1: In the development of UAV (Unmanned Aerial Vehicle) systems, it is important to know the status of the aircraft variables during the design, qualification, and operation phases. For this reason, the telemetry subsystem of a UAV system must distribute the information of the aircraft variables so that they can be monitored by different actors and at diverse levels of decision-making. This is where the need arises to design a telemetry subsystem that can disseminate the information of the aircraft variables to different geographically spaced points, with a delay time of less than 1,200 ms and that can be accessed from any remote site with an Internet connection. The main challenge they faced in this project was the implementation of the solution using tools that would allow delivery from an embedded GUI platform that provides flexibility for its operation.
The distributed telemetry subsystem for an UAV system consists of 30 primary and 48 secondary variables. All variables must be monitored in real-time during the design, qualification, and operation phases of the system with a maximum allowable delay of 1,200 ms between the air segment and the engineering building or control office.
In the work developed by 2 it is sought to locate and monitor aircraft through different geolocation systems, the authors also develop a feasibility study briefly explaining how some types of radars used in Colombian aviation work, their deficit in communications between air traffic control and pilots. The product on which they begin to work is the location system of each aircraft, something vital that comes from the beginning of commercial aviation, thus, the need arose to locate the aircraft and therefore create an instrument known as RADAR, which is a system that uses electromagnetic waves to measure distances, altitudes, directions, among others.
Methodology
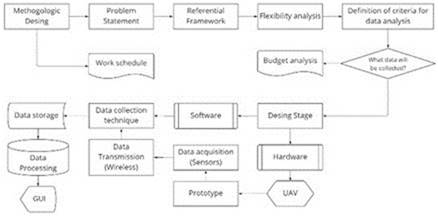
The methodology used in this project was divided into 3 main parts, in the first one, the whole research was approached, then having an idea of what was wanted, we started to design to make a satisfactory implementation at the end. The complete methodological design can be seen in Figure 1.
Investigation Stage
Type Of Research: For the development of the project, applied research was proposed, since what was specifically sought was to provide a solution to a specific problem: Real-time monitoring of aircraft systems through a wireless communication protocol. Technologies and operating principles: Technologies that had already worked in this type of project were evaluated and their basic operating principles were investigated to determine which was the most appropriate for this project. Data processing and analysis: In this section, the data to be acquired for processing and analysis were determined, such as speed, altitude, pressure, and location, among others; in addition, some data collection and processing techniques were observed.
Design Stage
Software: The design of a GUI for the visualization of the aircraft data was conducted, initially it is proposed to acquire data from an UAV prototype to observe its behavior, this data is sent to a web page to make its visualization possible from any internet-enabled device. Hardware: This section consists of two implementations, the first one is the unmanned aerial vehicle, since it is where the acquisition of flight data is performed, as it is more complex to do it in a real aircraft. Subsequently, the main device (hardware) of the project was designed, so that it can perform such acquisition in real-time of the UAV data and send them directly to a web page.
Results
Investigation
ACARS System Overview: ACARS (Aircraft Communication Addressing and Reporting System), a data link transmission system in the VHF (129 MHz - 137 MHz) frequency range, is a system that provides a means by which airlines can exchange data and communicate with aircraft in the fleet in the same way as it is possible to exchange data over a terrestrial digital network 3. The main feature of this system is its ability to provide real-time data on the ground related to aircraft performance and then use this data to plan maintenance activities.
This data does not necessarily always travel over VHF but also provides for the use of HF and SATCOM sub-networks. The messages are known as uplinks and downlinks, facilitating two-way communication for applications such as ATIS (Automatic Terminal Information Service), clearances, weather/turbulence reports, flight delays, engine data reports, position, and passenger load, and fuel onboard is also included 3.
Satellite Internet Overview: When talking about satellite communication, two concepts are usually kept in mind, uplinks (ground - satellite) and downlinks (satellite - ground), the objective of this communication is to allow main stations (transmitter and receiver) to communicate with each other using satellites as repeater stations.4)
Satellite Internet is a method of connecting to the Internet through electromagnetic waves using a satellite and a ground station as the main means of communication. Over the years it has been evolving and growing in the industry in general, since its coverage allows connectivity in remote areas. It should be noted that its main disadvantage is usually a low latency, but these systems continue to improve with time and, in the future, the normal internet as it is known today will pass into the background, which is why this is a suitable candidate for this project. 5
Satellite communication makes use of several frequency bands, such as VHF, UHF, among others, but in the case of satellite internet use, a much larger band is required to offer a better bandwidth, this is where the C, X and Ku bands come in, where each of them has a different application: Satellite internet reaches speeds from 25 Mbps up to 100 Mbps and above. 6
The current project proposes a real-time monitoring system with the use of satellite internet since the communications of the previous system depend on the curvature of the earth and even if these aircraft fly remarkably high in some parts of the world it is not possible to fly regularly as it is in the north of Canada. In addition to this, the RTAMS system does not propose to perform the same functions of an ACARS and at no time replace it, but it is a system capable of offering a complement when acquiring some data that the ACARS system does not usually obtain, as it is a system focused mainly on preventive maintenance, to offer the pilot real-time support in case of emergencies or breakdowns in the aircraft.
For the development of the project, it is not impossible to implement it in a real aircraft, for this reason, it is proposed the use of a scale prototype (aero model) and additionally, a wireless communication protocol is selected to communicate the aero model with a ground station and thus simulate a satellite communication to see what errors could occur.
The following is a description of some of the wireless communication protocols that were used to assess the communication with the base station in the scale model.
Sigfox
It is an IoT network that offers connectivity at low consumption and cost, providing M2M (Machine to Machine) solutions. This technology depends on the operators in charge in each country, in the case of Colombia it is conducted by the WND group (Wireless Network Developments) and has created a long-range and low-speed network to allow communication between connected devices without the need to be linked to mobile network coverage. Its operation depends on a different network that works in 868 MHz, which means that its coverage is limited to areas where there are SIGFOX antennas, generating the need to install repeater equipment if more coverage is required. It also has a web interface that allows to register the equipment since they work by a unique identifier instead of a sim card 7. For this case, the main limitation is not only the coverage, but also the number of packets that can be sent to the network per day, since it only allows sending 140 packets with a size of 12 bytes each and has a low transmission speed, therefore the use of this protocol is discarded.
Lora
(Long Range), this technology allows connected devices to exchange long-distance data packets at low speed and with low power consumption. It works as a modulation technology to reduce costs and energy consumption since the battery life can reach 3 or 5 years depending on the case. One of the advantages of this protocol is that its signal can pass through buildings easily to reach remote corners such as subways or basements 8. Like SIGFOX it is also discarded since its implementation in real-time applications is limited by the number of packets that can be sent.
LTE/4G:
It is based on wireless transmission of broadband data that is used for access to mobile telephony or portable internet devices. However, its coverage is associated with the telephone operator, implementation and maintenance costs are generally high and it is high energy consumption, making it only be considered for sending information from the base station to the website. 9
Zigbee And Xbee
Zigbee is a wireless technology that operates in the free ISM (Industrial, Scientific & Medical) bands of 2.4 GHz, it reaches transmission speeds of 250 Kbps and a range of 10 to 75 meters. This technology is characterized by operating in high-density networks thus helping the reliability of communication since the more nodes there are the more alternate routes there are to ensure that a package reaches its destination. 10 The modules developed by XBee are integrated solutions that provide a means of wireless communication for the interconnection between devices using the IEEE 802.15.4 protocol, this allows the creation of point-to-point and multipoint networks. The XBee are designed for applications that require high data traffic and reduced latency, these manage to increase their range depending on the antenna that is attached to them. 11
Table 1 Comparative table of wireless communication technologies.
| SIGFOX | LORA | 4G | ZIGBEE | |
|---|---|---|---|---|
| Frequency | 868 MHz | 902 - 928 MHz | 1,700 - 2,600 MHz | 850 - 960 MHz |
| Coverage | Medium | Medium | High | Medium |
| Transfer limit | Yes | Yes | Not | Not |
| Power consumption | Low | Low | High | Medium |
| Advantages | Optimal application in devices that transmit infrequently. Low power consumption. | Small environment applications. Bidirectional. Correct operation when in motion. Power consumption. | Transmission speed. Coverage in most of Colombia. | Ideal for point-to-point and multipoint connections. Economical. Good mobility. |
| Disadvantages | Coverage is very dependent on where antennas are located. Low mobility. Data transfer limits. | High latency. Coverage. Data transfer limit. | High-energy consumption. Costs. While coverage is an advantage, in some cases it is also a disadvantage. | Transmission range depends on the antenna. |
The following Table 1 shows a comparison of the technologies that were considered for the wireless communication part. In the end, the selected technology was Zigbee with the support of XBee modules to obtain a greater transmission range, this was selected because it had a superior performance and was not limited by the number of packets that could be transmitted per day, and its implementation has a relatively low cost.
Design
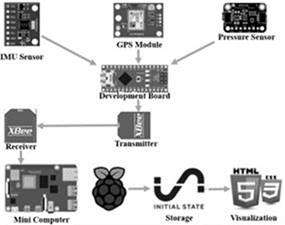
Prototype Design: Figure 2 shows the design of the prototype. A microcontroller is responsible for acquiring the data sent by the pressure sensors, GPS, and IMU (Inertial Sensor), in turn, this is responsible for sending the data via wireless communication with the XBee modules. (12) Once the data reaches the XBee receiver, this is responsible for viewing them on a desktop application designed with Python and from there the data will be sent to the website.
Sensors and Data Acquisition Modules: The sensors and modules of the final device are listed below. The research carried out in 12 and 13) was taken as a design basis.
Implementation
Figure 2 shows the final design of the prototype with the selected sensors and modules. The results obtained from the system will be described below.
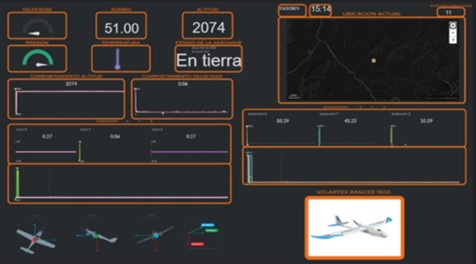
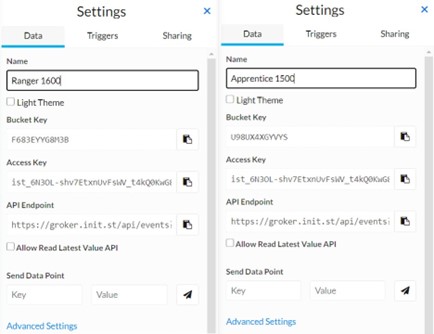
GUI and web page: A GUI programmed with Python to receive the data was designed and implemented, which can be seen in Figure 3. This GUI will be installed on the Raspberry Pi 4B and from there the data will be sent to the IoT initial state platform, for later develop a web page where the data will be displayed. This can be seen in Figure 4.
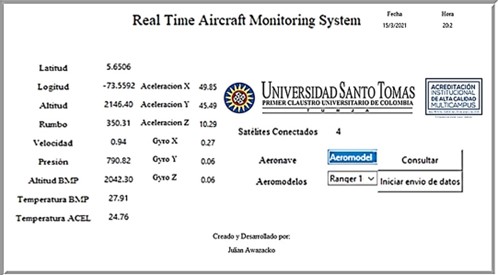
In the implemented GUI the data acquisition is done through serial communication, which is why the Pyserial library is used, the program asks for the value immediately after the letter that is configured in the data frame.
To demonstrate that the system can track more than one aircraft and can visualize it on a web page, a section was created within the implemented GUI that allows the user to allow the user to choose which bucket the data will go to; the buckets were created in the Initial State platform (Figure 5).
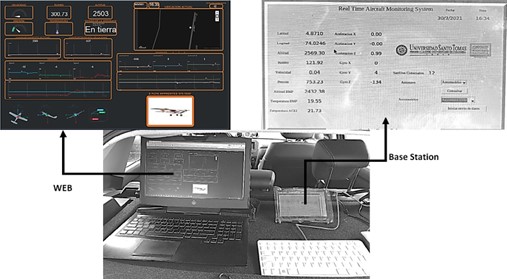
Final Prototype Description: The following is a general description of the implemented system using a block diagram (Figure 6).
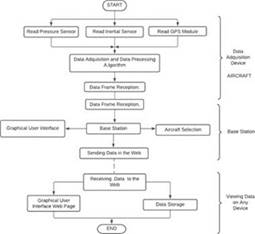
As shown in Figure 6, the general system is divided into three main parts, the first one is where the flight data acquisition is performed, then through the XBee communication it will be sent to the base station where the data will be displayed and from there it will be forwarded to the web page so that later the data can be accessed from any device anywhere that has an internet connection.
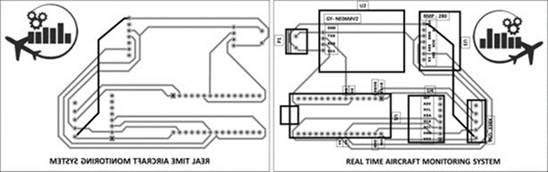
PCB Design and Implementation: the PCB of Figure 7 uses the two layers, this to avoid a crossover between the power pin of the pressure sensor and the power pin of the XBee module, in addition to this a logo with the project name and the author was placed.
The result of the system already installed in the aircraft can be seen in Figure 8. In addition to this system a 500mA fuse was added so that in case there is a shock or a bad connection in the model airplane and a short occurs, it does not burn the components.
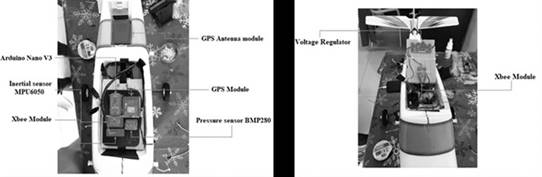
As shown in Figure 8, the upper part of the PCB with the sensors and the development plate is already in the system, and at the bottom of the system the voltage regulator is placed to feed everyone and the module Xbee since in this position the antenna of the Xbee module can be placed in a better way.
In the lower part of the model plane is the battery that will feed the data acquisition system and the battery that will feed the entire model of model plane; The antenna and the GPS antenna cables that were placed in the system are also located. Results and Data Analysis: Complying with the Colombian aeronautical regulations, it is necessary to use a model airstrip to perform the system tests. RAC 91 general flight and operation rules, Appendix 13 (Operation of unmanned aircraft systems UAS) Circular 328 AN/190 ICAO from August 05, 2019 (See Legal Framework). The document also talks about the limitations of the aircraft that are in this category, within which are highlighted:
Weight no more than 25 Kg, Maximum speed of 80Km/h.
The aircraft must have a line-of-sight range with a maximum operating radius of 500 horizontal meters during all phases of flight.
The operation cannot be performed over the public, outdoor gatherings of people, agglomerations of buildings, cities, or other populated areas.
Operation must occur during daylight hours under VFR rules and VMC conditions.
Flight altitude cannot exceed 123 meters AGL (with respect to the ground).
The flight must be performed within class G airspace, i.e., uncontrolled.
The following are the results obtained from the system in the tests performed on March 30, 2021, at the delta 02 model airstrip located in the city of Chia Cundinamarca.
Once the aircraft is ready to take off, the system starts to track the aircraft’s flight path. Figure 9 shows how the base station starts the flight data acquisition; in this case, it must be considered that the XBee receiving antenna is not 100% in line of sight, because there are obstacles such as the roof of the vehicle and the parking lot where it was located. Despite this, the system performed all the acquisitions correctly.
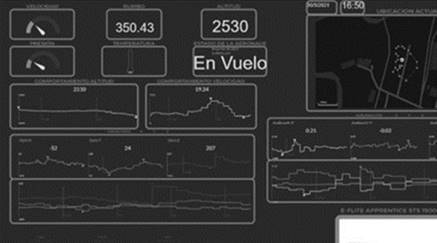
Now, once the data arrives at the base station, the system is instructed to start sending the data to the web page https://www.monitoringsystem.online/es/apprentice.php, this with the intention that they can be viewed on any device with an internet connection, for practical purposes, a laptop with internet connectivity was placed next to the base station to compare the data that were in the station and on the web. Figure 10 shows the data obtained from the system at that moment the model aircraft was ready to take off, at about 11:35 am (16:35 Zulu). On the left of the figure, the route made by the aircraft from the hangar to the runway is observed, it is also verified that the current state of the runway and has an orientation of 300 degrees, the altitude at which the aircraft took off was 2,503 meters.
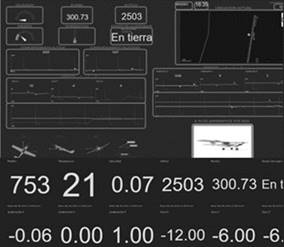
It is seen that the temperature was 21 degrees and pressure 753 hPa (Hectopascals), these data are compared with a meteorology platform called meteocast (https://es.meteocast.net/) to know how much they vary, and it is observed that the pressure and temperature are within the expected ranges.
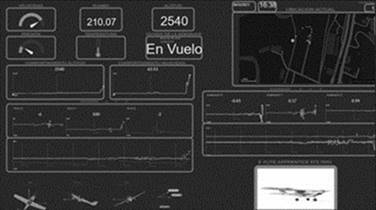
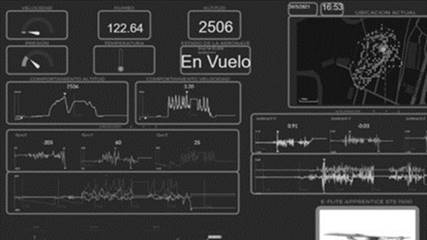
Figure 11 shows the ascent phase of the model aircraft at a speed of 63 km/h, here it can be verified that the data from the inertial sensor are being acquired correctly, since it is observed that the Y-axis turn (pitch) is at 100 degrees, this indicates a pronounced ascent of the model aircraft.
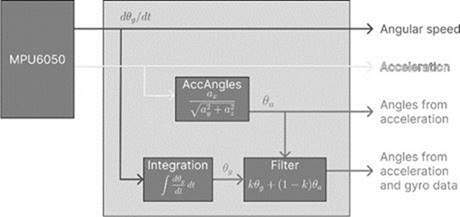
In the technical support document of the MPU_LIGHT library 20 the author explains that the data in dark grey and light grey color (Figure 13) belong to the angular velocity and linear acceleration respectively for the 3 axes. These data are obtained directly from the MPU 6050 and what the library does is operate the data as shown in Figure 12, to obtain the values of the angles from the acceleration and the value of the angles from the fusion of the acceleration with the gyroscope data. The last obtained value of the angles depends on the mathematical calculation of the integral of the angular velocity with respect to time as shown in Figure 12. This calculation, in our case, is due to the sensor update rate corresponding to 0.9 microseconds combined with the execution time of the sequential algorithm structure corresponding to both the library used MPU_LIGHT 20) and the algorithm developed in this work for the acquisition of data from all sensors on the Arduino. It generates an error in the calculation of the angles due to the integration time between one measurement and the next. The error is more noticeable when the aircraft performs sudden or fast movements and better results are obtained when the movements are slow or smooth. To solve this problem, the acquisition of an INS sensor is recommended, which has a low update time and directly provides the value of the angles.
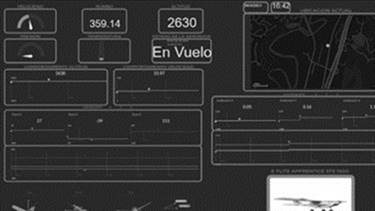
The cruise phase is when the aircraft reaches a constant flight altitude, in the case of model airplanes it is a little difficult to maintain it because there are variables such as the wind that can raise or lower the aircraft abruptly because it is lightweight. For this case, Figure 13 shows the data obtained at the time of reaching the maximum altitude, which was 2,630 meters (127 meters with respect to the ground). It can also be seen that the speed at that moment was 33 km / h, half of what was obtained during the ascent and making a turn of 27 degrees (Gyro X).
Figure 14 shows the data at the moment of descent, here it is highlighted that the aircraft descends with the nose upwards and not as it would normally be thought with the nose downwards, that is why the Gyro in Y is of a positive value (24 degrees), a reduction of speed and altitude can also be appreciated, the Gyro X data indicates that the aircraft is doing a roll, either to the left or to the right and the Gyro in Z indicates the yaw.
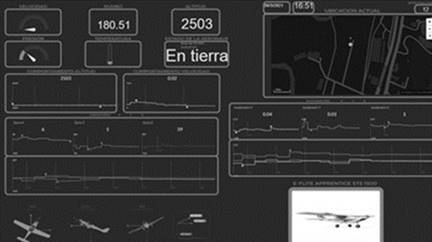
In Figure 15 shows the data when the aircraft was landing, from here you can calculate the total flight time of the aircraft which is known as the approximate takeoff time 11:35 am and landing time 11:51 am, a total of 16 minutes of flight time a normal time for a model aircraft. The data for the entire flight are presented below (Figure 16) and the maximum data achieved for each of the variables obtained are highlighted.
From Table 2, a more generalized analysis can be made since in the case of acceleration values of up to 2G are observed, these maximum values were obtained when the aircraft made quite abrupt movements and had to perform a recovery, in other words, when it was about to crash. It can also be verified in a very simple way that the data of the Gyro in Z was correct since these did not exceed 360º, the value was negative when the aircraft rotated on the z-axis counterclockwise, that is, if there was a value of -360 degrees it meant that the aircraft had made a complete left turn on the z-axis, the extreme values of the gyro in Y and X were also obtained at the times when it was necessary to recover the aircraft.
| Variable | Minimum | Maximum |
|---|---|---|
| Speed | 0 Km/h | 76 Km/h |
| Course | 0º | 360º |
| Altitude | 2503 m | 2630 m |
| Pressure | 742 hPa | 753 hPa |
| Temperature | 19 ºC | 21 ºC |
| Connected satellites | 0 | 12 |
| X-turn | -205º | 82 |
| Y-turn | -92º | 185 |
| Z-turn | -142º | 359 |
| X-acceleration | -1.88 G | 2.1 G |
| Y-acceleration | -0.8 G | 0.59 G |
| Z-acceleration | -1.96 G | 2.04 G |
Source: Authors
Conclusions
The system developed in this work shows how we can make an analysis of the flight data of an aircraft and thus determine the current situation in which this is. This can improve the analysis because it is possible to get most of the flight data of the aircraft such as fuel on board, engine pressure, hydraulic pressure, and other data that can be obtained.
The Real-Time Aircraft Monitoring System prototype was developed and implemented in accordance with the objectives established in the project, the use of GPS modules and sensors used was easily accessible and presented a low acquisition cost, it also demonstrates the ability of the system to offer the user the ability to achieve an analysis of all data obtained during all moments of the flight.
The development of the Real-Time Aircraft Monitoring System prototype shows the viability of the project to serve as a tool to improve air safety in case of in-flight emergencies, allowing the visualization of data in real-time to a specialized mechanic so that he can offer more timely support to the pilot.
When there are a variety of sensors, it is essential to check each parameter so that there are no problems when joining all the data acquisition in one, i.e., it is necessary to keep in mind the data acquisition times of each sensor, because if this value is not considered, the data frames may not be sent completely. To mitigate this problem, the implementation of a switch was made so that the data would be sent as they were acquired and not sending them all at the same time as initially planned.
The system proposed in this degree project can evolve in such a way that other variables to be monitored are included.
The quality and accuracy of the data obtained depend directly on the characteristics of the sensor that is making its acquisition, the use of more precise sensors will improve the results obtained.

