


 English (pdf)
 Article in xml format
 Article references
 Send this article by e-mail
 Cited by SciELO
  Cited by Google
  Similars in
SciELO
Similars in
SciELO  Similars in Google
 Permalink
INTRODUCTION
The dwarf dory deep-sea fish (Zenion hololepis, Goode and Bean, 1896) is a marine bathydemersal species, native of seamounts, found in depths from 180 to 650 m without commercial importance, but is widely distributed around the world (YANG et al., 1996; FROESE & SAMPANG, 2004). This species is extensively distributed in the Western Indian Ocean from Tanzania, off Delagoa Bay to Mozambique, the Western Central Pacific (HEEMSTRA, 1999), the Southeast Pacific (PARIN et al., 1997), and the Western Atlantic from Antilles to Venezuela (CLARO, 1994), the Northwest Atlantic in Canada (SCOTT & SCOTT, 1988), South China Sea (HEEMSTRA, 1999) and the Portuguese continental waters (MARTINS et al., 2012). It is well known that deep-sea ecosystems and their fish resources are especially vulnerable to over-exploitation due to the life-history characteristics of deep-sea species that include extreme longevity, slow growth rate, late maturity and low fecundity (KOSLOW et al., 2000; MORATO et al., 2006; FOLLESA et al., 2011). Therefore, this deep-sea fish species is very vulnerable, and its habitats need protective measures to limit fishing, based on a precautionary approach (ROBERTS, 2002; DEVINE et al., 2006; HART & PEARSON, 2011). Such measures may include the creation of marine protected areas as a tool for marine conservation and a fisheries management that follow an ecosystem approach to fisheries (EAF) (WORM et al., 2006; FRASER et al., 2009; PARAMO et al., 2009; JACKSON & JACQUET, 2011). Zenion hololepis is reported as one of dominant teleost species with a frequency of occurrence of 57,41 % and is distributed in depths from 230 to 440 m, with higher abundances in 350 m, which makes this species of great ecological importance (PARAMO et al., 2012). Furthermore, previous studies have identified the potential for a new deepcrustacean fishery in the Colombian Caribbean Sea (PARAMO & SAINT-PAUL, 2012; PARAMO, 2015) and Z. hololepis could be susceptible of bycatch of a possible new fishery in the Colombian Caribbean Sea (PARAMO et al., 2012). For this reason, it is necessary to advance in studies of deep-sea ecosystems to assess the ecological risk that can cause, since changes can occur in deep-sea fish assemblages before and after the beginning of a new fishery. The information on deep-sea fish assemblages is scarce in the Colombian Caribbean, where there is not a fishery developed, and can be considered still a pristine environment. In this sense, the objective of this research is to describe for first time the patterns of size structure, morphometric relationships, spatial and bathymetric distribution of the dwarf dory deep-sea fish (Zenion hololepis) in the Colombian Caribbean.
MATERIALS AND METHODS
Samples were collected in the Colombian Caribbean Sea by trawling in depths between 200 and 550 m. Experimental trawl survey was carried out between November and December 2009 (Figure 1). Samples were collected by the commercial shrimp trawler “Tee Claude” using a trawl with a cod-end mesh size of 44.5 mm from knot to knot, on a grid of 87 stations, with at least two hauls per 100 m depth stratum. We were unable to collect samples between Cartagena and the Magdalena River because of irregular depths. The trawl locations were identified using a commercial echosounder FURUNO FCV 1150 with a transducer frequency of 28 kHz.
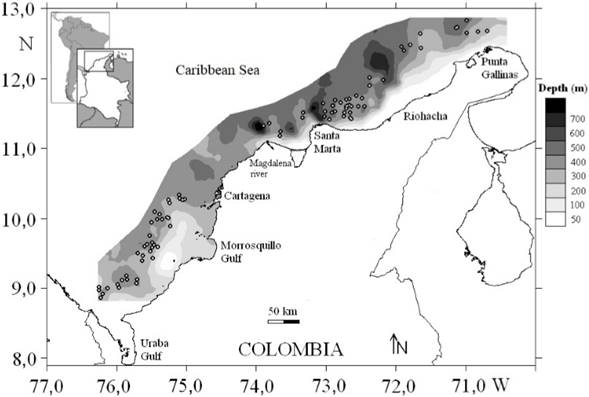
Source: Own elaboration.
Figure 1 Study area in the Colombian Caribbean Sea. Circles indicate the sampled stations.
The total length, sex and number of individuals Z. hololepis from each station were recorded. The total length (TL) was measured to the nearest 0.1 mm. Mann-Whitney U test was used to test for significant differences between sexes, zone and depth strata of total length (GOTELLI & ELLISON, 2004). The frequency data of TL by sex and by zone of Z. hololepis were analyzed as a mixture of probability density functions (PDF), whose modes depend upon a combination of the distances between means, the magnitudes of the variances, the proportion of the individual numbers in each mode and the overall sample size. The quasi-Newton algorithm was used to fit the frequency of data per individual to obtain the means, using the software MIX (Mixture analysis). The statistical method used to fit the mixture distribution to the data is maximum likelihood estimation for grouped data (MACDONALD & PITCHER, 1979).
The length-weight relation was determined by adjusting the potential equation W = aLt b by logarithmic transformation:
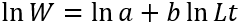
Where W is the total weight in g, TL is the total length in cm, a is the intercept and b is the allometry coefficient. As a measure of fit goodness, the determination coefficient (R2) was used. The confidence interval of 95 % for b was estimated and Student t-test was conducted to determine if the fish presented isometric growth (H0: β = 3, α = 0.05). The morphometric relationships Total length (TL) vs. Standard length (SL), TL vs. Body height (BH), TL vs. Eye diameter (ED) and TL vs. Head length (HL) were performed using least squares fitting to linear equation Y=a+X*b; where a (intercept), b (slope), Y for TL and X for the independent variables (SL, BH, ED and HL). To evaluate differences in linear relationships between the sexes, an analysis of covariance was performed (ANCOVA) (ZAR, 2010).
Geostatistical analyses (CRESSIE, 1993; PETITGAS, 1993; RIVOIRARD et al., 2000) were used to describe the spatial structure of the Z. hololepis distribution. The experimental variogram is defined as the variance of difference between values that are h units apart.
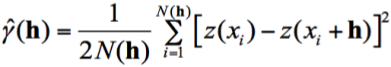
Where ŷ(h) is semivariance, h is a vector of distance and direction, and N(h) is the number of pairs of observations at distance h and given direction, z(xi) is the density of Z. hololepis for the ith data point. The spherical model of variogram was the most appropriate to explain the experimental variograms according to the weighted least-square minimization and the mean squared error (MSE) of residuals criterion (ISAAKS & SRIVASTAVA, 1989; CRESSIE, 1993; PARAMO & ROA, 2003). In order to evaluate the anisotropic processes, experimental directional variograms were calculated (0º, 45º, 90º and 135º). Finally, ordinary point kriging was used to map the spatial distribution, to estimate the mean density, the variance of the mean density and the biomass (ISAAKS & SRIVASTAVA, 1989; PETITGAS & PRAMPART, 1995; RIVOIRARD et al., 2000).
Generalized additive model (GAM) (HASTIE & TIBSHIRANI, 1990) was used to analyze the depth preferences in abundance of Z. hololepis. We used spline (s) smoothing with a Gaussian family to estimate the nonparametric functions. The probability level of the nonlinear contribution of the nonparametric terms was made with the significance value (p) for judging the goodness of fit (BURNHAM & ANDERSON, 2003).
RESULTS
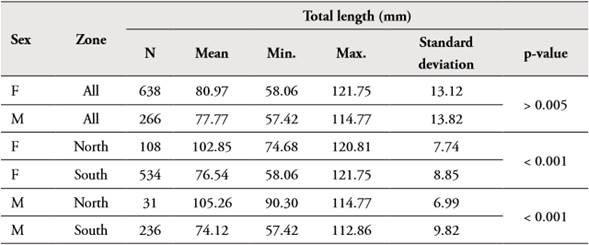
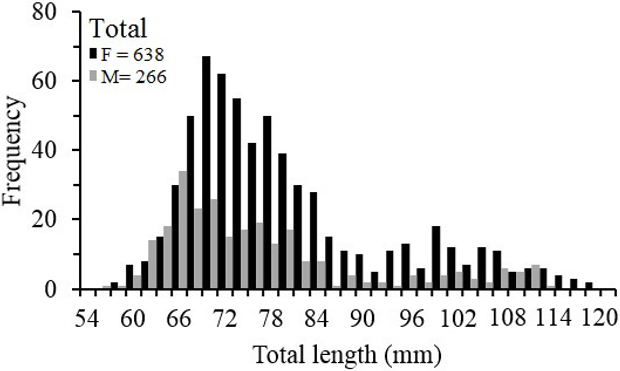
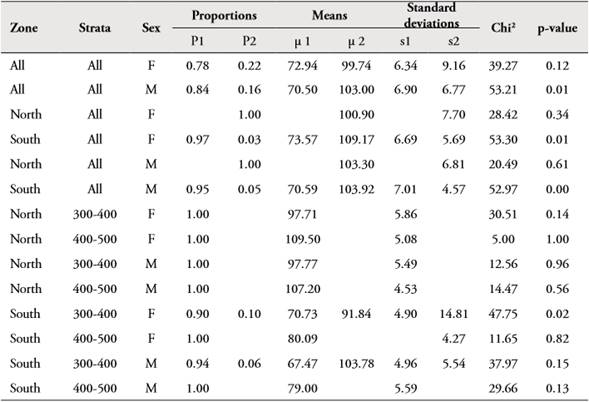
The size of Z. hololepis females ranged between 58.06 and 121.75 mm TL (mean 80.97 mm, ±13.12) and for males between 57.42 and 114.77 mm TL (mean 77.77 mm, ±13.82). Statistically significant differences (p>0.05) between sexes were not found for all study area (Table 1, Figure 2). When the size structure analysis is done with the geographical area statistically significant differences were found (p< 0.001), both females and males, individuals in the north are larger than the south.
Table 1 Descriptive statistics of length frequency distributions of Zenion hololepis of total length (mm) by sex and total, north and south study area.
Source: Own elaboration.
Source: Own elaboration.
Figure 2 Length frequency distributions of Zenion hololepis of total length (mm) by sex.
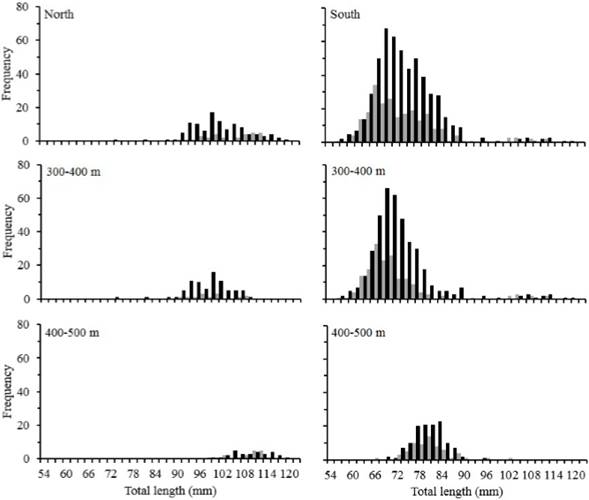
The entire length frequency distribution for all study area of Z. hololepis TL was characterized by two modes for female and male (Table 2). For females, the first mode represented 78 % (mean 72.94 ± 6.34 mm TL) and the second one the 22 % (mean 99.74 ± 9.16 mm TL). For males, the first with 84 % (mean 70.50 ± 6.90 mm TL) and the second represented 16 % (103.00 ± 6.77 mm TL) (Table 2, Figure 1). However, when we carry out the analysis by zone, the length frequency distribution was very different. The size structure of north zone corresponds to second modes of females and males of all study area, and the south zone corresponds to the first modes of all study area (Table 2, Figure 3).
Table 2 Frequency distributions parameters (proportions, means and standard deviations) for each mode of the histograms of total length of Zenion hololepis by sex and total, north and south zone and depth strata.
Source: Own elaboration.
Source: Own elaboration.
Figure 3 Length frequency distributions of Zenion hololepis of total length (mm) by sex, zone north, zone south and depth strata.
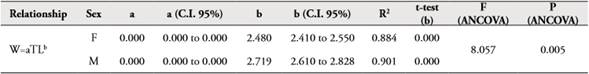
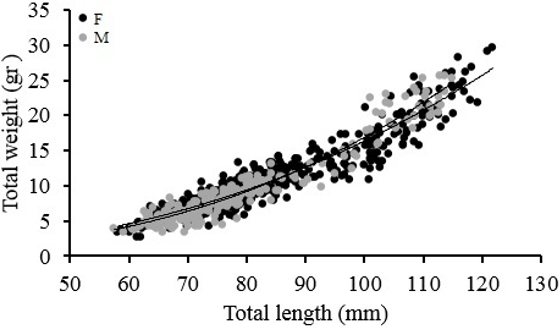
In the north zone the size structure for female and male of Z. hololepis showed an increase in TL associated with depth, with one mode for 300-400 m and 400-500 m strata (Table 2, Figure 3). In the south zone the size structure for female and male showed an increase in TL with depth, with two modes in the 300-400 m strata. However, the two modes in the first strata seem to mix in the second strata (400-500 m) (Table 2, Figure 3). The largest numbers of individuals were found in the south zone, but in both zones the largest numbers were found in the 300-400 m strata (Figure 3). The regression of total weight with total length both for females and males were significant (p<0.001) and weight variability is explained by about 90 % for both sexes (Table 3, Figure 4). In females and males, the growth was negative allometric. ANCOVA showed that there are significant differences between the slopes of females and males in the weight-length relationship (Table 3).
Table 3 Parameters of length-weight relationship in female and male of Zenion hololepis.
Source: Own elaboration.
Source: Own elaboration.
Figure 4 Relationship between TL vs. total weight in female and male of Zenion hololepis.
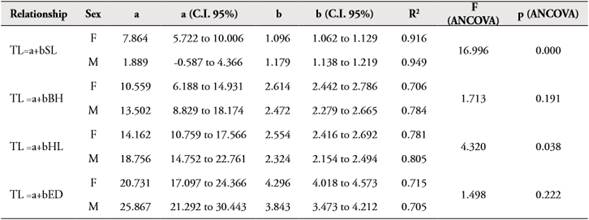
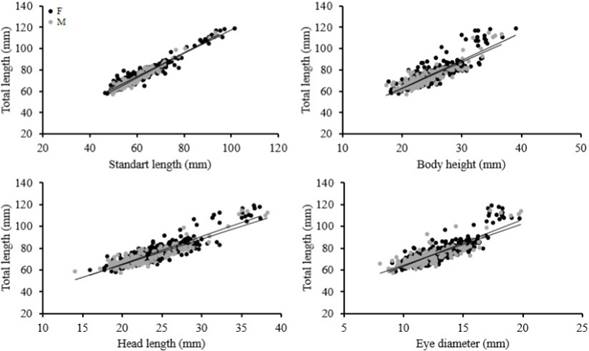
The morphometric relationships between TL vs. SL, BH, ED y HL showed high coefficients of determination (>0.70) (Table 4). ANCOVA showed that there are significant differences between the slopes of females and males in relationships TL vs. SL, HL, but there are not statistically significant differences in linear relationships TL vs. BH, ED (Table 4, Figure 5).
Table 4 Parameters of morphometric relationship in female and male of Zenion hololepis.
Source: Own elaboration.
Source: Own elaboration.
Figure 5 Morphometric relationships in female and male of Zenion hololepis.
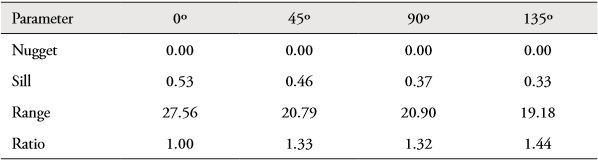
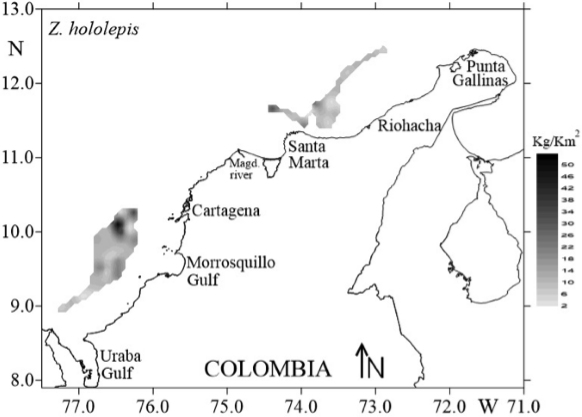
The unidirectional variograms showed similarities in their model of spatial characteristics for Z. hololepis. This absence of geometric anisotropy can be demonstrated with the ratio between the maximum and minimum values of the spatial autocorrelation range in the unidirectional variograms, which was less than 2 (Table 5). This means that the spatial structure of Z. hololepis aggregation has the same size in all directions of spatial autocorrelation. Therefore, the spatial structure of dwarf dory deep-sea fish biomass (kg/km-2) was studied using an experimental isotropic variogram. The fitted spherical variograms showed a non-resolved structure for the sampling design that considered 35.65 % of total variance (nugget as percentage of sill). The autocorrelation range of Z. hololepis was 20.53 km, i.e. the diameter of Z. hololepis aggregation (Figure 6). The higher biomass values of Z. hololepis were distributed in well-defined spatial patches in the northern and south zone of the Colombian Caribbean Sea (Figure 7). The bulk of the biomass was distributed between Cartagena and Morrosquillo Gulf (mean density = 13.37 kg/km2; biomass = 100582.09 kg; CV = 28.67). In the northern zone, this species revealed high abundances between Santa Marta and Riohacha (mean density = 10.52 kg/km2; biomass = 47189.95 kg; CV = 26.01) (Figure 7).
Table 5 Analysis of anisotropy, spherical variogram model fitted to the directional empirical variogram for log (kg/km2 + 1) of Zenion hololepis.
Source: Own elaboration.
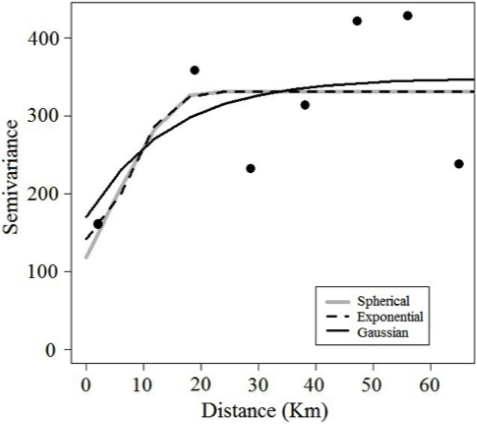
Figure 6 Experimental and fitted variograms (spherical, exponential and Gaussian) for spatial data of Zenion hololepis.
Source: Own elaboration.
Figure 7 Spatial distribution of Zenion hololepis abundances (kg/km2) as the reproduction of a spatially stochastic process by kriging.
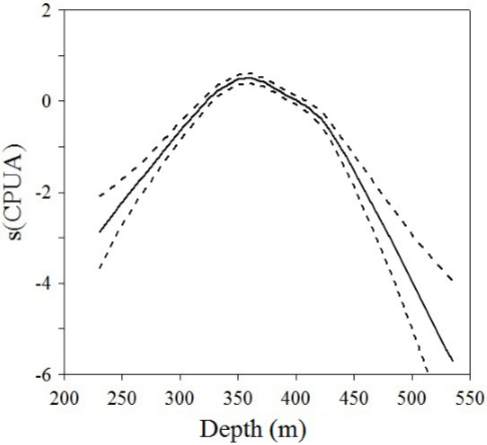
The nonlinear contribution of the nonparametric terms was significant (p<0.001) in explaining the variability of depth preferences in biomass of Z. hololepis. The relationship between the biomass of Z. hololepis and depth shows that this species was distributed between 230 and 443 m, but higher biomass was found between 320 and 370 m (Figure 8).
DISCUSSION
Zenion hololepis fed mainly on benthic copepods and shrimps (BASTOS DE SÃO, 2014) and is part of diet of species that play a fundamental role in the food web (PATOKINA & LITVINOV, 2005). Due to being distributed in areas of deep-sea fishing, Z. hololepis could produce unbalance in the food web, determining changes in the flow of matter and energy into the marine environment (ALLEN et al., 2006). In this sense, it is possible that Z. hololepis play an important role in the structure and functioning of deep-sea marine ecosystems. Zenion hololepis occurs in a wide depth gradient demonstrating the ability to bathymetric migration (PARAMO et al., 2012). Also, for management it is very important to know the size structure, body growth and size at sexual maturity of fish species (HILBORN & WALTERS, 1992), which influences the structure and function of marine ecosystems (HAEDRICH & BARNES, 1997; SHIN et al., 2005). However, sometimes for practical reasons or body damage can be only record data from some body parts (ZETINA et al., 1996). Therefore, mechanisms have been created as the morphometric relationships that are established to calculate sizes and weight. The morphometric relationships presented in this work can be very useful for population studies of the same species in different geographic locations. The size structure, growth type and morphometric relationships are important parameters of life history, as well as of great utility for the management of a new deep-sea fishery in the Colombian Caribbean. This type of information is very useful for the institutions in charge of establishing fishing management strategies in populations that are still considered virgins. In this way, management strategies such as closures, fishing gear controls can be implemented, avoiding resource depletion (MARASCO et al., 2007).
The total length of Z. hololepis was 121.75 mm, coincide with SANCHES (1991) in the Republic of Guiné-Bisáu with a total length of 120 mm of TL, but contrary to ROA-VARÓN et al. (2003) who reported a maximum length of 86.0 mm (TL). In the present study an increase in size of Z. hololepis at deeper strata and a higher proportion of individuals in the strata of 300-400 was found. In general, deep-sea fish perform diurnal vertical migrations between pelagos and benthos (ABRAMOV & LIPSKAYA, 1989), which confirm the migratory habits in the water column to feed (LEAL et al., 2009). Therefore, the distribution of juvenile is associated with bathymetric strata where nepheloid layers with large amount of suspended sediment, which provides a large supply of food for fish larvae and juvenile, interact with continental margins, indicating that these deep strata act as nursery area for deep-sea fish and then performs an ontogenetic migration to deeper waters (FERNÁNDEZ-ARCAYA et al., 2013). In deep-sea fishes the occurrence of larger individuals in deeper waters is well known as the bigger-deeper phenomenon (HAEDRICH & ROVE, 1977; POLLINI et al., 1979), which is explained as an ontogenic migration of individuals to deeper water (STEFANESCU et al., 1992). This a common characteristic of demersal ichthyofaunal where the adults benefit from a reduced metabolic rate and the life expectancy is increased due to the low habitat temperatures at deeper waters (LOVE, 1970, 1980; CUSHING, 1983). This species is usually found in seamounts (FROESE & SAMPANG, 2004) and on the continental shelf and the upper of continental slope (MERIGOT et al., 2007; BASTOS DE SÃO, 2014; GOMES, 2014). The size-weight relationships showed a growth negative allometric which is the first global report of this species.
The northern area of the Colombian Caribbean is influenced by the northeast trade winds, which causes an Ekman transport off the coast flowing in the direction toward the south-west, almost parallel to the coast (PARAMO et al., 2009), the trade winds are responsible for upwelling that increases productivity in the Guajira area (ANDRADE et al., 2003; PARAMO et al., 2003, 2009, 2011). For this reason, the largest aggregations of adults of Z. hololepis were found in the northern part of the Colombian Caribbean, where local oceanography is modulated by seasonal upwelling with high productivity (PARAMO et al., 2009, 2011). However, the juveniles were found in the south zone where oceanographic conditions are associated with high temperature (ROMERO-RODRÍGUEZ et al., 2014). Thus, further research to know the parameters of life cycle of deep-sea fish in the Colombian Caribbean Sea such as growth, reproduction, recruitment, mortality, areas and seasons of spawning and nursery areas is required. A highly precautionary approach on these deep-sea species is necessary due to their vulnerability to exploitation by the characteristics of life history of deep-sea fish species including extreme longevity, slow growth rate, late maturity and low fecundity (KOSLOW et al., 2000; MORATO et al., 2006; FOLLESA et al., 2011).

