


 English (pdf)
 Article in xml format
 Article references
 Send this article by e-mail
 Cited by SciELO
  Cited by Google
  Similars in
SciELO
Similars in
SciELO  Similars in Google
 Permalink
INTRODUCTION
Bananas (Musa acuminata Colla) and Plantains (M. balbisiana Colla) are the fourth most important food crop in developing countries and a basic food source for 400 million people worldwide. Currently, world production grew at a compound annual rate of 3,2 percent is about 114 million tons in 2017 (Agronet, 2017). Where the main producers are India, China, the Philippines, Ecuador, and Indonesia. In economic terms, this crop represent incomes of around USD$8 billion annually. The main exporters in Latin America and the Caribbean are Ecuador, Costa Rica and Colombia, accounting for more than 40% of production in the region from 2010 to 2016 share between 2010 and 2016, In Colombia the production is approximately 2,0 million tons annually with a yield of 24,88 tons per hectare, being the departments of Antioquia, Magdalena, and La Guajira are the main producers (Agronet, 2017).
Through genetic studies, some attempts have been made to clarify the controversy about the origin of domesticated cultivars of the Musa genus, for which four wild species [M. acuminata (AA), M. balbisiana (BB), M. textilis Neé and M. schizocarpa N.W. Simmonds] have been proposed as the source of genetic background, being M. acuminata and M. balbisiana the major contributors of the genomic introgressions (D’hont et al., 2012). The origin of many cultivars (hybrids) resides mainly on crosses of genomes with different ploidy constitutions such as diploids (AA, AB, BB), triploids (AAA, AAB, ABB), and tetraploids (AAAA, AAAB, AABB, ABBB). This characteristic relies on the hypothesis that the hybrid cultivars have arisen through backcrossing between interspecific hybrids and parental species. This would have led to the generation of a complex spectrum of genotypes and cultivars (De Langhe et al., 2010). In our view, we consider it necessary to know these variations through both morphological and genetic characterizations. These characterizations can be performed using traditional techniques based on morphological traits (phenotype), and through laboratory techniques with the application of molecular markers (genotype), being both processes valid and complementary to each other. Considering that the morphological characterization is the first step to study the genetic variability that provides key features like colors, shapes, smells, and textures, it is possible to infer about the potential uses of a particular species (Doyle, 1991). On the other hand, molecular methods provide specific genetic information based on the development and application of technologies used to identify genetic variability present in the Musa germplasm, offering information about of the polymorphism found at the DNA level allowing the genetic differentiation among individuals (Christelová et al., 2017). Microsatellites are codominant molecular genetic markers based on different repetitive sequences present in the genomes. These genetic markers are universally scattered, possess a high level of polymorphism, and due to their small size are of easy detection (Vieira et al., 2016).
Although several methods have been used for allele detection, the technology of fluorescently labeled microsatellites or Simple Sequence Repeats-SSR is an excellent alternative due to its detection accuracy (identifying polymorphisms so small like a base pair), as well as its high reproducibility with codominant characteristics allowing a big advantage with respect to other type of markers such as RAPDs (Random Amplified Polymorphic DNA) (BLAIR et al., 2009; Blacket et al., 2012). The genetic identification and the morphological characterizations are important steps to identify cultivars of interest with superior attributes that allow carry out next studies of improvement and plant breeding. The goal of the present study was to characterize molecularly and morphologically Musa cultivars commonly grown in farms from Caldas department with the aim to identify their classification to evaluate a small panel of fluorescently labeled SSRs applicable for Musa cultivars identification and germplasm evaluation respect to their capability of discrimination and polymorphism detection.
MATERIALS AND METHODS
Plant material
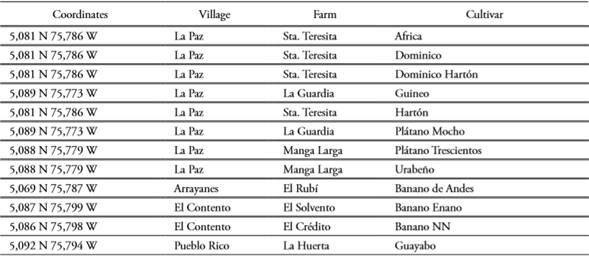
Plant material of 12 Musa spp. cultivars were analyzed in situ in seven farms from San Jose municipality (Caldas, Colombia; Table 1). Morphological descriptions were registered from single individuals for every cultivar, from which fresh leaf tissue was harvested for downstream molecular analyses.
Morphological characterization
The morphological characterization was carried out following the descriptors proposed by IPGRI (IPGRI, 1996). The trait registration was performed on plants with bunch completely developed under physiological maturity, which comprises fruits with little prominent ridges and a light-yellow tonality on the fingers of the first hand of the bunch. A total of 57 morphological variables were registered, being 38 qualitative and 19 quantitative, ordered in seven different clusters according to the organ of the plant evaluated: plant general appearance, pseudostem and sucker, leaf, male bud, bracts, male flowers and fruit.
Data analysis for morphological variables were performed on the statistical package SAS version 9,3 (2016). For quantitative variables, analysis of variance, correlation, principal components and clustering were carried out, whereas for the qualitative descriptors a principal component analysis (PCA) was employed to select the most informative variables, also correlation and clustering analyses were built based on these traits. These analyses allow estimating the parameters of each variable that contributes to the clustering definition and consequently the identification of the cultivars with similar characteristics (Doyle, 1991).
Molecular characterization
DNA extraction
Genomic DNA was extracted from young leaf tissue using the protocol for DNA extraction proposed by Doyle (1991). To verify the quality and concentration of the DNA, measurements on a spectrophotometer (Colibri Titertek Berthold) and visualization on agarose gel 1% (stained with GelRed® Biotium) were performed. Finally, DNA dillutions where performed to normalized to 20ng/µl for PCR amplification reactions.
Fluorescent microsatellites amplification
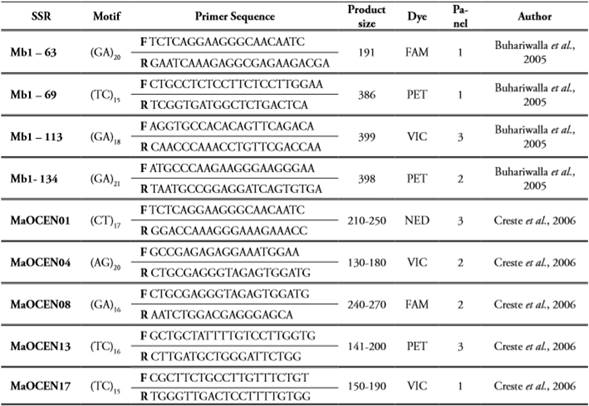
PCR amplifications were executed using 10 specific microsatellites (SSR) markers developed for the Musa genus from A genome (Creste et al., 2006) and B genome (Buhariwalla et al., 2005). All SSRs were fluorescently labeled at the 5’ end of each forward primer (the reverse primer remains unmodified) and organized in 3 panels based on the fluorescence and allele sizes reported for each SSR to avoid overlapping effects, moreover by using differential fluorescence in every panel it allows a more precise allele calling for each sample (Table 2). The PCR reactions were performed in 96-well plates and amplified in a PTC-100 thermal cycler. The samples were adjusted to a final volume of 20µl, containing 20ng of genomic DNA, 5,4µL of ultrapure water, 0,8µL of each primer (10µM), 0,16µL of Taq DNA polymerase (0,05u/µL; Fermentas), 2,16µL of PCR Buffer (NH4)2SO4 10X, 1,6µL of MgCl2 (25mM), 3,47µL dNTP’s (5mM), 2µg/ mL of BSA and 1,6µL of Trehalosa (10%). The amplification parameters were as follows: initial denaturation step at 94°C x 5 min, 32 cycles of 94°C x 1 min, 62°C for 1 min and 72°C for 1min, followed by a final extension cycle of 72°C x 10 min. The amplicons were visualized under UV light in agarose gels 1,5% stained with GelRed® (Biotium).
Panels organization, multiplexing and alleles detection
All primers were organized according to the fluorescent dye [6-FAM (Blue), NED(Yellow), (PET) Red and (VIC) Green] and allele sizes previously reported.
Three panels were organized with three pairs of primers each (forward and reverse) (Table 2). The multiplexing strategy was as follows: 1) once all SSRs from every panel were amplified and verified, the PCR products were mixed in a single 96-well plate (10µl from every SSR) considering the position of every sample into the plate, in that sense three different dyes are combined in every well for every sample; 2) from the multiplexing plate an aliquot of 5µL was transferred into a new plate; and 3) the fluorescence detection was carried out in Cornel University (USA) using the ABI 3730xl DNA analyzer Applied Biosystems following the manufacturer’s instructions. The detection system was based on the capillarity technology where fragment sizes are separated according to the differential migration on each capillary, at the same time a molecular-weight size marker, with known fragment sizes, is added and analyzed to determine the specific size of alleles obtained for every single sample. This detection is performed by a laser that detects the signal emitted by the fluorophore contained in the amplicons as well as in the molecular-weight size marker.
Data analysis
For the alleles calling, the software GeneMarker® (Soft Genetics State College, United States of America) was used specifying the panel, expected allelic sizes (in base pairs) and the dye to the respective fluorophore. Once the alleles were detected, a data matrix was obtained and organized in Microsoft® Excel. For dissimilarity analysis, the software DARWIN v. 6.0.014 (Perrier et al., 2003) was used, following the genetic distance methods and the Neighbor-Joining Tree algorithm based on a Bootstrapping of 3000 replicates, generating a Maximum Parsimony unrooted tree a priori which represents the best topology of the genetic diversity. For the identification of Polymorphic Information Content (PIC), the number of alleles, heterozygocity and genetic diversity, the software PowerMarker v. 3.25 (López & Hidalgo, 1994) was used. Additionally, the estimation of genetic distances between individuals and the Principal Coordinates Analysis (PCoA) were carried out in GenAlEx v. 6.0 (a complement program for Microsoft® Excel). To build a three-dimensional PCoA graphic, the software XLSTAT (Addinsoft, 1993) was employed, representing the distribution and relative spatial location of the cultivars according to their genetic distances. Finally, a hierarchical cluster analysis (dendrogram) was built with the statistical package R (2008) under Ward genetic dissimilarity algorithm.
RESULTS AND DISCUSSION
Morphological characterization
Correlation analysis
From a total of 57 morphological descriptors obtained for the 12 Musa cultivars, 19 quantitative variables were considered [five with banana type genome (A) and seven with plantain type genome (B)], for the simple correlation analysis which showed five highly significant (P ≤ 0,001) and positively correlated variables such as: fruit length with number of empty nodules (r2 = 0,84), diameter with perimeter of the peduncle (r2 = 0,99), male bud perimeter with diameter (r2 = 1,0), male bud length with perimeter (r2 = 0,92), and male bud length with diameter (r2 = 0,92). This indicates that such descriptors are very correlated and to consider them as stable descriptors, for future characterizations of related cultivars and to minimize the number of descriptors for this characters (Franco & Hidalgo, 2003; Batte et al., 2018).
Among the significantly (P ≤ 0,05) correlated variables, 16 of them were considered being 11 positively correlated and 5 negatively correlated. The variables for positive correlations ranged between r2 = 0,76 (for male bud size with diameter) and r2 = 0,81 (for blade length with pseudostem height), whereas the lowest correlations were between the variables: pseudostem height with aspect (r2 = 0,59), blade length with peduncle length (r2 = 0,60), and blade width with peduncle perimeter (r2 = 0,62).
The negatively correlated variables comprised: number of fruits with leaf ratio (r2 = -0,61), pseudostem height (r2 = -0,67), petiole length (r2 = -0,61), and fruit length (r2 = -0,71), and finally fruit length with male bud size (r2 = -0,65). These negative correlations highlight the influence between the number of fruits with fruit length, considering that as the higher the number of fruits the lower the length of them, this a very important characteristic to take into account in plant breeding programs. Previous morphological studies have demonstrated the significant discrimination among Musa cultivars related to male bud, flower, and fruit (Daniells et al., 2001) which agrees with the results obtained here.
Principal component analysis
For the principal component analysis, 74,26% of the variance was explained in the first three components, where the first contributed with 34,44% of the variance, being positive and negative correlations observed. For example, variables such as diameter (0,3237), perimeter (0,3236) and length (0,2933) of the male bud contributed positively to the component, whereas fruit length (-0,3057), number of nodules on the peduncle (-0,2411) and petiole length (-0,2389) contributed negatively. These variables represent a considerable level of differentiation among the Musa cultivars evaluated here, also the variables related to male bud are key factors to be considered in further analyses. For instance, Geronimo et al. (2013) who analyzed morphological characterizations on eight Musa varieties, found the highest discrimination influence related to male bud descriptors, also Brandão et al. (2013) identified the importance of this character for diversity quantification and variability applied in germplasm collections. These studies support the significance of male bud descriptors which, as reported here, provided the best discriminatory positive values for the cultivars analyzed.
The second component contributed with 26,07% of the variance where characteristics such as leaf length (0,4112), pseudostem height (0,4078) and aspect (0,3437) positively correlated with this component, and the negative correlations were for fruit number (-0,2347), male bud size (-0,1465) and number of nodules on the peduncle (-0,0206), being the positively correlated traits also important to be considered for cultivars discrimination. The third component, which contributed with 13,75%, is composed basically by petiole width (0,3586), perimeter (0,3301) and diameter of the peduncle (0,3280). The negative correlations comprised leaf ratio (-0,3174), male bud length (-0,2880) and petiole length (-0,2593). In general, the traits related to the bunch (i.e. male bud, peduncle, and fruit) demonstrated their influence in the three components, showing their importance for morphological characterizations.
Cluster analysis
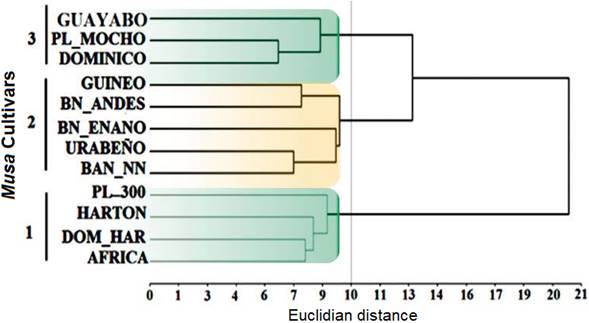
Considering the Euclidian distance obtained for the cluster analysis for quantitative variables, a cutting line distance of seven was determined to generate four main clusters. These clusters showed a very low Euclidean distance within the groups (≤ 6). For subcluster 1 the plantain cultivars Africa, Plátano Trescientos, Dominico Hartón and Hartón (known as “Horn Plantain” AAB genome) conform this group, where the most distinctive trait shared is the absence of male bud. The sub-cluster 2 is composed of plantain cultivars Guayabo, Plátano Mocho and Dominico, these cultivars are characterized by normal male bud and compact bunch appearance. For the subcluster 3 the cultivars Banano Urabeño, Banano NN, and Banano Andes conform the banana cluster, being B. Andes the most distant cultivar on which traits such as higher number of hands on the bunch (≥10), lower height, wax absence on pseudostem, long petioles and compact bunches support its differentiation, being these traits similar to those reported for the varieties known as "FHIA" (developed by FHIA organization) (Piña et al., 2006). Similarly, B. NN is related to Gros Michel banana type respect to the number of hands and bunch shape (http://www.promusa.org/Gros+Michel, visited on July 20 - 2018). The sub-cluster 4 contained Guineo, Dominico Hartón and B. Enano, however, it is noticeable that Dominico Hartón clustered with the other cultivars classified as bananas, nevertheless traits related with male bud could be influencing this particular clustering (data not shown).
The qualitative analysis, in general, showed that intermediate leaf habit was the common condition for all cultivars surveyed (91,7%), and B. Enano was the only cultivar with erect leaf habit. Respect to pseudostem height 83,3% of the plants were above 3m (measured from the base of the pseudostem to the emerging point of the bunch), also 83,4% of them possessed pseudostem girth between 45 and 64 cm (measured at 1m from the base of pseudostem), however 8,3% of plants registered weak pseudostem (25 - 44 cm) as well as 8,3% vigorous pseudostem (≥ 85 cm). Male bud was present in 53,3% of the cultivars and absent in 33,3%, although for one sample (B. Andes) there was no registration for this trait. Cluster analysis carried out for these variables showed three main sub-clusters (Euclidean cut off line distance of 10), being plantains grouped in sub-clusters 1 and 3 (highlighted in green) and bananas in subcluster 2 (highlighted in orange, Fig. 1). Characteristics such as presence or absence of male bud was the main trait that differentiated among the plantain cultivars into the sub-clusters 1 and 3 respectively. Moreover, additional traits related to pseudostem height and color, petiole canal, wax presence on leaf sheaths, blade symmetry, absence of pubescence in the peduncle, rachis position, transversal section of fruit and fruit apex, and length and width of the pedicel differentiated the sub-cluster 1; whereas for the sub-cluster 3, traits that corresponded to leaf habit and ratio, petiole length, peduncle diameter, male bud type, fruit position and peel thickness were differential for this sub-cluster. Finally, the differential descriptors for banana cluster included pseudostem aspect, color and pubescence of the peduncle, rachis type and position, male bud type, number of fruits in the bunch, fruit position and apex, presence of floral relicts, and fruit peel thickness. The descriptors included in this study were previously analyzed by Simmonds & Shepherd (1955) demonstrating its contribution to both banana and plantain cultivars discrimination for taxonomy purposes considering 15 morphological characters. However, recent studies (Batte et al., 2018) have proposed and demonstrated that stable characters should be considered a priori for any cultivar classification, which accounts: Pseudostem color, petiole sheath color, and rachis position, being these traits useful to distinguish the M. acuminata populations. The previously cited qualitative traits correlate with the findings of our study and all of which seem to be widely used at different levels. In spite of many morphological characters that differentiate M. acuminata and M. balbisiana, just a few characters distinguish them, however, imperative for Musa spp. subspecies discrimination (Rouard et al., 2018). This bias on phenotyping or morphological characters are influenced by environmental factors as well as the complementary and polygenic nature of underlying genetic factors (Brown et al., 2017).
Molecular characterization
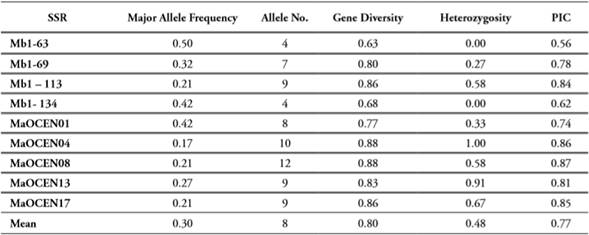
Genotyping analysis was carried out in 12 Musa cultivars using 10 fluorescently labeled Microsatellites (SSR) (See materials and methods for details). However, the SSR Mb1139 could not be amplified even though when several thermal conditions and PCR additives were tested. In previous studies this marker has been reported as a difficult locus to be amplified (Ashikin et al., 2012), probably issues related to the priming site such as mutations in the annealing sequence (Colson & Goldstein, 1999) null allele (Chapuis & Estoup, 2007), or competitive amplification (Hippolyte et al., 2012) can be underlying these difficulties. For nine SSRs, a total 216 allelic data matrix was obtained (based on the triploid nature of the hybrids), where 72 alleles showed polymorphism.
The SSR MaOCEN08 provided the highest number of polymorphic alleles (12), whereas the SSR Mb1-63 contributed with the lowest number (4). In general, the average of polymorphic alleles per locus was 8. The polymorphic information content (PIC) detected by all SSRs showed an average of 0,77, where the marker Mb1-63 was the less polymorphic (PIC = 0,56) and the markers MaOCEN08 and Mb1-113 the most polymorphic ones (PIC = 0,87), being in general highly informative loci (Table 3). Additionally, these values correlate with the considerable heterozygosity (µ = 0,48) and genetic diversity (µ = 0,79) found in the population studied, enabling not only the discrimination of the cultivars surveyed here but also their applicability for germplasm characterizations. The remarkable polymorphism identified by the SSR employed in the present study could be related to, as proposed Rouard et al. (2018), paleopolyploid condition of banana, which experienced three independent whole-genome duplications generating some genome fractionations, therefore increasing genome variability among cultivars. These chromosome rearrangements and diploidization resulting in the functional divergence of subgenomes in polyploidy bananas, additionally genomic homologous exchanges may contribute to the diversity leading to a rapid genetic modification which in turn correlates to agronomic trait (Wang et al., 2019).
Genetic differentiation between plantain and banana [hereafter population one (P1) and population two (P2) respectively] based on allelic frequencies was FST= 0,061, and according to Wright, (1978) this value indicates a moderate genetic differentiation, where the most frequent alleles for P1 corresponded to SSRs Mb1-134 and Mb1-63, and for P2 was MaOCEN13.
Dissimilarity analysis obtained for molecular data revealed three main sub-clusters categorized by the genetic distance among cultivars (Fig. 2a). From bottom-up the first cluster is composed basically by plantains under tree topology ((Dominico Hartón, Hartón) (B. Andes, Dominico)), the second sub-cluster showed a tree topology ((B. Urabeño) (B. NN, B. Enano)), and the third sub-cluster is composed by (Guayabo (Guineo, Africa) (Mocho, Trescientos)). Despite that Guayabo and Guineo are classified as bananas these cultivars are cooking bananas, characteristic shared with plantains and in which case, probably, the genetic background could be playing an important role in their relatedness. However, cluster comparisons demonstrated some plantain and banana cultivars well-differentiated, and this differentiation resides on the private alleles found for P1 at two loci MaOCEN04 (146, 160, 162bp) and MaOCEN08 (250, 258, 259bp), whereas for P2 the private alleles were found at three loci Mb1-34 (386), Mb1-113 (361) and MaOCEN01 (244). Additionally, the agreement between the sub-clusters for some banana cultivars (B. Enano, B. Urabeño and B. NN) obtained from quantitative and qualitative traits and molecular data represents the well-differentiated banana cultivars for both morphological and molecular analysis. However, some disagreements in tree topology between all datasets were found for the sample B. Andes (AAAA). This cultivar has not been characterized before being difficult to trace its origin. The molecular profile showed a considerable differentiation of B. Andes respect to banana cluster, instead, it is grouped with plantain cultivars. The uniqueness of this sample relies on the absence of two alleles (≥ 300bp) at the locus Mb1-69 plus the private alleles for MaOCEN04 (144bp), MaOCEN08 (247 and 250 bp), MaOCEN13(151bp) and MaOCEN01 (238bp). However, the closeness of B. Andes with plantain cultivars reside basically on 5 private alleles shared between them, SSR Mb1-63 (384bp), MaOCEN17 (166bp), Mb1-134 (384bp) MaOCEN13 (156bp) and Mb1-113 (353bp), probably causing this association. Also due to the genomic origin of these SSRs (Buhariwalla et al., 2005; Creste et al., 2006) indicates that they are not related to phenotypic traits, consequently being under higher mutational events (XU et al. 2013; Vieira et al., 2016). Moreover, studies carried by Buhariwalla et al. (2005) demonstrated the detection of homologous loci using SSRs designed in B genomes that later could be amplified in A genomes cultivars. Also, the hybrid origin of plantain cultivars [M. acuminata (A) x M. balbisiana(B)] could be related with the genomic background that exist among them, and finally a plausible explanation indicates that all alleles with the same length at the same locus could arise from different alleles with convergent evolution (i.e. homoplasy), condition that is widely known in microsatellites evolutionary nature (Estoup et al., 2002; Hippolyte et al., 2012), nevertheless the origin of this cultivar remains uncertain and further studies are required.
Genetic dissimilarity analysis
Under Neighbor-Joining (NJ) algorithm the genetic dissimilarity analysis showed three main sub-clusters that agree with the previously described cluster analysis, and again B. Andes is close to plantains demonstrating the influence of shared alleles among these cultivars. However, the only well supported sub-cluster under bootstrapping of posterior probability (3000 replicates) was the banana sub-cluster (≥70%)((B. Urabeño (B. Enano, B. NN)) indicating the high differentiation of these cultivars and the complex genetic background among plantains (≤5% of genetic dissimilarity) and the subsequent low bootstrapping support (≤31%) for the basal nodes (Fig. 2b). On the other hand, Principal Coordinate Analysis (PCoA) explained 35,85% of the genetic variation among Musa cultivars through three main axes. The axis one explained 18,53% of the genetic variation, the axis two 17,4% and the axis three 13,54%. Although P1 and P2 populations are highly differentiated under this analysis, some cultivars can be identified as intermediates (Guineo and Guayabo) indicating the considerable hybridization present on them (Fig. 2c). In previous studies, Guineo and Guayabo cultivars were classified into the banana group based on the results obtained for morphological, physical, and chemical analysis (Corpoica C.I Palmira-Colombia, personal communication), nevertheless under molecular data these cultivars clustered within the plantain group, this could be a result of the genomic nature of the SSRs employed for this analysis and the hybrid nature of these cultivars (with a considerable introgression of A and B genomes). Respect to B. Andes it is grouped apart based on the differential traits that it possesses, showing disagreements among morphological and genetic analyses.
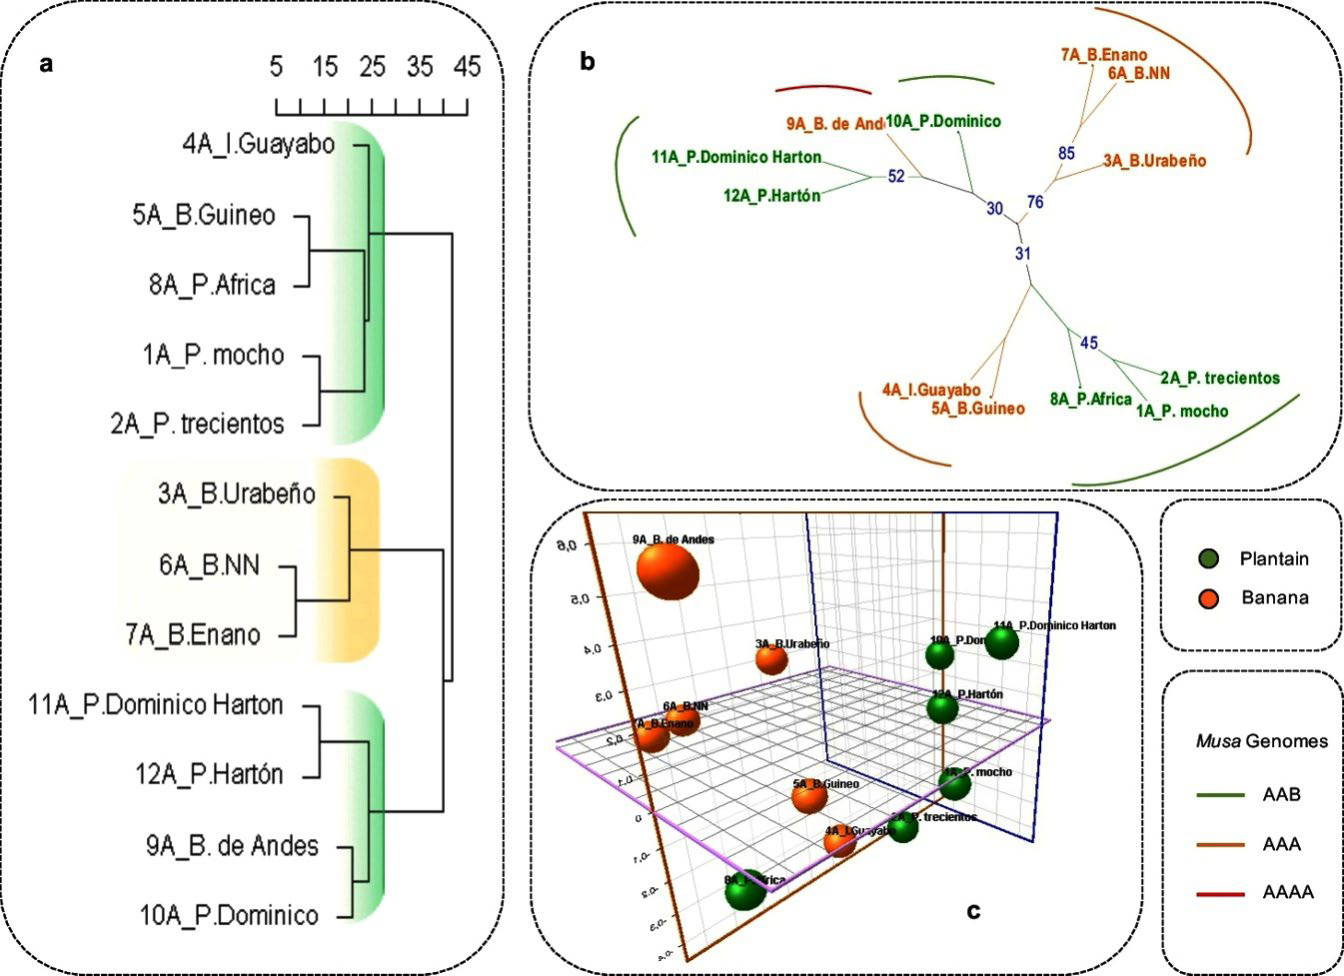
Figure 2 a. Ward dissimilarity analysis for 12 Musa cultivars using 9 SSRs, where the scale values are considered in percentage (highlighted in green are plantain clusters and in yellow banana cluster). b. Unrooted neighbor-joining tree where the bootstrap values are shown in blue. c. Three-dimensional graphic for Principal Coordinate Analysis (PCoA) showing the samples evaluated (plantains green and banana yellow) with their respective identifications.
CONCLUSIONS
The identification of a few differential morphological traits such as pubescence, apex fruit shape and waxy condition in pseudostem and leaves, are a very important tools for cultivars classification on the field, also highly applicable for Musa collections and germplasm banks to ease the codification of information inherent to specific cultivars. The set of SSR markers employed in the present study demonstrated the discrimination power, not only between M. acuminata and M. balbisiana, but also within species level and closely related cultivars. Together with automated detection systems, these fluorescently labeled SSRs can be useful for genetic diversity studies in Musa species and highly applicable for germplasm evaluations and genotyping. Nevertheless, more genetic markers need to be added to clarify the genetic origin of Guayabo, Guineo and B. Andes cultivars and to identify the genetic background underlying these intermediate hybrids.

