


Services on Demand
Journal
Article
 text in
  English (pdf)
 Article in xml format
 Article references
 Send this article by e-mail
Indicators
-
 Cited by SciELO
 -
 Access statistics
Related links
-
 Cited by Google
 -
 Similars in
SciELO
Similars in
SciELO -
 Similars in Google
Share

 Permalink
Persona y Bioética
Print version ISSN 0123-3122
pers.bioét. vol.15 no.2 Chia July/Dec. 2011
THE FERTILE WINDOW AND BIOMARKERS:
A REVIEW AND ANALYSIS OF NORMAL
OVULATION CYCLES
José María Murcia-Lora1, María Luisa Esparza-Encina2
1 Specialist in Gynecology and Obstetrics. Doctor of Medicine and Surgery, Universidad de Navarra, Spain.
2 Specialist in Endocrinology and Nutrition. Doctor of Medicine and Surgery, Universidad de Navarra. NaProTechnology and Functional Reproductive Medicine. Clinical Consulting G&E, Logroño, Spain. clinicag-e@edunet.es
DATE OF RECEIPT: 07-10-2010 DATE OF ACCEPTANCE: 06-05-2011
Abstract
The purpose of this article is to review the principle concepts in literature concerning the fertile window in patients with normal menstrual cycles. The basic concepts of ovulation are examined as well. The primary emphasis is on an analysis of Brown's theory of ovulation and a look at the basic concepts concerning secretion, the metabolism of follicle-stimulating hormones, and clinical, ultrasound and biochemical study of the follicular development of the fertile window. Also examined are the clinical biomarkers and the different endocrinal metabolites that have been tested in the fertile phase of the cycle. A number of studies are reviewed in which measured concentrations of sex steroid hormones in plasma and urine were shown to have a direct bearing on identifying the fertile period. This knowledge is relevant for different interest groups, particularly couples who are interested in fertility awareness and can benefit by applying currently available technical know-how to detect the fertile window. Couples involved in fertility regulation programs (FRP) who want to prevent pregnancy can benefit as well, as can those who want to pinpoint the most fertile time for becoming pregnant. Other target groups include persons who have no experience with FRP courses, but would like to improve their fertility awareness through a short interview, or couples who are looking for pregnancy options through NaProTechnology programs or have taken family orientation courses.
Key words: Fertility, reproduction, biological markers, ovulation. (Sourc: Decs, Bireme).
LA VENTANA DE LA FERTILIDAD Y MARCADORES BIOLÓGICOS:
REVISIÓN Y ANÁLISIS EN CICLOS OVULATORIOS NORMALES
Resumen
El objetivo de este artículo es revisar los principales conceptos en la literatura acerca de la ventana de la fertilidad en pacientes con ciclos menstruales normales. Los conceptos básicos de la ovulación han sido revisados. El énfasis principal del artículo se ha dirigido al análisis de la teoría de Brown de la ovulación, revisar los conceptos básicos de la secreción y metabolismo de la hormona folículo estimulante, y al estudio clínico, ecográfico y bioquímicos del desarrollo folicular la ventana de la fertilidad. Este artículo también repasa los biomarcadores clínicos y los diferentes metabolitos endocrinos que han sido probados en la fase fértil del ciclo. Se revisan diferentes estudios en los cuales las valoraciones en suero y orina de los esteroides sexuales han corroborado tener una correlación directa para enmarcar el período fértil. Actualmente tienen relevancia estos conocimientos en diferentes grupos de interés, sobre todo en parejas con un alto nivel de motivación en el reconocimiento de la fertilidad, y que pueden beneficiarse mediante la aplicación de los conocimientos técnicos actuales en la detección de la ventana de la fertilidad. Otro tipo de parejas suelen ser aquellas que pertenecen a programas de regulación de la fertilidad (PRF) con intención de distanciar un embarazo, así como también de reconocer la época más fértil del ciclo para conseguir un embarazo. Otros interesados suelen ser personas que no tienen experiencia en cursos de PRF, pero desean mejorar su conocimiento en el reconocimiento de la fertilidad por medio de una breve entrevista, o parejas que buscan opciones de un embarazo mediante programas de NaProTecnología o que han realizado cursos de orientación familiar.
Palabras clave: fertilidad, reproducción, marcadores biológicos, ovulación. (Fuente: Decs, Bireme).
A JANELA DA FERTILIDADE E MARCADORES BIOLÓGICOS:
REVISÃO E ANÁLISE EM CICLOS OVULATÓRIOS NORMAIS
Resumo
O objetivo deste artigo é revisar os principais conceitos na literatura sobre a janela da fertilidade em pacientes com ciclos menstruais normais. Os conceitos básicos da ovulação foram revisados. A ênfase principal do artigo se dirige à análise da teoria da ovulação de Brown, revisar dos conceitos básicos da secreção e metabolismo do hormônio folículo estimulante, e ao estudo clínico, ecográfico e bioquímico do desenvolvimento folicular a janela da fertilidade. Este artigo também revisa os biomarcadores clínicos e os diferentes metabolitos endócrinos que foram provados na fase fértil do ciclo. Revisam-se diferentes estudos nos quais as valorações em soro e urina dos esteroides sexuais comprovam ter uma correlação direta no estabelecimento do período fértil. Atualmente esses conhecimentos têm relevância em diferentes grupos de interesse, sobretudo em casais com alto nível de motivação no reconhecimento da fertilidade e que podem se beneficiar mediante a aplicação dos conhecimentos técnicos atuais na constatação da janela da fertilidade. Outro tipo de casais costuma ser aquele que pertence a programas de regulação da fertilidade (PRF) com intenção de distanciar uma gravidez, assim como também de reconhecer a época mais fértil do ciclo para conseguir uma gravidez. Outros interessados costumam ser pessoas que não têm experiência em cursos de PRF, mas desejam melhorar seu conhecimento no reconhecimento da fertilidade por meio de uma breve entrevista, ou casais que buscam opções de uma gravidez mediante programas Naprotecnologia ou que realizaram cursos de orientação familiar.
Palavras-chave: fertilidade, reprodução, marcadores biológicos, ovulação. (Fonte: Decs Bireme).
INTRODUCTION
Different lifestyles, the more advanced age at which women seek to become pregnant, and changes in living habits can make it difficult for some women to conceive. These are the types of couples NaProTechnology can assist in improving their chances of pregnancy (1, 2). The fertile window is comprised of the days of the menstrual cycle when pregnancy is possible. It can be used to prevent pregnancy through natural fertility regulation programs (NFP), or as a way to target the most fertile time for becoming pregnant. The primary objective of this study is to analyze and review the major concepts of the biomarkers in the fertile window and to incorporate some of the physiological concepts that determine the regularity of ovulation cycles.
THE BIOLOGICAL CLOCK OF OVULATION
The female menstrual cycle is determined by interaction between the regulatory systems of the hypothalamic-hypophysis-gonadal-axis at three main levels: in the gonadotropin-releasing hormone (GnRH) pulse, at the hypophysis level and at the ovarian hormone level. The predominant hormones involved in the menstrual cycle are the gonadotropin-releasing hormone (GnRH), the follicle-stimulating hormone (FSH), the luteinizing hormone (LH), estrogens, and progesterone. GnRH is secreted by the hypothalamus. The gonadotropins, FSH and LH are secreted by the anterior pituitary gland, and the estrogens and progesterone are secreted in the ovary (3). In the initial phase of the menstrual cycle, the estrogens stimulate the production and release of FSH and, through a process of positive feedback, FSH increases during the first half of the cycle. Towards the middle of the cycle, the rise in FSH and LH determine if ovulation is possible. Later, the surge in FSH and LH generates a negative feedback in the form of a gonadotropin secretion, and the hormone levels fall during the second half of the cycle. If pregnancy does not occur, the production of estrogens and progesterone begins to decline after ovulation, and the end result is the shedding of the endometrium in the form of menstrual bleeding (4).
THE DYNAMICS AND METABOLISM OF THE FOLLICLE-STIMULATING HORMONE. THE BROWN THRESHOLD HYPOTHESIS AND FOLLICULAR DEVELOPMENT
The hypophysary follicle-stimulating hormone is a heterodimeric glycoprotein comprised of two non-covalently linked chains: a and b (5, 6, and 7). In women with normal and regular cycles, the FSH levels exhibit a constant pattern throughout the cycles. FSH levels increase during the follicular phase and are higher in the preovulatory period, with a typical surge at the middle of the cycle. During a woman's reproductive years, when plasma estradiol concentration is greater, the FSH molecule is less glycosylated and has a shorter half-life, but more receptor affinity (8, 9). At the start ofthe menstrual cycle, a follicle-stimulating hormone induces cellular differentiation and proliferation in the preovulatory follicle. At this point in the cycle, there is a FSH-sensitive cohort of antral follicles measuring 2-5 mm in diameter (10). When the surge in FSH occurs, each of these follicles, with its own FSH sensitivity, enters a final phase of rapid growth and the number of follicles that will be stimulated depends of the length of time during which FSH levels were above the threshold of the period when the follicles is sensitive to the influence of FSH. The most sensitive follicle; that is, the first one to initiate the growth phase, will become the leader, and the FSH sensitivity of the dominant follicle increases. This dominant follicle secretes growing amounts of inhibin to suppress the hypophysary FSH release through negative feedback, thereby preventing new follicles from entering the rapid growth phase. As the FSH concentration declines, the less mature follicles that are still FSH-dependent cannot achieve enough aromatization to create an estrogenic environment. As a result, they convert to predominantly androgenic and atretic follicles. The dominant follicle, which already has acquired sufficient aromatization through the increase in granulosa and FSH receptors cells, can achieve ovulation despite the decline in FSH. Ever since Brown's study in 1978 (11), it is known the ovary probably responds to a certain FSH threshold. This hypothesis is referred to as the threshold theory in the spontaneous ovarian cycle and in GnRH-stimulated cycles. The effect of FSH in the ovary depends on plasma concentration. In normal menstrual cycles, FSH is cleared from the body's circulatory system by the kidneys and liver. In the presence of a constant plasma concentration of FSH, and despite a reduction in FSH, the ovary probably responds to a certain FSH threshold. Other studies also demonstrate the existence of this threshold (12, 13). By elevating plasma FSH concentrations to a threshold level of 15- 20 mIU/mL, they show estradiol begins to increase above the baseline values. Later, the estradiol concentrations rise during the spontaneous follicular phase. This event serves as a marker by indicating the dominant follicle has responded to a FSH threshold level and has worked to end the ovulation process. There is a good, documented correlation between the low fertility days, with plasma levels ofestradiol at 291.25 ± 8.89 pmol/l (mean ± SEM), and the high fertility days, with a plasma levels of estra-diol at 701.22 ± 16.28 pmol/l (P < 0.0001). The peak or maximum fertility days were found to have plasma levels of estradiol at 734.54 ± 26.81 pmol/l, and highest plasma estradiol concentrations are 1211.57 ± 32.81 pmol/l two days before ovulation, with the end of the fertile period coming after a peak in LH in plasma, with concentrations of 51.22 ± 2.4 IU/l (14). Therefore, these results clearly support Brown's threshold hypothesis (11).
THE FERTILE WINDOW
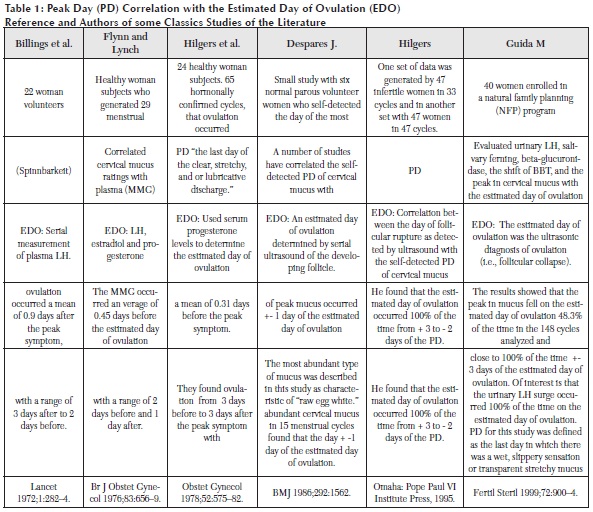
The estimated day of ovulation (EDO) is crucial to determining the signs that mark the fertile period. The initial studies that estimated EDO using basal body temperature include the works by Barrett and Marshall in 1969 (15), Schwartz in 1980 (16), and Royston in 1982 (17). Other studies estimated the day of ovulation using cervical mucus or secretion, such as the one by the World Health Organization in 1983 (18) and Hilgers's work in 1992 (19). Measurements of urinary estradiol derivates also have been used as ovulation markers. Wilcox's study in 1995 is an example (20). Another method involves a hormonal assessment of the follicular and proliferative phase by describing the cytomorphological changes that occur near the periovulatory phase, in both the endometrium and the cervico-vaginal epithelium. This is done using the Papanicolaou test (PAP smear) (21, 22).
To determine the length of the fertile window and the odds of pregnancy in relation to ovulation, it is necessary to know the lifespan of the male sperm in the female reproductive tract (23). While the human ovum has an average lifespan of approximately 24 hours, which makes conception difficult and highly unlikely after the day of ovulation, the lifespan of sperms is potentially much longer and more variable under optimum conditions (20).
The American Society for Reproductive Medicine has defined the length of the fertile period as the first day oestrone-3-glucuronide (E3G) is detected in urine up to the second day after the luteinizing hormone (LH) peaks, which usually varies between <1 to >7 days (24). Currently, most studies define the period of greatest fertility as -6 days before ovulation and lasting until one (1) day after ovulation. Generally, the change from infertile days to the most fertile days in the follicular phase of the menstrual cycle occurs during this interval, which is determined by the gradual increase in plasma E3G concentrations from -6 days prior to ovulation and up to ovulation (4, 14, 20, 23, 25).
A correlation has been shown between concentrations of estradiol in plasma and concentrations of E3G in urine and, in turn, a concentration of LH in plasma with the LH peak day in urine (14). In urine, the fertile period can be marked by pinpointing 20-30 ng/ml of E3G from-6day to the end of the fertile period, detected by the LH peak, typically > 30 IU/l.
Urinary E3G measurement has been shown to be successful in indentifying the fertile period. Based on the use of urinary LH peaks as a marker for ovulation, it is possible to conclude that a 50% surge in E3G concentration over the average of the last three values can be used to locate the start of the fertile period (14). Others studies show the use of E3G is 83%, 89% and 90% successful in outlining the potentially fertile period (26, 27, 24).
By collecting daily first morning urine samples and 24 hour pooled samples in 70 menstrual cycles, Adlercreutz located two strategic intervals to mark the fertile period (28). Definition of the first interval is based on a surge of 50% in the concentration of estrone-3-glucuronide compared to the mean of the three previous values. This method was used to locate the start of the fertile period in more than 90% of the cycles in which ovulation was detected with the LH peak. The second interval was identified at the end of the fertile period, which coincides with most studies; namely, on the second day after the luteinizing hormone (LH) peak. He also identified the start of the infertile period with a 50% increase over the mean of the three preceding values of the concentration coefficient derived from estrone-3-glucuronide/pregnanediol-3-alpha-glucuronide, which also indicates the start of the infertile period in more than 80% of the ovulation cycles (28). Fehring showed the inter- and intra-variability of the length of this fertile window among woman with normal fertility and as a way to regulate menstrual cycles (29).
CLINICALLY PREDICTING THE FERTILE WINDOW THROUGH CERVICAL MUCUS
Cervical mucus is synthesized in the endocervix by ciliated and secretory cells in response to estrogen stimulation. Cervical mucus has been regarded as a hydrogel comprised of a liquid phase and a solid phase, with three important components: (a) mucus molecules that constitute primarily the solid phase, which fundamentally consists of glycoproteins; b- a liquid phase comprised of water; and (c) chemical and biochemical compounds such as salts, minerals, sugars, amino acids, lipids, protein chains, enzymes, etc. These compounds define the main biophysical parameters of mucus secreted from the cervix; namely, its quantity, aspect, viscoelasticity and crystallization (30).
THE BIOPHYSICAL PARAMETERS OF CERVICAL SECRETION QUANTITY
The volume of cervical mucus increases near the periovulatory period, and the maximum amount usually is observed at EDO -1 and 0 in cycles not subject to any form of treatment (31).
Aspect
Cervical mucus is opaque and less transparent in the early stage of the infertile period. It becomes more transparent as the time of ovulation approaches, peaking close to ovulation, with transparency similar to that of an egg white from day -2, -1, 0 of ovulation. H. Temprano, in a study with 205 samples, obtained the highest transparency on day -1, followed by days -2, -1 and 0 with respect to the day of ovulation (32, 33).
Viscoelasticity
Cervical mucus has remarkable rheological features and many terms have been used to describe this property, such as viscosity, elasticity, viscoelasticity, stickiness, plasticity, retraction and spinnbarkheit, among others (34). The traditional way to evaluate this parameter is to measure the length, in centimeters, of an amount of discharge stuck to two surfaces that are separated. When ovulation is near, cervical mucus can stretch up 10 centimeters or more, without breaking (35). Quantity and elasticity increase during one or two days before the peak day, and during the peak day itself, as demonstrated by the different studies cited in Table 1.
Crystallization
In 1946, Papanicolaou discovered cervical mucus crystallizes due to an increase in the amount of sodium chloride induced by a surge in estrogen levels (36). Previously, in 1913, Hüner explained how changes in cervical mucus allow the sperm to permeate (37). Odeblad, in 1966, began to describe the different crystal patterns of cervical mucus, initially classifying them into two types: Type E secretion, which is predominantly estrogenic, and Type G secretion, which is gestagenic and segregated during the luteal phase (38, 39, and 40). In 1983, the same author introduced a model to explain the spermatic ascent of good quality sperm in fertile mucus and, in turn, the impermeability to the passage of sperm due to mucus with infertile characteristics. Using magnetic resonance imaging (MRI), Odeblad showed the channels formed in cervical mucus during the peak periods of fertility are about three (3) micromicrons in diameter, as opposed to 0.3 micromicrons in diameter during the infertile luteal phase and impermeable to the diameter ofthe sperm head, which is 2.5 micromicrons (41). He also presented a model explaining the types of mucus produced in the different uterine cervical crypts. Odeblad describes L secretion, or locking-in mucus, on the basis of its ability to trap sperm. It is secreted in the middle-lower part of the cervical cannel. S secretion is referred to as sperm-transmission mucus; it is produced in the upper cannel and is suitable for sperm progression due to its low viscosity. Both secretions are estrogen dependent. He also describes a third type of mucus, known as G secretion, which is produced by glands near the outer cervical orifice and depends on progesterone production. To accomplish this, Odeblad analyzed 1,124 cervical mucus samples and proposed a basic diagram of the percentages of L, S and G secretion during the menstrual cycle in ovulation cycles (42).
Changes in Cervico-vaginal Exudate and Salivary Ferning Odeblad detected the different characteristics of cervical mucus through endocervical exploration, thereby making it possible to recognize the various patterns he described. However, the most likely application today is probably in clinical practice. Alliende's study shows the fertile changes in cervico-vaginal fluid (CVF) can be identified through self- aspiration. In that study, self-extraction of cervico-vaginal fluid from the upper third of the vagina can be used to identify the fertile period by observing the changes in CVF throughout the cycle (43).
Collecting samples of salivary secretion to evaluate their ferning, using a pocket microscope, also is a widely accepted practice. A direct correlation has been found between the different salivary ferning patterns and the fertile period. Although exploration may be limited by the small field, salivary fernings as fertile period markers can be observed with a pocket microscope. However, the different patterns described in salivary ferning have been used mainly in combination with other sympto-thermal methods of ovulation detection to help women pinpoint their fertile period (44).
Biomarkers Combined with Basal Body Temperature
The increase in progesterone produces an elevation in basal body temperature (BBT), indicating ovulation has occurred already. In other words, it is not a predictor of ovulation (45). This increase in progesterone is produced by luteinization of the ovulatory follicle in response to the peak in LH. Nevertheless, Colombo's study found the BBT nadir to be present during the days of maximum fertility, in 42.9% of the cases studied, and it has been defined as the point that coincides with those days (46). The Creighton model introduces a method that combines BBT with cervical secretion and changes in the anatomy of the cervix. The sympto-thermal method is highly effective. It involves a combined assessment of various fertility indicators; namely, cervical secretion and basal body temperature, with a counting system to determine the fertile period in a cycle. Especially interesting is the variation of the sympto-thermal method known as the "double control" system, which always uses two or more indicators evaluated simultaneously to determine the fertile period with greater certainty. It is a highly effective method for natural fertility regulation as well, particularly since it is easy to use and requires only a short period of instruction for couples to learn the fertility indicators (1, 47).
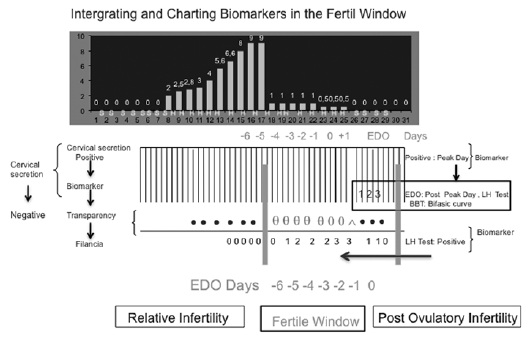
At present, there is no device for a precise measurement of the different characteristics of the cervical mucus at the cervix (48). However, the crucial points of the different methods for identifying the fertile window can be combined (49, 50). For example, some of the parameters of the biomarkers of the fertile window are combined in Figure 1.
Biosel is one of the new technologies that includes BBT. It is a monitoring device women can use to record their BBT and a source of support for women who know their fertility, since it tracks and records the temperature. It provides technical support in registering the target BBT in women with regular cycles who manage to adapt to the device (51).
THE FERTILE WINDOW AND DIGITAL MONITORS
Identification of the fertile period through hormone verification with digital monitors has been possible thanks to studies that show a high correlation between plasma measurements of LH and estradiol, with their equivalent derivatives in urine. These studies substantiate the possibility of integrating hormonal detection in urine with algorithms in digital monitors. Currently, there are monitors that can determine the fertile and infertile periods of the menstrual cycle, with a good degree of reliability, through the use of light or colorimetric signals. These signals have been incorporated into a number of commercially accepted devices. The best known are those that incorporate LH and E3G (52).
Monitors to Detect LH and E3G
ClearPlan detects peak fertility through the surge in LH, indicating ovulation is imminent. The LH surge occurs 24 to 48 hours after ovulation in 98 % of the cases, but never before (53). This device provides a visual display indicating a period of maximum fertility is near. The change in the monitor during fertile periods is triggered by the detection an LH peak, typically with a concentration > 30 IU/l (54, 55).
The ClearPlan Easy Fertility Monitor (CPEFM)
One of metabolites derived from estradiol and widely studied in urine is E3G, which is quantitatively important (54). A high correlation already has been found between the concentration of estradiol found in plasma and the E3G concentrations in urine. Today, a woman with a regular menstrual cycle can pinpoint, at home, her high fertility days based on changes in E3G concentration, when they exceed 20-30 ng/ml.
CPEFM identifies the onset of the fertile window with the first E3G surge over the threshold. This interval usually begins on day five prior to ovulation and extends up to the day of ovulation, which is understood as the "day -6 of the fertile window." Subsequently, the monitor will display the peak fertility period on the day of the LH surge and the day after that surge. It also will show high fertility for one day more, prior to the return to low fertility. The change in fertility is indicated on the monitor's liquid crystal display. The transition from low to high fertility is denoted by an increase in the number of solid bars on the display: one bar (Level I) for low fertility, two bars (Level II) for high fertility, and three bars (Level III) for maximum fertility. In addition, an oval-shaped symbol is displayed on maximum fertility days (14). In 2004, Fehring developed an algorithm with CPEFM for couples who, for serious reason, what to space out their pregnancies. It is based on a fertile window at -6 days in women's woman's regular menstrual cycles, considering the low probability of fertility during the first five days of the menstrual cycle. The likelihood of a woman being in the fertile window by the fifth day of the menstrual cycle is low (about 4%). As the fertile window approaches, Fehring recommends couples using CPEFM combine it with another fertility marker, such as cervical mucus, as a double-check method to verify the onset of the fertile period (56).
Persona is a handheld monitor that detects LH and E3G with reactive test sticks. It signals an initial period of preovulatory infertility from the first day of the cycle until the surge in E3G. Infertility also is shown at the post ovulation stage, after the LH surge (14). Persona uses detection of the urinary estrogen threshold to mark the onset of the fertile period. The end of the fertile period is determined as four days after the urinary LH threshold level is detected. These periods are illustrated by signal lights: "green" for infertile days and "red" for fertile days. A "yellow" light indicates the need for another test strip. In practice, Persona is recognized as effective for adequately detecting both the fertile period and the infertile period (57, 58, 59, 60).
Ultrasonic Assessment of Follicular Development as an Indicator of Growth, Selection, Recruitment and Follicular Maturity
When surrounded by layers of granulosa cells, the primary follicles become 0.1 mm preantral follicles when they acquire FSH and LH receptors. A preantral follicle takes about 25 days to reach antrum, when it measures roughly 0.4 mm, and around 60 days to reach preovulatory size, which is approximately 20 mm. The follicle destined to ovulate leaves the preantral reserve three cycles before reaching preovulatory size. Antral follicles from two to five mm in diameter have little sensitivity to gonadotropin stimulation. When the cycle begins, each ovary with normal characteristics has a similar aspect in terms of number; approximately eight follicles above three mm in average diameter. In follicles under 12 mm, it is valid to measure two diameters and to average them. If they are over 12 mm, three diameters can be measured. Ovulatory follicles are much rounder than atresic follicles and can be distinguished easily on the basis of average follicular diameter, which is an appropriate term for referring to the measurements of a follicle and for entering those measurements on follicular growth curves (61).
Follicular Recruitment: This term refers to follicular growth under the influence of gonadotropins and can be defined as the onset of growth in a cohort of follicles. Each woman has an individual FSH threshold, above which follicular recruitment occurs. The largest number of recruited follicles usually is produced between days three and eight of the cycle and, during this period, they grow at a rate of 0.5 to 1 mm per day in both ovaries, but fundamentally in the dominant ovary. During this period, it is possible to spot one to five follicles measuring four to eight mm (10).
Selection: The follicle that will ovulate is selected from among the recruited follicles. In natural selection cycles, the follicle destined to ovulate usually is selected towards days six and seven of the cycle. There may be other larger-sized follicles that are not selected for ovulation, and low FSH levels are usually what prompt the selection (11, 12, and 13).
Dominance: When a follicle takes over or governs the ovarian cycle, it provokes the withdrawal of the follicles that accompany it. This occurs by about the ninth day of the cycle and the mean diameter is usually 10 mm (62).
Growth of the Dominant Follicle and Follicular Maturity of the Preovulatory Follicle: The dominant follicle becomes spherical in shape, with a smooth inner surface, and the average echogenicity increases more quickly, at a rate of approximately 1.5 to 1.7 mm per day. The follicles under 9-10 mm become irregular and atresic. This phenomenon is more pronounced in the dominant ovary than in the contralateral one. The increase in estrogen levels becomes obvious and occurs parallel to follicular growth. The dominant follicle is in charge of the major production of estradiol. In turn, at the endometrial level, the influence of estrogen, such as growth of the endometrial line and the presence of the typical three-layered echographic pattern of the periovulatory phase, can be seen (11, 63).
Ultrasonic Signs of Maturity: Acceleration in follicular growth is an evident sign of follicular maturity and one that is easy to verify. Therefore, when a follicle reaches approximately 20 mm in size, it can be considered mature. The ovary is larger in volume, approximately 12 ml, at the expense of the preovulatory follicle. Generally speaking, a follicle roughly 19 to 20 mm in size will ovulate in 24-48 hours, on average (62). The cumulus oophors can be observed 36 hours prior to ovulation, and it may occasionally be detected as an eccentrically located, echogenic, 1 mm internal mural protusion. Occasionally, a double contour is evident. It usually appears from six to 10 hours after ovulation and occurs when the theca splits from the granulosa cell (61).
Presumption of Ovulation Based on an Ultrasonic
Diagnosis: Definition of ovulation: rupture of a follicle, releasing an ovocyte with a pellucid zone, corona radiata and a considerable number of cumulus cells. Appears 24-48 hours after the urinary LH surge.
Ultrasonic Signs of Ovulation: There are currently a number of ultrasonic indicators on which to base an ultrasonic diagnosis of ovulation. The first, when it can be documented, is the disappearance of a previously observed follicle or when its reduction in size, with flattening, is documented. There is no unanimous consensus on the release time. It can occur quickly, in one minute, or slowly during the course of an hour. According to Bajo Arenas, this is the most reliable sign of ovulation (61). Nevertheless, one cannot rule out the possibility that release may have occurred, but the egg remains trapped inside the follicle. A second ultrasonic sign is when the walls appear irregular and there are multiple echoes within the follicle. A third sign is the presence of fluid at the bottom of the Douglas pouch, and a fourth is the presence of a wave of luteal conversion.
Usually, it is not necessary to assess the corpus luteum in a spontaneous and normal cycle. However, cases of luteinized unruptured follicle syndrome (LUF) can be documented on the basis of the absence of a wave of luteal conversion (64).
COMMENTS
The estimated day of ovulation has been used to determine, retrospectively, the change from an infertile period to a fertile state. This method makes it possible to define the fertile window. It can be used in clinical practice and to detect the fertile period by means of the different methods documented already. Although the role of cervical mucus is well known, it currently is not used widely to identify the days when there is a high probability of conception and the days when fertility is poor (40, 65). In fact, many physicians now recommend ovulation-detection kits. However, the changes observed in cervical mucus at the vulva also can be used to identify the threshold of the fertile window and the end of the fertile period (66). This method has a well-established biological justification, seeing as estrogenic-dependent cervical mucus increases about 5-6 days prior to the day of ovulation (67). Most of the studies that compare the fertile window to cervical mucus to identify the fertile period detect a longer interval with cervical mucus, compared to the classical tools used by the American Society for Reproductive Medicine (24). Adlecreutz compared this interval to cervical mucus and found the cervical mucus overestimates the actual length of the sixday fertile period by an additional four days, on average. In his study, the fertile window was 10.49 days (SD = 3.56; median = 9 days) when estimated with cervical mucus, which is longer than the fertile period detected with E3G and urine LH monitoring. In this case, the length of the fertile period was 6.6 days (SD = 3.34; median = 6 days) (28). In others studies, the changes in the pattern throughout the cycle, both in quantity and type of cervical mucus, have been identified by observing the discharge of this mucus in the vagina (43, 48, 68). Estrogen-type mucus can be used not only as a marker of fertile days, but also to predict non-fertile secretion based on the absence of sufficient levels of estrogen-type mucus (69). There are various classifications of cervical mucus at the vulva. Scarpa proposes a four-point scale to classify vulvar secretion and to learn to identify estrogen-type mucus, which is has the best conductivity for sperm survival and transport. This method has the advantage of being non-invasive, and it is easy to implement with a minimal amount of training. There are several ways to classify cervical mucus. The most traditional method is the one described by Billings, which involves taking a cervical mucus sample at the vulva, then charting and interpreting it on a graph of the infertile or fertile characteristics. Other observation methods are the classifications described by Hilgers and Fehrning, which are based on the Billings clinical method involving sensation, appearance and consistency of cervical mucus. However, the subjective nature of the test could be the critical point in this method (66, 68).
If the threshold theory of ovulation works well, the bio-marker measurements possibly could indicate follicular development is occurring. In reality, there is no device to confirm this event in real time. Perhaps the more technical approach would be monitoring by means of a daily ultrasound examination. However, this is possible only in clinical practice. ClearPlan One Step and similar monitors might be useful for this purpose, but probably in combination with some other clinical test.
The correlation between plasma and urinary sex hormone measurements from day six prior to ovulation up until day one after ovulation is well documented. The starting point to detect the onset of the fertile period inside the fertile window has been defined as detection of the beginning of the surge in oestrone-3-glucuronide and the end point, as the second consecutive day at peak LH. This conclusion is based on normal cycles (24, 29). However, a good correlation also has been observed between the signals of the start and end of the fertile period in cycles of sub-fertile women with regular menstrual periods with no specific pathology and without hormone therapy (70). These clinical signs can be diagnosed through external signals, and these measurements can be used, in turn, to detect the window of fertility in the menstrual cycle of women with regular menstrual cycles, because the fertile window has a normal variability (24, 28, 29).
In women with normal spontaneous menstrual cycles, the FSH threshold level is probably constant. For this to be the case, a pull of antral follicles sensitive to the FSH threshold is needed if self-regulation in the hyphotalamic hypophysis-gonadal axis is to occur effectively and the necessary physiological changes in LH, estradiol, and progesterone hormones are to take place. However, it is important to remember that bleeding of gynecological origin can halt the normal course of the ovulation process and the regular menstrual pattern. There are different causes that can alter this situation, the most frequent being stress, perimenopause, poliquistic ovary syndrome (PCOS), hypothyroidism, hyperprolactinemia or treatments with gonadotropin-releasing hormone (GnRH) preparations, which can alter normal follicular development because of their long half-life. These are the most frequent cause of irregularities that interrupt the normal menstrual cycle. However, any other change in the regularity of the days of menstrual bleeding should be examined to rule out other causes of gynecological origin, such as the possibility of ovarian tumors, luteal phase pathology, or any other obstetric reason for irregular bleeding. A clinical diagnosis requires a simple, organic and functional evaluation, which now is available to most women.
According to what has been said, at length, about the process of normal follicular development, FSH concentration during the early follicular phase is of crucial importance. The surge of FSH levels in plasma above a specific threshold will trigger the entry of follicles into the rapid growth phase. And, the period of time during which the concentration of FSH is above the threshold level will determine the number of follicles that reach their final stage of maturation. It is essential that FSH levels quickly fall below the threshold, if follicular stimulation is to be limited to a single follicle. However, in normal menstrual cycles without pathology, even if the amount of FSH is reduced, some follicles that have been recruited already may continue to grow, despite the decline in FSH concentration, but ultimately only one follicle with achieve dominance.
Therefore, the concentration of FSH in plasma may be the most important factor in identifying the hormonal change in the fertile window and in detecting the trigger points of the fertile and infertile periods. To prove this theory, the variations in estradiol concentration have been tested in a number of studies in order to confirm the threshold hypothesis works well throughout the individual cycle (71, 72).
The more traditional devices to monitor this process in clinical practice are the ones that use highly sensitive hormone test kits that are easy to apply. The temporal relationship between a positive signal from a kit that predicts when ovulation will be possible and the rupture of the follicle has been studied in detail by Collins, 1996 (53). The time of a positive reading for follicular rupture ranged from 24 to 48 hrs. (average 32 hrs.). These results coincide perfectly with the outcome of the WHO studies (26, 52).
The advent of new technology such as specific hormone tests, serial measurements of estrogens, progesterone metabolites and the LH hormone, plus the new methods currently under investigation may be of help to eventually do a better job of diagnosing the fertile window in women (73, 74, 75, 76).
It is now possible to combine the signals, registration and calculation of fertility signs to improve prediction and detection of the fertile window. Combining resources could be interesting in terms of improving how the fertile window is approached. An individualized tactic to detect the fertile window also can be useful in some cases, in combination or with a selection of existing methods and markers (77).
CONCLUSION
Medicine currently counts on subjective and objective examinations so as to diagnose the highest and lowest fertility point. In addition, it is likely to keep track of the biological fertility factors which may eventually provide vital and reliable information regarding menstrual cycle. Follow -up examinations might come in useful for NaproTechnology (RNF) and also for some other focus groups interested in dealing with current theoretical resources stem from updated medical literature.
ACKNOWLEDGEMENT
The authors wish to thank all the volunteers who participated in the preparation of this manuscript.
References
1. Hilgers, Thomas W. The Medical & Surgical Practice of NaProTechnology. 1st ed. 6901 Mercy Road, Omaha, Nebraska, 68106, USA: Pope Paul VI Institute Press; July 2004.
2. Stanford JB, Parnell TA, Boyle PC. Outcomes from treatment of infertility with Natural Procreative Technology in an Irish general practice. J Am Board Fam Med 2008; (21):375-384.
3. Speroff L, Fritz MA. Chapter 6: Regulación del ciclo menstrual. In: Endocrinología ginecológica clínica y esterilidad. 7the ed. in English, 2006. 2nd ed. in Spanish. Lippincott Williams & Wilkins; 187-231.
4. Burger HG. Estradiol: The physiological basis of the fertile period. Int J Gynecol Obstet. 1999; (Suppl 1): 5-9.
5. Ben-Rafael Z, Levy T, Schoemaker J. Pharmacokinetics of follicle-stimulating hormone: Clinical significance. Fertil Steril. 1995; 63(4): 689-700.
6. Reichert LE Jr, Ward DN. On the isolation and characterization of the alpha and beta subunits of human pituitary folliclestimulating hormone. Endocrinology. 1974; (94): 655-64.
7. Rathnam P, Saxena BB. Primary aminoacid sequence of follicle-stimulating hormone from human pituitary glands. J Biol Chem. 1975 (17): 6735-42.
8. Galle P, Ulloa-Aguirre A, Chappel SC. Effects of estradiol phenobarbitone and LHRH upon the isoelectric focusing profile of pituitary follicle-stimulating hormone in an ovariectomized hamster. J Endocrinol. 1983; (99): 31- 40.
9. Wide L. Male and female forms of human follicle-stimulating hormone in plasma. J Clin Endocrinol Metab. 1982; (55): 682-8.
10. Gougeon A. Dynamics of follicular growth in the human: A model from preliminary results. Hum Reprod. 1986; (1): 81-7.
11. Brown JB. Pituitary control of ovarian function-concepts derived from gonadotropin therapy. Aust NZJ Obstet Gynaecol. 1978; (18): 47-54.
12. Van Weissenbruch MM, Schoemaker HC, Drexhage HA, Schoemaker J. Pharmaco-dynamics of human menopausal gonadotropin (hMG) and follicle-stimulating hormone (FSH). The importance of the FSH concentration in initiating follicular growth in polycystic ovary-like disease. Hum Reprod. 1993 ;(8): 813-21.
13. Zeleznik AJ, Kubik CJ. Ovarian responses in Macaques to pulsatile infusion of follicle-stimulating hormone (FSH) and luteinizing hormone: Increased sensitivity of the maturing follicle to FSH. Endocrinology 1986; 119: 2025-32.
14. Behre HM, Kuhlage J, Gassner C, Sonntag B, Schem C, Schneider HP, Nieschlag E. Prediction of ovulation by urinary hormone measurements with the home use ClearPlan Fertility Monitor: Comparison with transvaginal ultrasound scans and plasma hormone measurements. Hum Reprod 2000; 15 (12): 2478-82.
15. Barret JC, Marshall J. The risk of conception on different days of the menstrual cycle. Population Studies. 1969; (23): 455-461.
16. Schwartz D, Macdonald P.D.M., Heuchel V. Fecundability, coital frequency and the viability of the ova. Population Studies. 1980; 34(2): 397-400.
17. Royston JP. Basal body temperature, ovulation and the risk of conception, with special reference to the lifetimes of sperm and egg. Biometrics. 1982; 38(2): 397-406.
18. World Health Organization. A prospective multicentre trial of the ovulation method of natural family planning. III. Characteristics of the menstrual cycle and of the fertile phase. Fertil Steril. 1983; 40(6): 773-8.
19. Hilgers TW, Daly KD, Prebil AM, Hilgers SK. Cumulative pregnancy rates in patients with apparently normal fertility and fertility-focused intercourse. J Reprod Med. 1992; 37(10): 864-6.
20. Wilcox AJ, Weinberg CR, Baird DD. Timing of sexual intercourse in relation to ovulation. Effects on the probability of conception, survival of the pregnancy, and sex of the baby. N Engl J Med. 1995; 333 (23): 1517-21.
21. George N. Papanicolaou The sexual cycle in the human female as revealed by vaginal smear. American Journal of Anatomy. 1933; (52): 519-637.
22. Dóminguez A. Diagnóstico funcional de endometrio. Curso citodiagnóstico en ginecología. Mama y endometrio. Hospital Virgen del Camino. Unidad de Prevención y Diagnóstico Precoz. May. 1997.
23. Dunson DB, Baird DD, Wilcox CR. et al. Day-specific probabilities of clinical pregnancy based on two studies with imperfect measures of ovulation. Hum Reprod 1999; (4): 1835-1839.
24. Fehring RJ, Schneider M. Variability in the hormonally estimated fertile phase of the menstrual cycle. Fertil Steril 2008; 90 (4): 1232-5.
25. Collins WP. Review article. Hormonal indices of ovulation and the fertile period. Adv. Contracept 1985; (1): 279-94.
26. World Health Organization. Task force on methods for the determination of the fertile period. Temporal relationships between indices of fertile period. Fertil Steril 1983; (39): 647-655.
27. Tanabe KN, Susumu K, Hand K, Nishii I, et al. Prediction of the potentially fertile period by urinary hormone measurements using a new home-use monitor: Comparison with laboratory hormone analyses. Human Reproduction 2001; 16(8): 1619-1624.
28. Adlercreutz, H, Brown J, Collins W, et al. The measurement of urinary steroid glucuronides as indices of the fertile period in women. J Steroid Biochem 1982; (6): 695-702.
29. Fehring RJ, Schneider M, Raviele K. Variability in the Phases of the Menstrual Cycle. JOGNN Clinical Research 2006; 35: 376-384.
30. Ceric F, Silva D, Vigil P. Ultrastructure of the human periovulatory cervical mucus. Journal of Electron Microscopy 2005; 54(5):479-484.
31. Temprano H. Aplicaciones Clínicas de la ventana fértil en los ciclos ovulatorios. Curso Presymposium. Bases y Aplicaciones de la fertilidad humana. Indicadores de la fertilidad. Diagrama Odeblad. Nov. 18, 2010. IX Simposio Internacional de Conciencia de Fertilidad Humana. La Coruña. Spain.
32. Temprano, H. Estudio de los parámetros biofísicos del moco cervical humano e investigación de la cristalización con microscopía óptica y electrónica. Influencia de los inductores de la ovulación. (doctoral dissertation, Universidad Santiago de Compostela, 1990).
33. Elstein M. Cervical mucus: Its physiological role and clinical significance. Adv Exp Med Biol. 1982; (144): 301-18.
34. Mezger T. The Rheology Handbook. Hannover: Curt R. Vincent Verlag, 2002.
35. Elstein M. Functions and physical properties of mucus in the female genital tract. Br Med Bull 1978; (34):83-8.
36. Papanicolaou, GN. Some characteristic changes in the consistency of the uterine secretion. Department of Anatomy. Cornell University Medical College. Anatomical Record. 1935 (1).
37. Huhner, M. Sterility in Male-Female and its Treatment. 1913. New York: Redman Co.
38. Odeblad, E. Micro-NMR in high permanent magnetic fields. Acta Obstet. Gynec. Scand 1966; (45, Suppl 2): 126-139.
39. Odeblad E. The functional structure of human cervical mucus. Acta Obstet Gynecol Scand 1968; (47): 57-79.
40. Odeblad E. The biophysical aspects of cervical mucus. In: Jordan JA, Singer A, editors. The Cervix. London: WB Saunders; 1976: 45-58.
41. Odeblad E. et al. The biophysical properties of the cervical-vaginal secretions. Int.Rev. Natural Family Planning 1983; (7, 1): 1-56.
42. Odeblad E. The functional structure of human cervical mucus. Acta Obstet.Gynecol. Scand. 1968; (47, Suppl. 1): 58-79.
43. Alliende ME, Cabezón C, Figueroa H, Kottmann C. Cervico-vaginal fluid changes to detect ovulation accurately. American Journal of Obstetrics and Gynecology 2005; (193): 71-5.
44. Barbato M, Pandolfi A, Guida-M. A new diagnostic aid for natural family planning. Centro Ambrosiano Metodi Naturali, Milano, Italy. Adv-Contracept 1993; 9(4): 335-40.
45. Colombo B et al. Nadir of temperature the day of maximum fertility 42.9 %. Statistical Methods in Medical Research 2006; 15: 161-180.
46. Colombo B, Masarotto G. Daily Fecundability: First Results from a New Data Base. Demographic Research 2000; 3(3):5.
47. Stanford J. Fecundity and the mucus cycle score in couple using the CrMS. In: Hilgers T, ed. The Medical and Surgical Practice of NaProTechnology. Omaha: Pope Paul VI Institute Press; 2004:643-52.
48. Scarpa et al. Cervical mucus secretions on the day of intercourse: An accurate marker of highly fertile days. European Journal of Obstetrics & Gynecology and Reproductive Biology 2006; 125: 72-78.
49. Murcia JM, Esparza ML. Poster. Clinical applications of the fertile window in ovulatory cycles. November 18, 2010. IX International Symposium on Human Fertility Awareness. La Coruña. Spain.
50. Murcia JM, Esparza ML. Poster. Fertile Window in NaProTechnology and Natural Family Program. J.M. November 18, 2010. IX International Symposium on Human Fertility Awareness. La Coruña. Spain.
51. Romero H, T. Tecnologia de apoyo. Curso presymposium. Bases y aplicaciones del conocimiento de la fertilidad. Nov. 18, 2010. IX Simposio Internacional de Conciencia de Fertilidad Humana. La Coruña. Spain.
52. WHO Task Force on Methods for Determination of the Fertile Period. Temporal relationships between ovulation and defined changes in the concentration of plasma estradiol-17, luteinizing hormone, follicle stimulating hormone and progesterone. I. Probit analysis. Am. J. Obstet. Gynaecol. (1980a) (138): 383-390.
53. Collins WP. Indicators of potential fertility: Scientific principles. In: Bonnar, J, ed. Natural Conception through Personal Hormone Monitoring. New York, USA: Parthenon; 1996: 13-33.
54. Collins WP, Branch CM, Collins PO. 1981. Ovulation prediction and detection by the measurement of steroid glucuro-nides. In: Cortes-Prieto J, Campos de Paz A, and Neces-e--Castro M, eds. Research on Fertility and Sterility. Lancaster: MPT Ltd.; 1981:19-33.
55. Branch CM, Collins PO, and Collins WP. Ovulation prediction: Changes in the concentrations of urinary estrone-3-glucuronide, estradiol-17-glucuronide and estradiol-16-glucuronide during conceptional cycles. J. Steroid. Biochem. 1982; (16): 345-347.
56. Fehring R, Raviele K, Schneider M. A comparison of the fertile phase as determined by the Clearplan Easy Fertility Monitor and self-assessment of cervical mucus. Contraception 2004; 69:9 -14.
57. Crosignani PG, Rubin BL, Optimal use of infertility diagnostic tests and treatments. Hum Reprod 2000; 15: 723-32.
58. Guida M, Bramante S, Acunzo G, Pellicano M, Cirillo D, Nappi C. Diagnosis of fertility with a personal hormonal evaluation test. Minerva Ginecol. 2003; (55):167-73.
59. Janssen CJM, van Lunsen RHW. Profile and opinions of the female Persona® user in The Netherlands. Eur J Contracept Reprod Health Care. 2000; (5):141- 6.
60. May K. Monitoring reproductive hormones to detect the fertile period: Development of PersonaThe first home use system. Adv Contracept. 1997; (13):139-41.
61. Bajo J. Ultrasonografía y Reproducción. Ultrasonografía vaginal del ciclo ovárico. Crecimiento folicular. Chapter 2. Barcelona - Philadelphia: Prous Science 1996: 21-35
62. Callen, Peter W. Ultrasonography in obstetrics and gynecology. Sonographic Imaging in Infertility. Chapter 32. 4th Edition. Sounders Company; 2000: 897-911.
63. (SESEGO). Sección de ecografía de la Sociedad Española de Ginecología y Obstetricia. Ecografía práctica en obstetricia y ginecología. Ecografía en reproducción. Edita: Escuela Española de Ultrasonidos en Obstetricia y Ginecológia. Topic 45. 2004: 269-282.
64. Mercé, LT. Estudio ecográfico del ciclo ovárico normal. In: Mercé, L.T. (Ed.). Ecografía Doppler en obstetricia y ginecología. Madrid: Interamericana-McGraw-Hill 1993: 91-112.
65. Stanford JB, Thurman PB, Lemaire JC. Physicians' knowledge and practices regarding natural family planning. Obstet Gynecol 1999; 94: 672-7.
66. Billings EL, Billings JJ, Brown JB, Burger HG. Symptoms and hormonal changes accompanying ovulation. Lancet 1972; 1(7745): 282-4.
67. Katz DF, Slade DA, Nakajima ST. Analysis of pre-ovulatory changes in cervical mucus hydration and sperm penetrability. Adv Contracept 1997;13(2-3): 143-51.
68. Hilgers TW, Prebil AM. The ovulation method-vulvar observations as an index of fertility. Obstet Gynecol 1979; 53: 12-22.
69. Fehring RJ. Accuracy of the peak day of cervical mucus as a biological marker of fertility. Contraception 2002; 66: 231-5.
70. Keulers MJ, Hamilton CJCM, Franx A, Evers JLH, Bots RSGM. The length of the fertile window is associated with the chance of spontaneously conceiving an ongoing pregnancy in subfertile couples. Human Reproduction 2002; 22(6): 1652-1656.
71. Collins WP, Collins PO, Kilpatrick MJ, Manning PA, Pike JM, Tyler JP. The concentrations of urinary oestrone-3-glucuronide, LH and pregnanediol-3alpha-glucuronide as indices of ovarian function. Acta Endocrinol (Copenh) 1979; 90(2): 336-48.
72. Billings JJ. The validation of the Billings ovulation method by laboratory research and field trials. Acta Eur Fertil. 1991; 22(1): 9-15.
73. Fehring RJ. A comparison of the ovulation method with the CUE ovulation predictor in determining the fertile period. J Am Acad Nurse Pract. 1996; 8(10): 461-6.
74. Moreno JE, Khan-Dawood FS, Goldzieher JW. Natural family planning: Suitability of the CUE method for defining the time of ovulation. Contraception 1997; 55(4): 233-7.
75. Moreno JE, Weitzman GA, Doody MC, Gibbons WE, Besch P, Goldzieher JW. Temporal relation of ovulation to salivary and vaginal electrical resistance patterns: Implications for natural family planning. Contraception 1988; 38(4): 407-18.
76. Fernando RS, Regas J, Betz G. Ovulation prediction and detection with the CUE Ovulation Predictor. Hum Reprod 1988; 3(4): 419-24
77. Detection and Exploring the Left Shift Kurtosis of the Fertile Window in Ovulatory Cycles by Biophysical Biomarkers of the Cervical Secretion: Case Report. Jose María Murcia Lora, María Luisa Esparza Encina Poster 91 Female Reproduction Section I. Presented at 13th European Congress of Endocrinology 30 April - 4 May 2011, Rotterdam, The Netherlands (Endocrine Abstracts) Vol 26.
1. Hilgers, Thomas W. The Medical & Surgical Practice of NaProTechnology. 1st ed. 6901 Mercy Road, Omaha, Nebraska, 68106, USA: Pope Paul VI Institute Press; July 2004. [ Links ]
2. Stanford JB, Parnell TA, Boyle PC. Outcomes from treatment of infertility with Natural Procreative Technology in an Irish general practice. J Am Board Fam Med 2008; (21):375-384. [ Links ]
3. Speroff L, Fritz MA. Chapter 6: Regulación del ciclo menstrual. In: Endocrinología ginecológica clínica y esterilidad. 7the ed. in English, 2006. 2nd ed. in Spanish. Lippincott Williams & Wilkins; 187-231. [ Links ]
4. Burger HG. Estradiol: The physiological basis of the fertile period. Int J Gynecol Obstet. 1999; (Suppl 1): 5-9. [ Links ]
5. Ben-Rafael Z, Levy T, Schoemaker J. Pharmacokinetics of follicle-stimulating hormone: Clinical significance. Fertil Steril. 1995; 63(4): 689-700. [ Links ]
6. Reichert LE Jr, Ward DN. On the isolation and characterization of the alpha and beta subunits of human pituitary folliclestimulating hormone. Endocrinology. 1974; (94): 655-64. [ Links ]
7. Rathnam P, Saxena BB. Primary aminoacid sequence of follicle-stimulating hormone from human pituitary glands. J Biol Chem. 1975 (17): 6735-42. [ Links ]
8. Galle P, Ulloa-Aguirre A, Chappel SC. Effects of estradiol phenobarbitone and LHRH upon the isoelectric focusing profile of pituitary follicle-stimulating hormone in an ovariectomized hamster. J Endocrinol. 1983; (99): 31- 40. [ Links ]
9. Wide L. Male and female forms of human follicle-stimulating hormone in plasma. J Clin Endocrinol Metab. 1982; (55): 682-8. [ Links ]
10. Gougeon A. Dynamics of follicular growth in the human: A model from preliminary results. Hum Reprod. 1986; (1): 81-7. [ Links ]
11. Brown JB. Pituitary control of ovarian function-concepts derived from gonadotropin therapy. Aust NZJ Obstet Gynaecol. 1978; (18): 47-54. [ Links ]
12. Van Weissenbruch MM, Schoemaker HC, Drexhage HA, Schoemaker J. Pharmaco-dynamics of human menopausal gonadotropin (hMG) and follicle-stimulating hormone (FSH). The importance of the FSH concentration in initiating follicular growth in polycystic ovary-like disease. Hum Reprod. 1993; (8): 813-21. [ Links ]
13. Zeleznik AJ, Kubik CJ. Ovarian responses in Macaques to pulsatile infusion of follicle-stimulating hormone (FSH) and luteinizing hormone: Increased sensitivity of the maturing follicle to FSH. Endocrinology 1986; 119: 2025-32. [ Links ]
14. Behre HM, Kuhlage J, Gassner C, Sonntag B, Schem C, Schneider HP, Nieschlag E. Prediction of ovulation by urinary hormone measurements with the home use ClearPlan Fertility Monitor: Comparison with transvaginal ultrasound scans and plasma hormone measurements. Hum Reprod 2000; 15 (12): 2478-82. [ Links ]
15. Barret JC, Marshall J. The risk of conception on different days of the menstrual cycle. Population Studies. 1969; (23): 455-461. [ Links ]
16. Schwartz D, Macdonald P.D.M., Heuchel V. Fecundability, coital frequency and the viability of the ova. Population Studies. 1980; 34(2): 397-400. [ Links ]
17. Royston JP. Basal body temperature, ovulation and the risk of conception, with special reference to the lifetimes of sperm and egg. Biometrics. 1982; 38(2): 397-406. [ Links ]
18. World Health Organization. A prospective multicentre trial of the ovulation method of natural family planning. III. Characteristics of the menstrual cycle and of the fertile phase. Fertil Steril. 1983; 40(6): 773-8. [ Links ]
19. Hilgers TW, Daly KD, Prebil AM, Hilgers SK. Cumulative pregnancy rates in patients with apparently normal fertility and fertility-focused intercourse. J Reprod Med. 1992; 37(10): 864-6. [ Links ]
20. Wilcox AJ, Weinberg CR, Baird DD. Timing of sexual intercourse in relation to ovulation. Effects on the probability of conception, survival of the pregnancy, and sex of the baby. N Engl J Med. 1995; 333 (23): 1517-21. [ Links ]
21. George N. Papanicolaou The sexual cycle in the human female as revealed by vaginal smear. American Journal of Anatomy. 1933; (52): 519-637. [ Links ]
22. Dóminguez A. Diagnóstico funcional de endometrio. Curso citodiagnóstico en ginecología. Mama y endometrio. Hospital Virgen del Camino. Unidad de Prevención y Diagnóstico Precoz. May. 1997. [ Links ]
23. Dunson DB, Baird DD, Wilcox CR. et al. Day-specific probabilities of clinical pregnancy based on two studies with imperfect measures of ovulation. Hum Reprod 1999; (4): 1835-1839. [ Links ]
24. Fehring RJ, Schneider M. Variability in the hormonally estimated fertile phase of the menstrual cycle. Fertil Steril 2008; 90 (4): 1232-5. [ Links ]
25. Collins WP. Review article. Hormonal indices of ovulation and the fertile period. Adv. Contracept 1985; (1): 279-94. [ Links ]
26. World Health Organization. Task force on methods for the determination of the fertile period. Temporal relationships between indices of fertile period. Fertil Steril 1983; (39): 647-655. [ Links ]
27. Tanabe KN, Susumu K, Hand K, Nishii I, et al. Prediction of the potentially fertile period by urinary hormone measurements using a new home-use monitor: Comparison with laboratory hormone analyses. Human Reproduction 2001; 16(8): 1619-1624. [ Links ]
28. Adlercreutz, H, Brown J, Collins W, et al. The measurement of urinary steroid glucuronides as indices of the fertile period in women. J Steroid Biochem 1982; (6): 695-702. [ Links ]
29. Fehring RJ, Schneider M, Raviele K. Variability in the Phases of the Menstrual Cycle. JOGNN Clinical Research 2006; 35: 376-384. [ Links ]
30. Ceric F, Silva D, Vigil P. Ultrastructure of the human periovulatory cervical mucus. Journal of Electron Microscopy 2005; 54(5):479-484. [ Links ]
31. Temprano H. Aplicaciones Clínicas de la ventana fértil en los ciclos ovulatorios. Curso Presymposium. Bases y Aplicaciones de la fertilidad humana. Indicadores de la fertilidad. Diagrama Odeblad. Nov. 18, 2010. IX Simposio Internacional de Conciencia de Fertilidad Humana. La Coruña. Spain. [ Links ]
32. Temprano, H. Estudio de los parámetros biofísicos del moco cervical humano e investigación de la cristalización con microscopía óptica y electrónica. Influencia de los inductores de la ovulación. (doctoral dissertation, Universidad Santiago de Compostela, 1990). [ Links ]
33. Elstein M. Cervical mucus: Its physiological role and clinical significance. Adv Exp Med Biol. 1982; (144): 301-18. [ Links ]
34. Mezger T. The Rheology Handbook. Hannover: Curt R. Vincent Verlag, 2002. [ Links ]
35. Elstein M. Functions and physical properties of mucus in the female genital tract. Br Med Bull 1978; (34):83-8. [ Links ]
36. Papanicolaou, GN. Some characteristic changes in the consistency of the uterine secretion. Department of Anatomy. Cornell University Medical College. Anatomical Record. 1935 (1). [ Links ]
37. Huhner, M. Sterility in Male-Female and its Treatment. 1913. New York: Redman Co. [ Links ]
38. Odeblad, E. Micro-NMR in high permanent magnetic fields. Acta Obstet. Gynec. Scand 1966; (45, Suppl 2): 126-139. [ Links ]
39. Odeblad E. The functional structure of human cervical mucus. Acta Obstet Gynecol Scand 1968; (47): 57-79. [ Links ]
40. Odeblad E. The biophysical aspects of cervical mucus. In: Jordan JA, Singer A, editors. The Cervix. London: WB Saunders; 1976: 45-58. [ Links ]
41. Odeblad E. et al. The biophysical properties of the cervical-vaginal secretions. Int. Rev. Natural Family Planning 1983; (7, 1): 1-56. [ Links ]
42. Odeblad E. The functional structure of human cervical mucus. Acta Obstet. Gynecol. Scand. 1968; (47, Suppl. 1): 58-79. [ Links ]
43. Alliende ME, Cabezón C, Figueroa H, Kottmann C. Cervicovaginal fluid changes to detect ovulation accurately. American Journal of Obstetrics and Gynecology 2005; (193): 71-5. [ Links ]
44. Barbato M, Pandolfi A, Guida-M. A new diagnostic aid for natural family planning. Centro Ambrosiano Metodi Naturali, Milano, Italy. Adv-Contracept 1993; 9(4): 335-40. [ Links ]
45. Colombo B et al. Nadir of temperature the day of maximum fertility 42.9 %. Statistical Methods in Medical Research 2006; 15: 161-180. [ Links ]
46. Colombo B, Masarotto G. Daily Fecundability: First Results from a New Data Base. Demographic Research 2000; 3(3):5. [ Links ]
47. Stanford J. Fecundity and the mucus cycle score in couple using the CrMS. In: Hilgers T, ed. The Medical and Surgical Practice of NaProTechnology. Omaha: Pope Paul VI Institute Press; 2004: 643-52. [ Links ]
48. Scarpa et al. Cervical mucus secretions on the day of intercourse: An accurate marker of highly fertile days. European Journal of Obstetrics & Gynecology and Reproductive Biology 2006; 125: 72-78. [ Links ]
49. Murcia JM, Esparza ML. Poster. Clinical applications of the fertile window in ovulatory cycles. November 18, 2010. IX International Symposium on Human Fertility Awareness. La Coruña. Spain. [ Links ]
50. Murcia JM, Esparza ML. Poster. Fertile Window in NaProTechnology and Natural Family Program. J.M. November 18, 2010. IX International Symposium on Human Fertility Awareness. La Coruña. Spain. [ Links ]
51. Romero H, T. Tecnología de apoyo. Curso presymposium. Bases y aplicaciones del conocimiento de la fertilidad. Nov. 18, 2010. IX Simposio Internacional de Conciencia de Fertilidad Humana. La Coruña. Spain. [ Links ]
52. WHO Task Force on Methods for Determination of the Fertile Period. Temporal relationships between ovulation and defined changes in the concentration of plasma estradiol-17, luteinizing hormone, follicle stimulating hormone and progesterone. I. Probit analysis. Am. J. Obstet. Gynaecol. (1980a) (138): 383-390. [ Links ]
53. Collins WP. Indicators of potential fertility: Scientific principles. In: Bonnar, J, ed. Natural Conception through Personal Hormone Monitoring. New York, USA: Parthenon; 1996: 13-33. [ Links ]
54. Collins WP, Branch CM, Collins PO. 1981. Ovulation prediction and detection by the measurement of steroid glucuronides. In: Cortes-Prieto J, Campos de Paz A, and Neces-e--Castro M, eds. Research on Fertility and Sterility. Lancaster: MPT Ltd.; 1981:19-33. [ Links ]
55. Branch CM, Collins PO, and Collins WP. Ovulation prediction: Changes in the concentrations of urinary estrone-3-glucuronide, estradiol-17-glucuronide and estradiol-16-glucuronide during conceptional cycles. J. Steroid. Biochem. 1982; (16): 345-347. [ Links ]
56. Fehring R, Raviele K, Schneider M. A comparison of the fertile phase as determined by the Clearplan Easy Fertility Monitor and self-assessment of cervical mucus. Contraception 2004; 69:9 -14. [ Links ]
57. Crosignani PG, Rubin BL, Optimal use of infertility diagnostic tests and treatments. Hum Reprod 2000; 15: 723-32. [ Links ]
58. Guida M, Bramante S, Acunzo G, Pellicano M, Cirillo D, Nappi C. Diagnosis of fertility with a personal hormonal evaluation test. Minerva Ginecol. 2003; (55):167-73. [ Links ]
59. Janssen CJM, van Lunsen RHW. Profile and opinions of the female Persona® user in The Netherlands. Eur J Contracept Reprod Health Care. 2000; (5):141- 6. [ Links ]
60. May K. Monitoring reproductive hormones to detect the fertile period: Development of PersonaThe first home use system. Adv Contracept. 1997; (13):139-41. [ Links ]
61. Bajo J. Ultrasonografía y Reproducción. Ultrasonografía vaginal del ciclo ovárico. Crecimiento folicular. Chapter 2. Barcelona - Philadelphia: Prous Science 1996: 21-35 [ Links ]
62. Callen, Peter W. Ultrasonography in obstetrics and gynecology. Sonographic Imaging in Infertility. Chapter 32. 4th Edition. Sounders Company; 2000: 897-911. [ Links ]
63. (SESEGO). Sección de ecografía de la Sociedad Española de Ginecología y Obstetricia. Ecografía práctica en obstetricia y ginecología. Ecografía en reproducción. Edita: Escuela Española de Ultrasonidos en Obstetricia y Ginecológia. Topic 45. 2004: 269-282. [ Links ]
64. Mercé, LT. Estudio ecográfico del ciclo ovárico normal. In: Mercé, L.T. (Ed.). Ecografía Doppler en obstetricia y ginecología. Madrid: Interamericana-McGraw-Hill 1993: 91-112. [ Links ]
65. Stanford JB, Thurman PB, Lemaire JC. Physicians' knowledge and practices regarding natural family planning. Obstet Gynecol 1999; 94: 672-7. [ Links ]
66. Billings EL, Billings JJ, Brown JB, Burger HG. Symptoms and hormonal changes accompanying ovulation. Lancet 1972; 1(7745): 282-4. [ Links ]
67. Katz DF, Slade DA, Nakajima ST. Analysis of pre-ovulatory changes in cervical mucus hydration and sperm penetrability. Adv Contracept 1997; 13(2-3): 143-51. [ Links ]
68. Hilgers TW, Prebil AM. The ovulation method-vulvar observations as an index of fertility. Obstet Gynecol 1979; 53: 12-22. [ Links ]
69. Fehring RJ. Accuracy of the peak day of cervical mucus as a biological marker of fertility. Contraception 2002; 66: 231-5. [ Links ]
70. Keulers MJ, Hamilton CJCM, Franx A, Evers JLH, Bots RSGM. The length of the fertile window is associated with the chance of spontaneously conceiving an ongoing pregnancy in subfertile couples. Human Reproduction 2002; 22(6): 1652-1656. [ Links ]
71. Collins WP, Collins PO, Kilpatrick MJ, Manning PA, Pike JM, Tyler JP. The concentrations of urinary oestrone-3-glucuronide, LH and pregnanediol-3alpha-glucuronide as indices of ovarian function. Acta Endocrinol (Copenh) 1979; 90(2): 336-48. [ Links ]
72. Billings JJ. The validation of the Billings ovulation method by laboratory research and field trials. Acta Eur Fertil. 1991; 22(1): 9-15. [ Links ]
73. Fehring RJ. A comparison of the ovulation method with the CUE ovulation predictor in determining the fertile period. J Am Acad Nurse Pract. 1996; 8(10): 461-6. [ Links ]
74. Moreno JE, Khan-Dawood FS, Goldzieher JW. Natural family planning: Suitability of the CUE method for defining the time of ovulation. Contraception 1997; 55(4): 233-7. [ Links ]
75. Moreno JE, Weitzman GA, Doody MC, Gibbons WE, Besch P, Goldzieher JW. Temporal relation of ovulation to salivary and vaginal electrical resistance patterns: Implications for natural family planning. Contraception 1988; 38(4): 407-18. [ Links ]
76. Fernando RS, Regas J, Betz G. Ovulation prediction and detection with the CUE Ovulation Predictor. Hum Reprod 1988; 3(4): 419-24 [ Links ]
77. Jose María Murcia Lora, María Luisa Esparza Encina Detection and Exploring the Left Shift Kurtosis of the Fertile Window in Ovulatory Cycles by Biophysical Biomarkers of the Cervical Secretion: Case Report. Poster 91 Female Reproduction Section I. Presented at 13th European Congress of Endocrinology 30 April - 4 May 2011, Rotterdam, The Netherlands (Endocrine Abstracts) Vol 26. [ Links ]
