


 Inglês (pdf)
 Artigo em XML
 Referências do artigo
 Enviar este artigo por email
 Citado por SciELO
  Citado por Google
  Similares em
SciELO
Similares em
SciELO  Similares em Google
 Permalink
INTRODUCTION
Snakebite is a public health problem in Colombia with approximately 5,000 cases/year at a rate of 10.2 / 10,000 and a mortality rate of around 1%. Two of the nine families that can be found in Colombia are venomous (Minambiente, 2013). The Viperidae family is the cause of 65% of snakebite poisoning (Instituto Nacional de Salud, 2018); therefore, it is considered the most aggressive and includes the genus Bothrops sp, Crotalus sp, and Lachesis sp. Bothrops sp known in Spanish-speaking countries as mapaná, equis, pudridora, cuatronarices, jergón, among others; however, a possible factor of confusion in snake identification of the local population, is reflected in the names; for example, Bothrops atrox and Lachesis muta which receive the same popular name surucucu in certain Amazon areas. Crotalus sp is mainly known as cascabel in Colombia. Bothrocophias myersi is a recently discovered snake from this family with six species (Salazar Valenzuela et al., 2014); it is known as cabeza de lanza, cachetona or bufadora, and its geographical distribution includes the biogeographic area of Chocó, the surroundings of the Andes Cordillera, and the upper Amazon basin.
The composition of the venoms is very important to know the clinical syndrome of snakebite poisoning. Venom proteins generate specific characteristics on physiopathology and treatment. Most of the venom profiles belonging to the Viperidae snakes have already been identified; however, the venom profile of B. myersi has not been sufficiently characterized and its clinical relevance has not been determined. The aim of this research was to compare the protein composition of the most aggressive snake venoms of the Viperidae family in Colombia, to know the first approximation of the Bothrocophias myersi venom, and to elucidate the clinical importance and relevance for antivenom production.
MATERIALS AND METHODS
The absorbance of 280nm by the Nanodrop®, RP-HPLC, and Sodium Dodecyl Sulfate-Polyacrylamide Gel Electrophoresis (SDS-PAGE) methods was adjusted according to the guidelines of the Instrumental Analysis laboratory from the Instituto de Biotecnología from the Universidad Nacional de Colombia (IBUN).
Origin and quantification of venoms
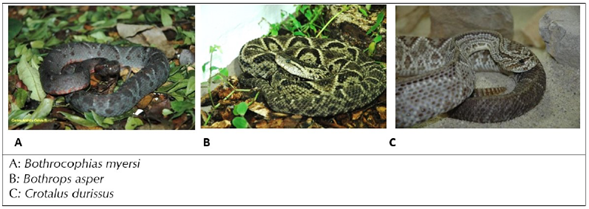
The venom pool was obtained for each species from adult specimens from the Department of Valle del Cauca, Colombia (Figure 1). Two females of B. myersi, two females of Crotalus durissus, and one female of Bothrops asper were used. The venoms were obtained under an agreement between Fundación Zoológica de Cali (FZC) and Universidad Nacional de Colombia (UN). The venoms were manually extracted; the pools were lyophilized, and then stored at -20°C. The snakes were maintained at the serpertarium of FZC under the guidance of the World Health Organization (WHO) Annex 5, (WHO, 2017). Different amounts of each pool were weighed as needed and dissolved in sterile water. Protein quantification was performed using absorbance 280nm by Nanodrop.
SDS-PAGE
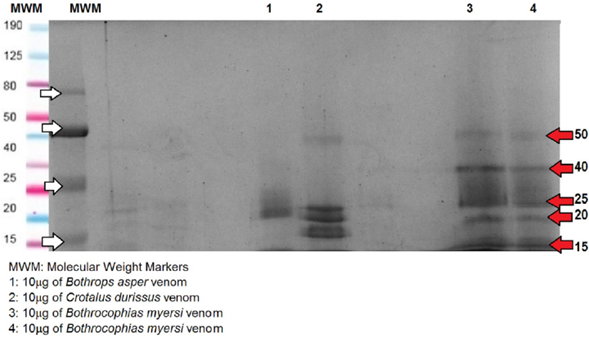
After the venom protein quantification by absorbance 280nm by direct measurement with Nanodrop®, ten micrograms (μg) of each of the crude venoms were diluted in 5μl loading buffer under reduced conditions (B-mercaptoethanol, 2-ME). 8%, 12%, and 15% SDS-polyacrylamide gels were run to observe the proteins and better visualization was found with the 8% gel, (Lomonte, 2007). Estimation of molecular weight was determined by comparing the protein bands of each venom with pertained broad range protein markers (10-190 kDa). A continuous flow of 100v was established for one hour for each of the electrophoretic gels. The gels were stained with Coomassie Brilliant R-250; thereafter, the Coomassie gel images were recorded using ImageLab (Bio-Rad). The SDS-PAGE was performed twice for each venom.
RP-HPLC
The crude venom of the three samples was fractioned using a C18 column (Lichosper 100 RP-C18 250 x 4mm, particle size: 5μm) by means of reverse-phase HPLC, stabilized with H2O + 0.1% trifluoroacetic acid (TFA). The solutions were: 0.1% of TFA in water (Solution A) and acetonitrile (solution B), (Esquivel, 2004), adjusted to the LIA protocol. Elution was performed at 0.2ml/min by applying a linear gradient towards solution B (acetonitrile (CH3CN) + 0.1% TFA during 180min) as follows: 5% B for ten minutes followed by 5-15% of B for 20 minutes, 15-45% of B for 120 min, and 45-70% of B for 20 min. HPLC was run for 180 min in a linear gradient of 5-75% solvent B (95% acetonitrile concentration 0.1% trifluoroacetic acid (TFA) with solvent A (5% acetonitrile 0.1% TFA) as starting and equilibration eluent; the flow rate of the column evaluated was set at 1 Ml/min and monitored at UV215.
RESULTS AND DISCUSSION
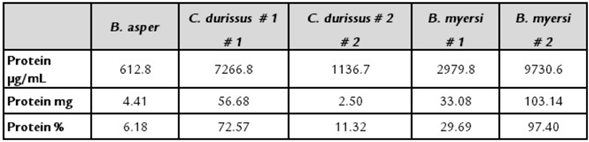
Table 1 displays the percentage of protein found in the venom of the five snakes. Data revealed that B. myersi obtained the highest protein concentration, whereas B. asper obtained the lowest protein concentration, regardless of the method.
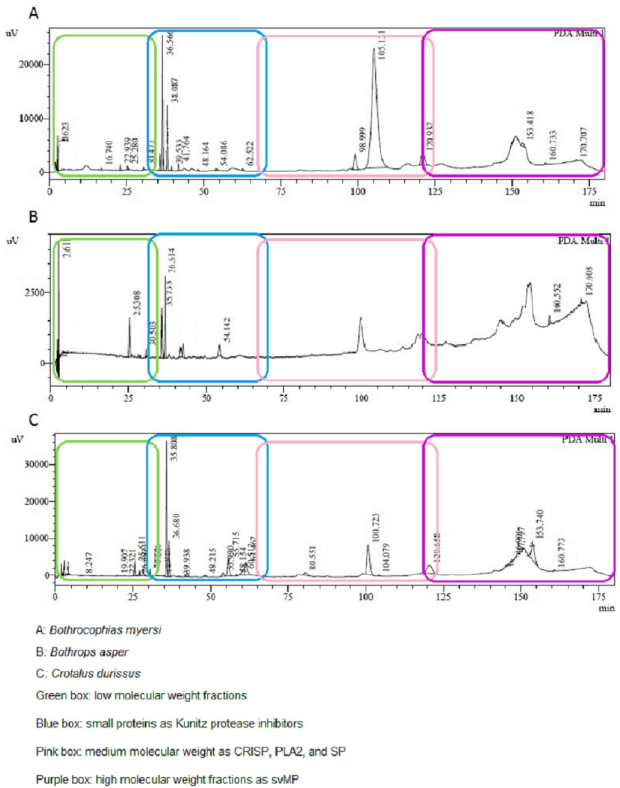
Considering the protein concentration by Nanodrop, SDS-PAGE (Figure 2) and RP-HPLC (Figure 3) techniques were performed to compare the venom profiles of the snakes. A considerable number of journals on snake venom have used the same chromatographic conditions as in this study. Many authors (Núñez, 2009), (Calvete, 2011), (Lomonte, 2017) have described the chromatogram of the main snake venoms of the Viperidae family, showing peaks between 10 and 25 min corresponding to high polarity compounds, low molecular weight fractions (LMWF), and nucleotides (Green box, Figure 3); small proteins such as Kunitz protease inhibitors between 50 and 60 min (Blue box, Figure 3); medium molecular weight (MMWF) fractions such as CRISP, PLA2, and SP, between 100 and 140 min (pink box, Figure 3); while high molecular weight (HMWF) fractions and more hydrophobic proteins, such as svMP between 140 and 180 min (Purple box, Figure 3).
Bothrops asper results
The SDS-PAGE of B. asper showed four to six bands in two groups; first around 15-20 KDa and second around 40-50 KDa. Different authors, (Leon et al., 2011), (Angulo and Lomonte, 2009), (Alape Girón et al., 2009), have shown similar results regarding the composition of B. asper venom, revealing proteins belonging to at least eight protein families. Some of the proteins were svMP, PLA2, SP, LAAO, desintegrins, CTL, CRISP, and DC-fragments (Alape Girón et al., 2009), Quintana Castillo et al. (2018), Fernández et al. (2010). According to Sanhajariya et al. (2018), and Angulo and Lomonte (2009), the venom proteins found in the snakes of the Viperidae family show a group of protein bands in the range of 10 to 63 KDa that may correspond to a certain protein family. In that respect, the bands which are less than 10 KDa may correspond to disintegrin; the bands from 11 to 15 KDa may correspond to phospholipase A2 (PLA2); the band of 20 KDa may correspond to metallo-proteinase I (svMP); the band of 25 KDa would match myotoxins or Cysteine-Rich Secretory Protein (CRISP); the band of 30 KDa may match Serine Proteinase (SP); the band of 45 KDa would match svMP II; the band of 50 kDa may match svMP III; and the bands around 63 KDa may correspond to L-amino acid oxidase (LAAO). In agreement with the above, B. asper showed bands of svMP I, CRISP, and myotoxins. Similar results were found regarding the electrophoretic profile of the venom of B. asper (Niño, 2018). Bands were found between 13 and 15 KDa possibly indicating PLA2; bands around 20 KDa which can be attributed to svMP I; bands around 30 KDa which may correspond to CTL or SP; and bands between 42 and 50 KDa which may correspond to svMP III, in accordance with results obtained previously (León, 2011). LMWF of proteins as disintegrin was not evidenced in the electrophoretic profile.
The chromatographic profile of the venom of B. asper also showed similar protein compounds compared with another author (Niño, 2018). The first fraction of Niño's chromatogram and ours were very similar because they showed LMWF around 40 min, and also minutes later all venoms showed peaks around 110 min and between 140 and 160 min. Regarding the abundance or height of the peaks, Niño (2018) found that the highest peak for B. asper was around 1500 mAU at 40 min, followed by 1000 mAU around 100 min, while we found the highest peak at 3000 mAU around 40 min, followed by 2500 mAU at 150 min, similar to what was observed in other studies (León, 2011).
3.2 Crotalus durissus results
The SDS-PAGE of C. durissus showed approximately five bands of 10, 15, 20, 40, and 50 KDa. The venom of C. durissus shows an electrophoretic profile with slight intensity bands corresponding to svMP II and bands with greater intensity corresponding to svMP I and PLA2, similar to the proteins of the venom of Crotalus found by Calvete et al. (2010). C. durissus showed bands between 15 and 18 kDa which may correspond to PLA2 (greater intensity) and svMP (slight intensity) in agreement with authors (Niño, 2018). Regarding the chromatographic profile, C. durissus showed 26 peaks, in agreement with different research (Niño, 2018), that compared profiles of C. durissus from different localities of Colombia and found that the LMWF which may correspond to the peaks of the first 40 minutes were not shown in the electrophoretic profile. Additionally, we found similar results with another author (Boldrini, et al., 2010), with peaks between 100 and 144 min and bands between 15 and 18 kDa which may correspond to PLA2; peaks between 144 and 175 min and bands around 25 kDa for SP; bands around 21 KDa for CRISP; bands around 38 KDa for CTL; and, bands between 50 and 70 KDa for svMP III. Unlike those results, we did not find peaks between 60 and 82 min and bands under 10 KDa which may correspond to disintegrin; and neither bands between 160 - 220 KDa which may correspond to LAAO. Calvete et al. (2010), found high levels of svMP in the venom of C. durissus cumanensis, while they found low levels of svMP in the venoms of C. durissus terrificus, ruruima, and durissus; Also, they found that the quantity of neurotox-ins like crotoxin and crotamine is directly related with lethal activity, but lethality and svMP activity show an inverse relationship in the venoms of C. simus and C. durissus. We couldn't visualize the band corresponding to girotoxin which should be around 30 KDa; besides, crotamine was not displayed which should be between 5 and 10 KDa under reducing conditions. This result is in agreement with some studies conducted with C. durissus terrificus where it was discovered that not all individuals of this species have crotamine; it is known as "positive crotamine" and "negative crotamine" according to the presence of this protein (De Oliveira et al., 2015) and (Oguiura, 2009).
Bothrocophias myersi results
The SDS-PAGE analysis of B. myersi showed an electro-phoretic profile with five to seven bands between 15 and 20 KDa bands, 50 and 80 KDa bands under reducing conditions. (Lozano González, 2014) showed similar results; they obtained bands that match with the 14 kDa molecular weight marker, indicating that at least one PLA2 is present in the venom of B. myersi. Also, Pereañez et al. (2020), found protein bands between 25 and 75 KDa, and showed that the most abundant protein family was PLA2 followed by svMP and SP. Comparing with the venom of B. campbelli,Salazar et al. (2014) found protein bands between 10 and 60 KDa, in which 3 types of proteins predominate corresponding to PLA2 between 14 and 25 KDa, SP and svMP, those two around 30 to 50 KDa. 16 peaks were collected in the chromatography profile of B. myersi venom, most of them in the fractions between 20 and 40 min in which we found compounds of LMWF, and peaks of MMWF between 100 and 130 min which may correspond to PLA2, SP, and, in a lower concentration SVMP, possibly HMWF (Figure 3-A); those results are similar to many authors including Salazar et al. (2014) and Pereañez et al. (2020). They obtained 20 and 40 peaks in the chromatograms of the venoms of B. campbelli and B. myersi correspondingly. These studies confirm that PLA2 and svMP are the most abundant protein family in the venom of B. myersi.Pereañez et al. (2020) showed that the content of PLA2 in the venom of B. myersi is higher than in some venoms of Bothrops species, like Bothrops punctatus, Bothrops atrox from Colombia, Peru and Brazil, Bothrops barnetti and Bothrops pictus from Peru, Bothrops asper from Costa Rica and Bothrops pauloensis. That high content of myotoxic PLA2 in the venom of B. myersi can be related to biological in vivo activities like proteolytic activities, myotoxic potency, and a rapid and strong edema-forming activity.
The SDS-PAGE of B. asper showed four to six bands in two groups; one around 15-20 KDa and the other around 40-50 KDa; C. durissus showed approximately five bands of 10, 15, 20, 40, and 50 KDa; finally, B. myersi exhibited five bands of 15, 20, 50 and 80 KDa, all under reduced conditions. The RP-HPLC yielded at least 30 peaks for the venom of B. asper, showed high polarity compounds and LMWF between 20 and 40 min; it also showed peaks between 100 and 130 min which may correspond to MMWF as CRISP, PLA2, or SP; and peaks between 140 and 175 min that may correspond to HMWF as svMP, but at different proportions. The chromatogram of the venom of C. durissus showed LMWF between 20 and 40 min; small peaks between 50 and 60 min as Kunitz protease inhibitors; peaks between 100 and 130 min which may correspond to PLA2; and peaks between 140 and 175 that may correspond to svMP, SP, CRISP, and C-type lectin (CTL). Characteristically, the venom of B. myersi was similar to the venom of B. asper showing the highest peak around 100 min, the venom of B. asper showed more and higher peaks between 150 and 180 min, possibly corresponding to svMP.
Therefore, the venom of B. asper showed a greater presence of possible PLA2 and svMP which coincides with the one reported by another research and the hemorrhagic action. The presumed presence of PLA2, and possibly the presence of svMP, SP, CRISP, and CTL in the venom of C. durissus are the main causes of vascular damage and necrosis as reported in the literature. Finally, the higher presence of PLA2 in the venom of B. myersi matches with the reports in other studies for the venom of this species and for a species of the same genus. The importance of the presence of these proteins in relation to the biological and enzymatic activities of the venom is highlighted.
The hydrophobicity was correlated with the size of the protein by RP-HPLC and SDS-PAGE; thus, the protein fractions which present low hydrophobicity match with proteins that present low molecular masses, like disintegrins; whereas the protein fractions which present high hydrophobicity matches with proteins that present HMWF like svMP. The process of separating the venom proteins by RP-HPLC and SDS-PAGE required significant manual work, but it is relevant because the combination of these methods allowed to establish differences in the protein profile of the venoms; and therefore, these profiles can be included as part of their characterization.

