


 English (pdf)
 Article in xml format
 Article references
 Send this article by e-mail
 Cited by SciELO
  Cited by Google
  Similars in
SciELO
Similars in
SciELO  Similars in Google
 Permalink
1. Introduction
According to the World Bank (2018), more than 50% of the world's population lives in cities or urban environments, exceeding 75% in most European and American countries. Furthermore, projections indicate that by 2050 it will be 68% of the world population (United Nations, 2018). Thereby, the rural exodus has led to the creation of numerous peripheral neighbourhoods in an uncontrolled manner, thus increasing inequality and poverty among their inhabitants (Ayala, 2008).
Major international institutions are trying to raise awareness regarding urban inequality and vulnerability. The United Nations, in the Sustainable Development Goals (SDGS), includes in goal number 11 the conflicts related to urban areas. The following points are highlighted for their relation to urban vulnerability: access to housing, basic services, and transport infrastructure for all people, with special attention to those in vulnerable situations (United Nations, 2017). Additionally, numerous authors, such as Arias (2014), stress the need to improve the habitability of cities through criteria of equity, social and environmental efficiency and, in turn, by regulating private activity.
Nevertheless, there is no common agreement on how to define or quantify vulnerability (Brooks, 2003; Adger, 2006; Birkmann, 2006; Sánchez and Egea, 2011; Lampis, 2013). Depending on the approach they take, different elements and nuances arise (Egea et al., 2012).
This paper focuses on socio-environmental vulnerability, which is understood as the physical, economic, political or social fragility that implies a potential risk for the population. The risk can be created by external phenomena, both of natural and anthropic origin (Cardona, 2003). As we analyse an urban area, urban vulnerability must also be characterised. Many authors define it as a set of factors which cause situations of risk or socioeconomic exclusion. Some of them also consider the accessibility level to resources which enable to face these situations (Castel, 1995; Gomà et al., 2005; FOESSA, 2008). Along the same lines, Reghezza et al. (2012), Frazier et al. (2014), and Fernández et al. (2018) consider it necessary to take into account: (1) the intrinsic situation of these groups, such as low income, immigration or old age; and (2) the unfavourable contextual situation, which is conditioned by the existing layout, urban planning or the unequal distribution of infrastructures over a territory. The contextual situation is considered since it can favour or encourage, to an even greater extent, such social inequality.
Studies have been conducted through different methodologies to assess social vulnerability in Spain. For instance, Navarro et al. (2020) assessed social vulnerability in connection to natural risks in the city of Almeria using multivariate statistical techniques. Moreover, other authors built an index to study social vulnerability associated with flooding in a coastal population of Murcia (Pérez Morales et al., 2016). The present research is included in a series of works that have been developed in recent years on Madrid and Barcelona, as it presents similar methods (Moreno et al., 2016; 2017; 2020; Palacios et al., 2018).
The investigation focuses on Bilbao, located in the north of Spain, specifically in the Basque Country. It has been chosen because it is one of the largest cities in Spain and, therefore, an environment with major urban problems. Another reason for its selection has been the availability of quantitative data published by the public institutions of the Basque Country. Although there are scientific articles about the urban problems in Bilbao (e.g. Aguado Moralejo et al., 2019), we stress two points that highlight this study: (1) the application of a complete, multidisciplinary, and comprehensive methodology, which involves a process of continuous immersion in the area of study, from quantitative techniques, to remote qualitative data collection and analysis; and (2) the need for updated studies on this subject, since Spanish cities are undergoing continuous social and economic transformation, periodic analyses are required (Arias, 2000).
This research aims to provide knowledge regarding the current socio-environmental vulnerability in Bilbao. Our objective is to study in depth the urban socio-environmental vulnerability of the city of Bilbao by characterising and analysing its spatial distribution both quantitatively, through an urban indicator, and qualitatively emphasising the most vulnerable areas. The intention has been to favour the identification of factors, causes, and consequences; and to provide a document directed towards public authorities, policymakers, social scientists, and society.
2. Material and methods
The methodology used comes mostly from the work published by Moreno et al. (2017) and Palacios et al. (2018). The quantitative data analysis was included in the study as a starting point and was processed through the Relative Socio-Environmental Vulnerability Synthetic Indicator (RSEVUSI). Employing this statistical tool, we assessed the socio-environmental vulnerability of each census tract. Then, we used the Arc-Map programme to represent the spatial distribution of the studied phenomenon graphically. The cartographic representation made it possible to analyse the distribution of the RSEVuSl results and to identify the location of the most vulnerable census tracts of the city. The last phase of the study consisted of analysing these areas based on the collection of qualitative data. Descriptions, phases, and methods are presented in more detail below.
2.1. Study area
The research was developed in the city of Bilbao. We have considered three scales for the analysis: district, neighbourhood, and census tract. For the quantitative analysis, we studied 277 census tracts in Bilbao, as the census tract is the smallest unit of measurement on which demographic information can be found. For the qualitative analysis and literature review, we also assessed the eight districts and the 44 neighbourhoods that compose the city; since they group the different census tracts and are concepts known and identified by the population.
2.2. Quantitative analysis: RSEVuSI
a. Data collection
We obtained statistical information through Lur-Data, a service associated with the Basque Institute of Statistics (EUSTAT). The reference date of the data is 2018, as it was the most recent information that could be found, except for Income per household data, which is from 2016 and has been obtained through the Spanish National Statistics Institute (INE).
The cartographic information was obtained from the Spatial Data Infrastructure of the Basque Country (GeoEuskadi, 2015), as well as from the Download Centre of the Spanish National Centre for Geographical Information (CNIG, 2017). All the above-mentioned sources were used for the quantitative analysis and the creation of each map present in the results section.
b. Relative Socio-Environmental Vulnerability Synthetic Indicator (RSEVUSI)
The Relative Socio-Environmental Vulnerability Synthetic Indicator (RSEVUSI) was derived from a study carried out by Moreno et al. (2017). We employed this indicator in order to characterise the socio-demographic, economic, and housing aspects of the census tracts. The quantitative analysis process was performed by using Microsoft Excel programme.
The RSEVuSI was computed from eight facets, considered the main determining factors of vulnerability (Table 1). Each of these facets has a proportional weight within the indicator (facet weight) and, except for three facets, the remaining facets are configured by two or three variables that also have their respective proportional weights (variable weight). Overall, each variable presents the population segment with a determining characteristic of vulnerability relative to the total population. More weight has been given to facets such as education or income, as these are considered more important determinants of vulnerability than others, such as age or household size. Similarly, the weights of the variables have been selected. Most of the variables come from the study by Moreno et al. (2017). Some have been omitted due to lack of data, but new ones have also been included (Table 1).
TABLE 1 Facets, variables, and formulas used to perform the RSEVUSI (Standardisation and Weighting).
| Facet | FW | Variable | Formula | VW |
| POP_UNED | (Uneducated population / Population > 16 years) * 100 | 0.4 | ||
| Education1 | 0.175 | POP_ILLI | (Illiterate population / Total population) * 100 | 0.3 |
| POP_ SEC_ED | (Population with secondary education / Total population) * 100 | 0.3 | ||
| POP_0_3 | % Population 0 - 3 years | 0.2 | ||
| Age1 | 0.125 | I_AGEING | (Population > 65 years / Population 0 - 15 years) * 100 | 0.4 |
| I_AGEING_E | (Population > 75 years / Population > 65 years) * 100 | 0.4 | ||
| Income2 | 0.20 | INC_HH | Income per household (€) | - |
| Employment | 0.125 | POPJJNEMP | (Unemployed population / Population 16 - 64 years) * 100 | 0.6 |
| status1 | POP_INAC | (Inactive population / Population 16 - 64 years) * 100 | 0.4 | |
| Immigration1 | 0.10 | POP_IMM | (Foreign population / Total population) * 100 | - |
| Household size1 | 0.15 | POP_ALONE | (Population > 16 years living alone / Total population) * 100 | - |
| H_61M | (Housing < 61m2 / Total housing) * 100 | 0.4 | ||
| Housing quality1 | 0.125 | H_NON_HEAT | (Housing without eating/ Total housing) * 100 | 0.3 |
| H_NON_BATH | Housing without bathroom * 100 / Total housing | 0.3 |
1 Standardisation;
2 Standardisation, logarithmic transformation, and transposition; FW-Facet weight; VW-Variable weight
SOURCE: adapted from Moreno et al. (2017).
First, each formula was applied to compute the 14 variables. Subsequently, the standardisation of the variables was carried out together with different procedures depending on the characteristics of each variable (logarithmic transformation and transposition: Table 1). Eventually, we combined variables within facets, and facets within the final indicator according to specific weights (Table 1). Thus, there was one RSEVUSI value for each of the 277 census tracts of Bilbao.
Through the ArcMap programme using the join tool, we associated statistical data (RSEVuSI values) with geographical information (census tracts). In the cartographic representation, we used ranges computed from the standard deviation of the distribution. The four limits were: 1.5 and 0.5 standard deviations below the arithmetic mean and 0.5 and 1.5 standard deviations above the arithmetic mean. This has been done in order to promote the representativeness of the sample.
2.3. Qualitative analysis: remote data collection
This section of the methodology deserves special attention since it completed and validated the indicator results. As Palacios et al. (2018) emphasised, a qualitative methodology is fundamental in the study of socio-environmental vulnerability in order to raise issues that cannot be assessed through numbers.
Due to the situation caused by the COVID-19 pandemic, it was necessary to readapt the methodology and carry out remote qualitative data collection. The methods initially proposed were replaced by: (1) virtual tour using Google Street View, (2) geographical information servers and interactive maps, and (3) public documents review.
We explored the districts of Bilbao by Google Street View with particular attention to those census tracts with higher values of socio-environmental vulnerability (above 1.5 standard deviations in the RSEVuSl values). The photographs analysed were mainly from 2018 and 2019. Based on the observation, the aim was to obtain the following information regarding the socioeconomic activity, state of buildings, state of public facilities and street furniture, environmental quality of the residential space, and degree of cleanliness and maintenance. Moreover, to obtain information related to the spatial distribution of transport infrastructures and equipment, we used servers such as Google Maps, Lurdata, and GeoBilbao. Finally, we also reviewed documents published by the Bilbao City Council.
Qualitative data have provided a broader understanding of the context of the most vulnerable sections, which has resulted in accurate descriptions in the results section and additional information in the discussion section.
3. Results
The map with the RSEVUSI values per census tract is shown in Map 1. Results presented a range of values that varied from 0.17 to 0.54. Their arithmetic mean was 0.35 and their standard deviation was 0.06. Values were divided into five ranges from low vulnerability (i.e. low RSEVuSI values) to high vulnerability (i.e. high RSEVuSI values).
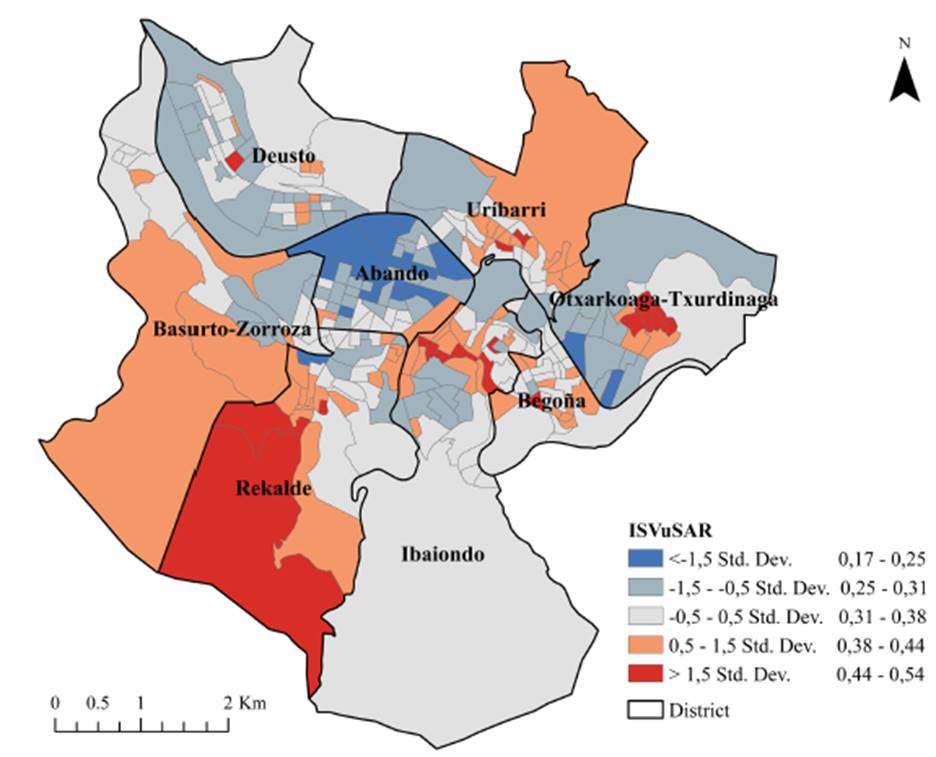
SOURCE: own elaboration.
MAP 1 The RSEVuSI results per census tract in Bilbao. Values are divided into five ranges from low vulnerability/low RSEVuSI values (bluish colours) to high vulnerability/ high RSEVUSI values (reddish colours).
Most of the districts were partially urbanised due to the topography of the landscape, excluding the Abando and Begoña districts. Therefore, although some of the peripheral census tracts occupied a large area, it is highlighted that they housed approximately the same amount of population as the other census tracts.
Concerning the distribution of socio-environmental vulnerability, it followed remarkable spatial patterns. The least vulnerable census tracts were located mainly in the Abando district, but also in the most central areas of the Otxarkoaga-Txurdinaga and Rekalde districts. Moreover, the most vulnerable census tracts were located primarily in the districts of Otxarkoaga-Txurdinaga, Ibaiondo, and Rekalde, with some spread over the majority of districts: Deusto, Begoña, and Uríbarri (Table 2). Only the Abando and Basurto-Zorroza districts did not present any census tracts with the highest RSEVuSI values; however both districts had census tracts with RSEVuSI values above the arithmetic mean (slightly vulnerable). Additionally, the situation of the Otxarkoaga-Txurdinaga and Rekalde districts is remarkable, as they had vulnerable census tracts but included within their boundaries some of the census tracts with the least vulnerability in Bilbao. In these two districts, the number of census tracts with the highest RSEVuSI values slightly exceeded that of census tracts with the lowest RSEVuSI values.
TABLE 2 Characterisation of neighbourhoods by the presence of census tracts with high RSEVuSI values (above 1.5 standard deviations; in parenthesis, the number of census tracts with high RSEVuSI values in each neighbourhood).
| District | Neighbourhood | |
|---|---|---|
| Without high RSEVuSI values | With high RSEVuSI values | |
| Deusto | Arangoiti, San Ignacio, and San Pedro de Deusto-La Ribera | Ibarrekolanda (1) |
| Uríbarri | Castaños, Matico-Ciudad Jardín, and Zurbaran-Arabella | Uríbarri (2) |
| Otxarkoaga-Txurdinaga | Txurdinaga | Otxarkoaga (5) |
| Begoña | Begoña and Bolueta | Santutxu (1) |
| Ibaiondo | Casco Viejo, Iturrade, La Peña, Miribilla, San Adrián, Buia, and Zabala | Atxuri (1), Bilbao La Vieja (1), San Francisco (2), and Soloxoetxe (1) |
| Abando | Abando and Indautxu | - |
| Rekalde | Amézola and Iralabarri | Errekaldeberri-Larraskitu (1), Iturrigorri-Peñas-cal (1), and Jretamendi (1) |
| Basurto-Zorroza | Altamira, Basurto, Olabeaga, Masustegui-Monte Caramelo, and Zorroza | - |
SOURCE: own elaboration.
Census tracts that presented high vulnerability according to the RSEVuSI were deeply analysed (Table 3). Regarding the most remarkable quantitative results, in most of the census tracts, the same variables stood out: uneducated population, income per household, and housing < 61m2. Population ageing arose just in the Uríbarri and Begoña districts, while the lowest-quality housing conditions predominated in the Ibaiondo district since it presented a large percentage of housing smaller than 61 m2, without heating, and without bathroom. Concerning the qualitative data, in most of the census tracts, the same variables stood out: the presence of abandoned commercial businesses on the ground floor and a good level of maintenance of public spaces. In the only vulnerable census tract located in the Deusto district, there were fences in the windows of lower floors, which has been characterised as a sign of in security. The Ibaiondo and Rekalde districts lacked green spaces and had some abandoned and decaying buildings. In the Rekalde, Otxarkoaga-Txurdinaga, and Ibaiondo districts, a greater number of vulnerable census sections were found and assessed in detail.
TABLE 3 Highlights of the quantitative and qualitative analysis of the most vulnerable census tracts (RSEVuSI values above 1.5 standard deviations) per district.
| District | Highlights | ||
|---|---|---|---|
| Quantitative - RSEVuSI | Qualitative - Observation through Google Street View | ||
| Deusto | Uneducated population Income per household Housing < 61m2 | Fences in windows (insecurity) Abandoned commercial businesses on the ground floor | |
| Begoña | Population ageing Income per household Housing < 61m2 | Abandoned commercial businesses on the ground floor Good level of maintenance of buildings, public spaces and green areas | |
| Uríbarri | Uneducated population Population ageing Income per household Housing without heating | Abandoned commercial businesses on the ground floor Good level of maintenance of public spaces and green areas | |
| Rekalde | Uneducated population Illiterate population Income per household Housing without heating Housing < 61m2 | Decaying buildings Abandoned commercial businesses on the ground floor No green areas Good level of maintenance of public spaces | |
| Otxarkoaga- Txurdinaga | Uneducated population Income per household Housing < 61m2 | Decaying buildings Marginal activities between buildings Good level of maintenance of public spaces and green areas | |
| Ibaiondo | Income per household Uneducated population Foreign population Housing without heating Housing without bathroom Housing < 61m2 | Abandoned and decaying buildings Abandoned commercial businesses on the ground floor No green areas Good level of maintenance of public spaces | |
SOURCE: own elaboration.
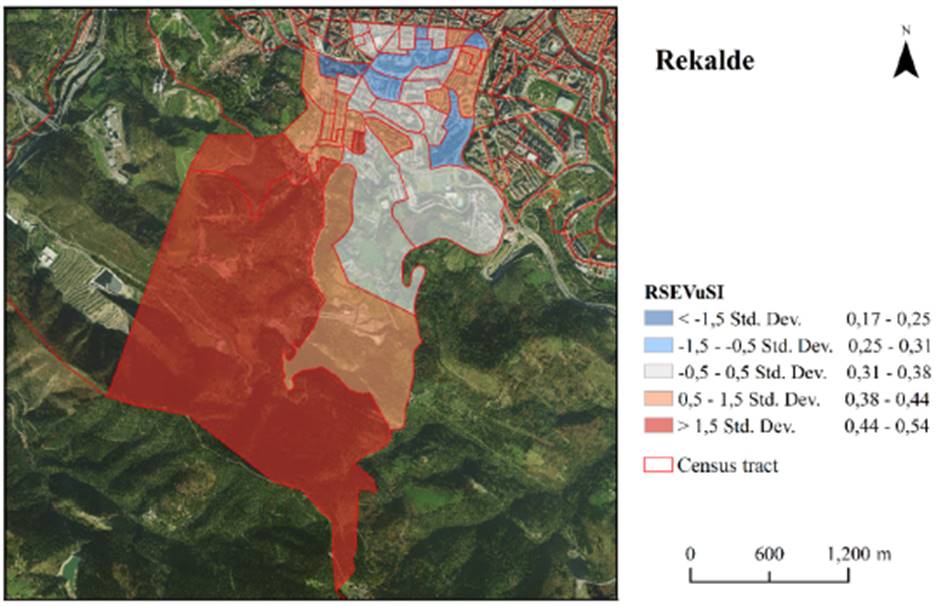
The Rekalde district presented three census tracts with high values of socio-environmental vulnerability (Table 3; Map 2). In all of them, the results were much higher than the municipal average. We highlight the income per household, which was around 68% of the average of Bilbao (20,000 euros). With regard to education, in two census tracts the uneducated population doubled and tripled the average of the city; and one of them had the highest percentage of illiterate people of all Bilbao. In addition, these census tracts had a remarkable percentage of housing without heating (i.e. between 6.5% and 12%). In one of them, 96% of the housing was smaller than 61 m2, while the population living alone was low. Among the three vulnerable census tracts, one of them was located in a more central area where there was higher population density and commercial activity. Even if buildings were made with cheap materials, the urban landscape presented acceptable characteristics. The remaining two census tracts were located in the periphery. They both presented aspects of rural rather than urban areas. There was a sufficient level of maintenance in the public spaces, although some buildings were in bad condition and several commercial premises were not used.
In the district of Otxarkoaga-Txurdinaga, there were five highly vulnerable census tracts (Table 3; Map 3). The analysis of the RSEVuSI shows that in all of them, the income per household was minimal, 50% of the municipal average and always below 20,000 euros. In fact, one of the census tracts recorded the lowest value in the whole city (14,000 euros). In terms of education, the population without studies was abundant, in some census tracts, even four times higher than the municipal average. Nevertheless, the results did not stand out for population ageing as values were below the average of Bilbao. Moreover, in the disadvantaged census tracts, at least 96% of the housing had a surface area of less than 61m2. In fact, buildings were made with cheap materials, and the great majority were decaying, peeling or dirty. Between buildings, some spaces seemed to host meetings of the marginal population. However, we found a good level of maintenance in the public spaces and a high surface of green areas.
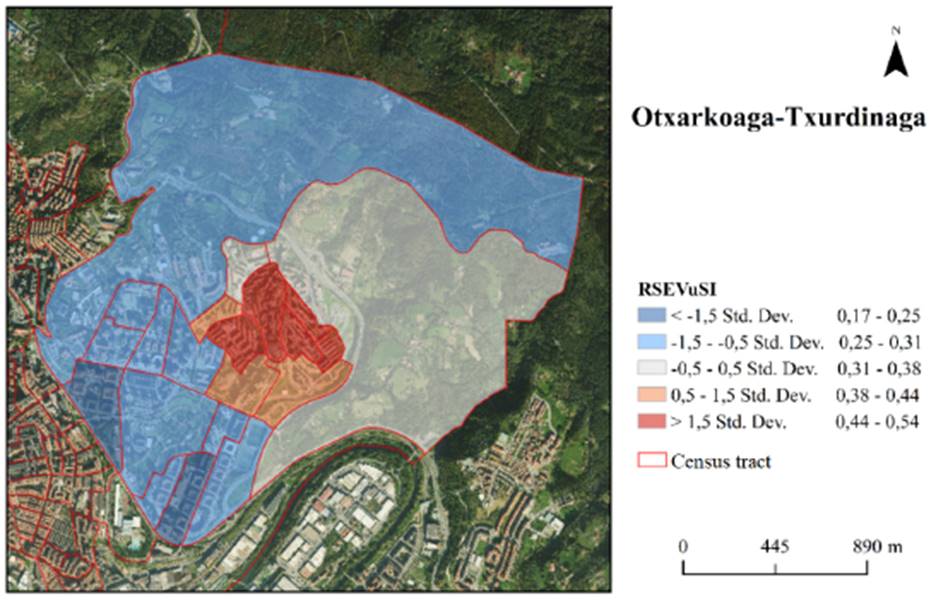
SOURCE: own elaboration.
MAP 3 The RSEVuSI results per census tract in the Otxarkoaga-Txurdinaga district.
The remaining five vulnerable census tracts were located in the Ibaiondo district (Table 3; Map 4). Once again, the income per household stood out, as it represented approximately 60% of the municipal average (i.e. from 17,000 to 24,000 euros). Similarly, the uneducated segment of the population was high; some census tracts had values that tripled the average for Bilbao. Furthermore, data reflected the low-quality housing stock of these census tracts, as many had a remarkable percentage of housing without heating and bathroom (i.e. around 5%). Likewise, many houses were smaller than 61 m2 while the population living alone was low (i.e. around 15%). Additionally, the foreign population represented 42% and 32% of the total inhabitants in two census tracts. In fact, in the census tract with the highest percentage of immigrants, 5% of the housing had no bathroom. Finally, we found some abandoned and decaying buildings in these areas. Although there was a good level of maintenance in the public spaces, there were some spots with abandoned furniture, and we found a lack of isolated vegetation or green spaces.
4. Discussion
The integrative and multidisciplinary analysis performed in this research has allowed to meet the proposed objectives based on the study of the urban socio-environmental vulnerability of Bilbao. Through the RSEVUSI, the census tracts of the city have been characterised, and qualitative information and literature review have verified and completed the results.
The characterisation of the census tracts by the RSEVUSI has assessed the level of spatial segregation of the city. In this sense, the RSEVUSI values range between 0.17 and 0.54, which means that there is no great inequality between census tracts, although differences were seen by areas. Comparing these results with those obtained in the Barcelona study using the same methodology (Moreno et al., 2017), we argue that Barcelona had a greater difference between the most and least vulnerable census tracts, as its RSEVuSI values oscillate between 0.15 and 0.64.
Many similarities were found in a research carried out on the urban socio-spatial differentiation of Bilbao (Altuzarra et al., 2016; 2018). A Multiple Factorial Analysis was conducted using a set of socioeconomic and urban variables. Although the unit of analysis of the study was the neighbourhood instead of the census tract, the results of both studies present equivalent information. The Otxarkoaga, San Francisco, Uretamendi, and Iturrigorri-Peñascal neighbourhoods were the most disadvantaged regarding socioeconomic conditions and housing characteristics. Likewise, another article about socio-residential segregation in Bilbao identified the same neighbourhoods due to their lower economic and educational development (Hoya, 2017). Indeed, according to our results, nine out of the 17 most vulnerable tracts were located in the aforementioned neighbourhoods. However, it should be stressed that these nine census tracts were the most concentrated over the territory; the remaining eight census tracts with the highest RSEVuSI values were more spatially spread. Therefore, it is presumed that they were not identified by other studies due to the unit of analysis. The proximity of other census tracts with lower RSEVuSI values counteracted the level of vulnerability of these neighbourhoods.
Despite obtaining similar RSEVuSI values in different neighbourhoods and peripheral districts of the city, the qualitative research and literature review have shown significant differences between the districts. We have found contrasting problems, levels of marginalisation, and the state of buildings and infrastructures.
The location of the most vulnerable areas in peripheral neighbourhoods can be explained by the migration and uncontrolled urbanisation that occurred throughout the 20th century. Numerous peasants coming from different regions of Spain arrived on the outskirts of Bilbao in order to work in the emerging industry or the mines. This large population, due to a minimum economic state, was forced to build their own houses illegally (Arbaiza, 2009; del Vigo, 2010). Indeed, López (2008) states that the periphery of Bilbao was made up of the neighbourhoods of the so-called "worker ring", located on the slopes of Bilbao.
The worker origin in the 20th century is shared by the neighbourhoods of Ibarrekolanda, Uríbarri, Santutxu, Otxarkoaga; and three neighbourhoods of the Rekalde district (Zabildea, 1989; Bacigalupe & Espinosa, 2004; López, 2008; del Vigo, 2010; Eguriaun, 2010). Currently, the situation in the neighbourhoods of Ibarrekolanda, Uríbarri, and Santutxu is very similar. The three of them presented one or two vulnerable census tracts; and they all have urban landscapes typical of popular districts but, generally, with buildings and infrastructures in good conditions. The Otxarkoaga neighbourhood had five vulnerable census tracts, which were concentrated in space. At the beginning of the 21st century, it suffered urban development intervention, and currently presents a typology of rental housing due to the municipal ownership of the majority of buildings (Antolín et al., 2010). The neighbourhood has an adequate level of public facilities, but the steep slopes make mobility difficult in the neighbourhood and promote the segregation of certain areas. In this sense, Bilbao City Council is developing projects to improve the mechanical accessibility of the neighbourhood with the rest of the city (Bilbao City Council, 2018).
Probably the most precarious situation, at least historically, is located in certain neighbourhoods of the Rekalde district. The RSEVUSI detected three census tracts distributed among the neighbourhoods of Errekaldeberri, Uretamendi, and Iturrigorri-Peñascal, of which the last two stand out for their marginal location. We consulted documents referring to the situation of these neighbourhoods in 1970; they show the need for comprehensive and complete action to eradicate shantytowns, drug use, and crime (Zabil-dea, 1989; del Vigo, 2010; Eguriaun, 2010). Although the state of these neighbourhoods has improved over time, the present analysis still showed a low income per household and a high uneducated population segment. Moreover, the urban landscape presented degraded buildings and street furniture.
In contrast to the peripheral location of the aforementioned neighbourhoods, in the central Ibaiondo district, there were five vulnerable census tracts. Although they were located in different neighbourhoods, that area as a whole is called "Bilbao LA Vieja". By the end of the 20th century, "Bilbao LA Vieja" was affected by a process of economic, urban, and social degradation, aggravated by successive floods of the Estuary of Bilbao. Recently the zone has been the object of numerous processes of urban regeneration and improvement promoted by institutions, non-governmental organisations, and neighbours: European URBAN program, Integral Plan of Rehabilitation, Special Plan, etc. (Bilbao City Council, 2005).
Despite the many positive aspects of being the object of urban renovation, regeneration, and rehabilitation actions, some authors warn of a possible gentrification of "Bilbao LA Vieja" and criticise the actions of Bilbao City Council (Vicario & Martínez, 2003;
Antolín et al., 2010; Egizabal, 2015). For instance, Egizabal (2015) refers to the changes in the identity of the neighbourhoods caused by renovation actions, such as the disappearance of symbolic spaces or the creation of new segregation boundaries. Additionally, Vicario & Martínez (2003) argue that the strategies of revitalisation of these neighbourhoods will mean the displacement of their current residents. Along the same lines, numerous articles deal with urban marketing strategies adopted by the city to compete with other European cities (Torres, 1998; Torres, 2013). Vicario & Rodríguez (2005) point out the large urban planning and real estate operations for the renovation of areas of opportunity, all located in the central area and on the banks of the Estuary of Bilbao, where lower RSEVUSI values were achieved (Esteban, 2005; Fernández & Antolín, 2015).
Some documents published by the Bilbao City Council support the above-mentioned, while others reflect a very different reality. Despite the fact that the vast majority of actions are carried out in central districts, interventions were also found in marginal areas (Citizen's Advice Area, 2018). Indeed, many of the most vulnerable census tracts coincided with public housing, with 4,168 housing distributed around the city (Bilbao City Council, 2016; Local Autonomous Body for Municipal Housing, 2018).
Finally, it has been considered attractive to include the opinion of the citizens in this respect. IKERFEL (Market Research and Strategic Marketing) analyses the satisfaction of the citizens with the services and the municipal management by subject (IKERFEL, 2017). The following facts are to be highlighted: (1) the population of Otxarkoaga-Txurdinaga, one of the most vulnerable districts, stresses the existence of green spaces as the main positive aspect; (2) in the most vulnerable districts, a greater population considers neighbours as a main positive aspect: and (3) with the exception of central districts, the negative aspects always refer to the need for public transport improvement.
5. Conclusions
Bilbao faces problems associated with urban socio-environmental vulnerability, which is mainly located in the districts of Otxarkoaga-Txurdinaga, Ibaiondo, and Rekalde. However, there are also census tracts distributed in other districts of the city. Except for the neighbourhoods of "Bilbao La Vieja" in the Ibaiondo district, two geographical factors have been identified as determinants of vulnerability: proximity to the centre and proximity to the Estuary of Bilbao. As it has been seen, the census tracts close to these areas presented lower values on socio-environmental vulnerability than the peripheral ones.
Despite finding clear differences regarding the urban landscape of the areas of Bilbao with higher and lower RSEVuSI values, overall, public spaces are in good condition. Even those located in the most vulnerable census tracts presented acceptable levels of maintenance and cleanliness; just some decaying buildings and several abandoned businesses were found.
The literature review coincides with our findings; the quantitative analyses consulted presented similar results. Likewise, the migratory processes that occurred in the 20th century led to inadequate living conditions in some peripheral areas of the city. In recent decades they have improved notably but still require certain actions, such as the conditioning of certain roads, the increase in urban vegetation or the improvement of connections with the rest of the city.
The limitations of this study include the circumstances arising from the COVID-19 pandemic. The fieldwork had to be conducted remotely, and certain sections of the methodology had to be adapted. Although Google Street View made it possible to analyse the current situation through observation, access to the whole urban fabric was incomplete, nor was it possible to collect data through interviews. In other words, physical fieldwork would have provided a more comprehensive approach to Bilbao's socio-environmental vulnerability.
Further qualitative investigation should be performed in the areas characterised by high RSEVuSI values. Thus, it will be possible to learn about the realities of the most vulnerable inhabitants and provide direct information to the public authorities so that they can take the appropriate action to improve the conditions of habitability and accessibility of the areas of the greatest need.

