


 English (pdf)
 Article in xml format
 Article references
 Send this article by e-mail
 Cited by SciELO
  Cited by Google
  Similars in
SciELO
Similars in
SciELO  Similars in Google
 Permalink
1. INTRODUCTION
Accessibility has been used as an important parameter to make decisions about the land planning; this has been very useful to analyse the competitiveness among different regions in which has been evident that the population with more accessibility has had major economic development through the years (Zuluaga & Escobar, 2017). The transportation role at the society, in general terms, is to provide people the opportunity to participate in activities at different places such as going to work, goods and services mobilization, etc. (Geurs & van Wee, 2004). In which the transportation infrastructure is the key element for the territory and the promoter of the regional development and economic welfare (Gutierrez & Monzón, 1993).
On one hand, accessibility is one of the most used terms and measurements on transportation geography literature. It is basically a measurement of the traveling access from one point to a specific destination through one method or several methods of transportation (Geurs & van Wee, 2004). It has been also defined as potential opportunities to reach different activities spatially distributed, such as employment, education, health, entertainment and social interaction (Hansen, 1959). On the other hand, other definitions refer it to a person access to execute an activity in a desired way, desired place, through a desired transportation method at the desired time (Bhat et al., 2001). It is important to highlight that access is used when the perspective of a person is mentioned, and accessibility when the perspective of a location is mentioned (Geurs & van Wee, 2004). These concepts of accessibility consider the interaction of the transportation network, use of the land or the geographic distribution of activities, in such way that all of them are perceived and effectively used by the individuals with different characteristics (Páez et al., 2012). Which is related with the connectivity, that allows to establish the relationship and links between the network nodes.
There are different types of accessibility measurements associated to a different classification, regardless of being based on same theory, such as the measurements based on infrastructure, location, people and land use. Also, the measurements of spatial separation, contour, gravity, performance, space - time, use and network (Curtis & Scheurer, 2010). Accessibility has four components: Transportation, related to measurements such as traveling time, cost, and effort of moving around any space; land use, quantity or quality of opportunities spatially distributed in each destination (employments, stores, sanitary and social installations, and entertainment) and the demand of these opportunities in the places of origin. Temporary, that considers the availability of opportunities in different hours of the day, weeks and / or years and the time availability in different moments of the day, week or year and, time available for people to in different activities. Individual, that covers the needs, abilities and opportunities of the transportation users; it takes into consideration socioeconomic and demographic factors (Geurs & van Wee, 2004).
There are different types of studies that analyse the accessibility, taking into account the relation between the transportation infrastructure and the economic development (Castella et al., 2005; Escobar et al., 2018), in which has been identified that the improvement of the network is a key element in the search of a better development. It is important to highlight the study (Baradaran & Ramjerdi, 2001; Castella et al., 2005; Escobar et al., 2018) in which there is a classification of accessibility indicators, including the cost of traveling (distance or time). In the study the authors compare the performance of several indicators based on infrastructure of European cities' context. Among the study results, it must be highlighted the importance of understanding the scope of each indicator, applied according to the needs of each area study and the available variables. The study (Cubukcu, 2021) analyses the indicators based on infrastructure such as the indicator of route factor or also known as deviation indicator or circuit, to evaluate the efficiency of the Paris transportation network and its surroundings. Likewise, the physical structure of the freeways network is quantified, by using topological indicators based on the graph's theory: node density, edge density, edge sinuosity, node order, beta indicator, in which the zones, where the freeways network is less dense and less efficient to provide direct ways, are identified. In the study of evaluation and cartographic representation of road accessibility for the Peninsular Spain (Lopez et al., 2016), an analysis was carried out in the years 1960 - 2014, by using indicators based on infrastructure, specifically, the Potential Absolut Accessibility Indicator and Integral Route Factor in which, according to the authors, the Route Factor is one of the most precise indicators to measurement the quality of connection that provides a focused road infrastructure in distance. Five temporary scenarios were evaluated in the study, with the purpose to value the evolution of the Spain road network and its effects over the territory accessibility. It was determined that the mountains areas indicate, in general terms, and for all years of analysis, a very deficient accessibility situation.
In Latin America, travel expenses are considered as part of the transportation components, but the individual component that seeks to analyse daily mobility and the need of the users of the different transport systems has also been considered. Needs that include financial barriers, physical, organizational, limited skills and technological (Zunino et al., 2017). It is worth mentioning the study carried out in the northern periphery of Santiago de Chile (Jirón & Mansilla, 2013), where an analysis of social exclusion was carried out through accessibility, with the implementation of an ethnographic approach. Specifically, the shading technique, which consists of describing through interviews, the trips that are carried out by an individual starting from home, in different ways of transportation, considering their economic situation and cultural aspects. It is also worth considering the development of an analytical proposal for the study of accessibility by public transport in Latin America. Which is related to the well-being and equity of people (Hernández, 2012), where it is stated that accessibility conditions are not the same for all social classes, or areas, which are not distributed equitably. For the proposal, different implemented accessibility studies in public transport were analysed; identifying the basic concepts, which are incorporated into an analytical scheme that contemplates the interaction between them. The proposal allows to maximize the understanding of the effect of mobility on well-being and the role of public transport.
In Colombia, the impact generated in saving travel times by the construction of new road projects has been evaluated through indicators based on infrastructure, such as the evaluation of the global average accessibility of the Pacific 1, 2 and 3 road projects (Muñoz et al., 2016). In this investigation, the average travel times, and coverage rates in the areas where the new network connections were implemented were analysed, and it was determined which are the most benefited in terms of the percentage of savings in average travel times. The accessibility analysis of the northwestern area of Colombia (Zuluaga & Escobar, 2017) can also be mentioned, in which a comparison of coverage offered by the transport infrastructure network, with respect to the population and the area of influence was made. As a result, the study reflects the social gap that the North Pacific sector has due to the lack of infrastructure, compared to the Andean Region where a higher road density is observed. Also, the evaluation of the geographical accessibility levels for the special coffee farms in the Department of Nariño (Goyes Chaves et al., 2022), by using the route factor indicator as one of the most important sources of information to identify suitable areas for the distribution centres establishment. The result showed that special coffee-production areas located in the Eastern zone have low levels of accessibility in relation to Municipalities located in the South and West of the Department.
According to the Planning National Department (DNP, 2014), the Nariño department, which is located in a mountainous area, has hard conditions of access. As a result of that, the transportation of people, goods and services is difficult; this situation affects the road interaction between the different municipalities, caused by the lack of road infrastructure and roads, damaged roads or roads with traffic restrictions and deficient maintenance. Causing long traveling times and longer roads which create in the meantime more costs of transportation. Actually, the Nariño department has approximate 7.628,80 km of roads network; classified according to its use in primary roads (768, 48 km), secondary (1372, 22 km) and tertiary (5.487, 99 km) in ordinary and bad condition (Government of the Department of Nariño, 2019). This region has a deficit of coverage in 40 % of the total of its surface; in which the situation is critical at the municipalities which are part of the coast and west area. As a result of this, the department has no competitive advantage compared to others in the country.
The evaluation of accessibility levels with the implementation of indicators based on infrastructure contributes to the identification of both the different areas and municipal capitals that have poor accessibility and that should be a priority objective for improvement, where the transport infrastructure is the backbone of territorial planning. Which is a basic element to promote regional development.
The objective of this research is to evaluate the spatial accessibility levels by using indicators or measures based on infrastructure, specifically the density indicator and integral route factor. The research covers the 64 municipalities that are part of the Department of Nariño; so, the indicator and factor will help to analyse the advantages and disadvantages of the different zones regarding the level of development of their road configuration, as well as the quality and efficiency of the network layout of the transport infrastructure. The results obtained contribute to decision-making, being a planning tool, aimed at prioritizing the improvement of the infrastructure network at the municipal level, generating a positive impact on the quality of life of people, reducing social exclusion and economic development. Taking into account that better connectivity facilitates both the mobility of people and the distribution of goods and services, which can attract new companies and investments, translating into more employment and higher income for the local population, which generates greater satisfaction, general well-being and better development opportunities. Likewise, it can impact the migration patterns of people, especially in the most remote rural areas, where infrastructure improvement alternatives can cause people to move to areas that were less attractive before, which can have negative impacts cultural in the region.
2. MATERIALS AND METHODS
The analysis has three phases. Network structure characterization, composed of municipalities headers (nodes) and the road network (edges); indicators modelling, by using Geographic Information System (GIS) and finally; implementation of spatial interpolation technics and descriptive statistics.
2.1. Network and polygon information
To develop the study was necessary to count with first and second order information, to guarantee the quality and reliability of the generated products. The information sources correspond to the cartographic data base of the Nariño department at municipality level. To complete the network road characterization, the information was collected from geographic official web pages (public offices) such us National Road Institute (INVIAS, 2019), the Agustin Codazzi geographic institute (IGAC, 2021), specifically the open portal SIG-OT, and line type vector information from Open route services (Openrouteservice, 2021) which is a free collaborative platform. The information regarding with the politic and administrative division at a municipality level was obtained from the National Administrative Department of Statistics (DANE, 2019) geographic official web page. The municipalities headers information was collected in vectorial format, type perimeter polygon of each municipality; it was necessary to convert in point type through calculus of centroids to generate the structure of network of nodes and edges. Similarly, the collected alphanumeric information was included to the vectorial information available for its spatialization.
2.2 Evaluation of Accessibility Measurements
The evaluation of the accessibility measurements was made from the collected alphanumeric and vectorial information, which are the inputs for the analysis models. This phase covers the calculus of the measurements by using the GIS; its cartographic representation through the generation of continual surfaces and ISO curves - Accessibility and finally descriptive statistics analysis. As mentioned earlier, the accessibility is the measurement that allows groups of individuals or goods to arrive to activities or destinations by using a combination of transportation types and uses of the land by being a direct expression of the mobility (Rodrigue et al., 2016). For the analysis it was evaluated the measurements based on infrastructure that consider the transportation infrastructure network of the Nariño department.
The measurements based on infrastructure use as metric of analysis the approach of traveling cost, represented by the physical distance, time or travel expenses from one node i to another j, keeping in mind the types and infrastructure of transportation, being suitable to the analysis of nodes and network structures (Geurs & van Wee, 2004). In this type of measurement, if the distance or travel time increases, accessibility decreases and if the distance or travel time decreases, accessibility increases, directly relating to the characteristics of the network (Baradaran & Ramjerdi, 2001). Within these measures we find the density indicator that allows analysing the level of development of the road configuration of a certain study area and the integral route factor indicator that allows measuring the quality of the network layout, implemented in this study.
There are currently sophisticated GIS applications that facilitate route modelling and travel time calculation, considering the average speed per network segment, traffic lights and traffic congestion, such as big data technologies, which are new sources of massive data produced by multiple networks of sensors and devices, which offer information and monitoring of human activities such as mobility (Puebla, 2018). The big data has been considered for the planning of transport and urban infrastructure, through the collection of large volumes of data with the use of cell phones. This to understand the mobility flows of people and create home origin-destination surveys, which allows to have updated information in less time (Benitez, 2019).
Density Measure
Is the length of the road network per unit of surface; it is expressed as the relationship between the length in km of the road network and the surface in km 2 of the study area (Chias & Reséndiz, 2008; Izquierdo, 1994). From this indicator, it can be inferred the development level of the road configuration, since a better development is associated in the areas with more kilometres of roads; likewise this indicator is strongly related to indicators that reflect the investment levels in infrastructure and equipment, mobility and population displacement (Ordoñez, 2018). The formula is shown in the equation (1).
Where:
D i : Road Density
L i : Network Length (km)
A i : Study area (km 2 )
The length of the road network is obtained by adding the length of each segment of the analysed area by considering the different types of roads. The area of the study zone is obtained by counting the surface for which the indicator is being calculated. The denser is the network, the shorter the average distance measured from each point of analysis of the study area will be (Chias & Reséndiz, 2008).
The network length and the area of the study zone were calculated at municipality level, by using the free software QGIS 3.14.16 with the implementation of geo process tools; in first request of extraction and road delimitation. With the vectorial information separated the indicator is obtained by adding the length of each segment of the network enrolled to each municipality and its relationship with the area.
Integral Road Factor Measurement
This indicator allows to measure the quality, understanding quality as the route that is more like a straight line between two nodes in the transportation network layout. The more alike it is, the better is the indicator; by being a straight line the best connection layout between two points, the road network can be pondered in function of this characteristic. It is calculated by constructing two origin-destination matrices, one for distances over the network and another for distances in a straight line to and from each node (Cubukcu, 2021; Izquierdo, 1994). To determine the Integral Road Factor Measurement, the following equation (2) is used.
 Where:
R i : Integral Road Factor for the node.
d ij : Minimum distance over the communication network between i and j.
d gij : Geographic distance or straight line from i to j.
n: Number of nodes.
For values close to 1, this indicator tells that the layout is close to the straight line, without geographic accidents that prevent from a free circulation. Values between 1 - 1.5 correspond to a regular network; between 1.5 - 2 is classified as irregular network, which indicates that the zone has low levels of accessibility and the values that are over 2 correspond to a tortuous layout that is used to be associated with areas of mountains mainly (Bosque, 2000).
For the calculus of the indicator two origin matrixes were made - destination of size 57 x 57, 3.249 routes per each matrix. It was considered as nodes of the network, the geolocation of the municipalities headers (64). The first matrix takes into consideration the real distance between each one of the nodes (point to point), calculated from the transportation network with the use of GIS, specifically, the free software QGIS and OpenRouteService (ORS); it is important to clarify that the ORS allows to obtain information of time and distance between a group of locations by specifying the type of transportation used, in this case private vehicle. For the second matrix is considered the Euclidean distances or straight line, which were calculated by using the software R with the use of the shortestroad Dijkstra algorithm (Dijkstra, 1959).
With the calculated indicators for each municipality, the Inverse Distance Weighting (IDW) technique was implemented. This procedure is applied to predict and distribute the nodes information where the indicator measurements were made over a continual surface. This method presupposes that the variable that is cartographically represented decreases its influence as longer distance is from its sample location (Olaya, 2014). The results are presented in continuous surfaces or Raster data, also through the generation of Iso - Accessibility curves.
2.3 Inverse Distance Weighted (IDW)
A continual surface can be represented as Raster format data, which are rectangular matrixes of cells; organized in rows and columns, in which each cell represents real world information (Olaya, 2014). To create a surface, the interpolation is used, which is a mathematical procedure used to predict the attribute's value in a specific place. From the obtained attribute's values of nearby points, located within the same region or study spatial area. This procedure is used to transform a finite number of observations, in a continual space in such way that its spatial pattern is compared with the one presented by the base specific observations (Burrouh & McDonnell, 1998). The interpolation is needed, basically, when the data do not cover all region of interest of the study (Ferreira, 2005). When speaking about spatial interpolation through GIS, different methods can be distinguished that are classified according to their nature; the IDW is part of the deterministic methods which generates continual surfaces through the grade of similarity. The IDW method can be expressed by the following equation (3):
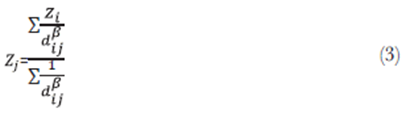
Where:
Z j Estimated value at interpolated point j.
Z i Known sample value i.
d ij Distance from location to i location j.
β: Power parameter
To implement the IDW method the software QGIS 3.14.16 was used, specifically the Raster complement - IDW INterpolation. Per the method, the influence of one point related with others is reduced or decreased as the distance between each other increases (Olaya, 2014).
2.4 Data Exploratory Analysis
The graphic and visual methods of the Data Exploratory Analysis are used to identify the data properties to detect patterns and formulate hypothesis from the data. It is defined as the group of techniques that describe and visualize the spatial distributions, identify atypical locations, discover associations schemes and suggest structures at the geographic space (De Corso Sicilia & Pinilla Rivera, 2017). Within the used techniques is the dispersion diagram, which is a graphic tool that allows to demonstrate the relationship between two types of data and quantify the intensity of such relationship. The graphic visualization is not enough to determine some type of relationship; because of that, the use of a coefficient is needed to measure the grade of dependence between variables. For instance, the lineal correlation coefficient that represents the behaviour of a dependent variable regarding an independent variable X. The lineal correlation coefficient is in a range of -1 to 1, where the values close to 1 indicate a positive lineal relation directly proportional; values close to 0 indicate that there is not a defined correlation scheme between variables and values close to -1 indicate that there is a negative lineal relation, inversely proportional of X regarding Y (Izar & González, 2004).
The analysis was carried out using the free open - use GeoDA software (Anselin, 2004), with which a dispersion diagram of standardized variables was elaborated, in order to identify the correlation between the two indicators based on infrastructure.
3. RESULTS AND DISCUSSIONS
The main objective of this analysis is to evaluate the spatial accessibility levels of the 64 municipalities of the Nariño department. By implementing the indicators of geographic accessibility based on infrastructure, specifically the density indicator and the integral road factor, which are used to analyse the advantages and disadvantages that the different municipalities have. The analysis studies the advantages and disadvantages that municipalities have in terms of the level of development of its vial configuration and the quality - efficiency of the transportation infrastructure network layout. In this section the results and the most important findings of the research are presented. For the process of calculating and modelling the indicators, the official cartographic information availability was considered; the information corresponds to the road infrastructure network of the Nariño department, as well as vectorial information of the politic - administrative division and location of municipalities headers.
3.1 Information Characterization
The Nariño department is located at the north of the South American continent, between the 00°31'08" and 02°41'08" of north latitude and 76°51'19" and 79°01'34" of west longitude; at the very southwest of Colombia, in the border with Ecuador (ODDR, 2011). The Andes Mountain range crosses the department from south to north, where three types of topography can be found: plain, that covers the Pacific Ocean, the Andina region and the Amazonian slope. It has a surface of 33.268 km 2 , which is the 2.9 % of the national territory, with an elevation gradient between 0 and 4.764 m.a.s.l. The territory boundaries are the Cauca department at the north, Republic of Ecuador at the south, the Putumayo department at east and the Pacific Ocean at west (Government of the department of Nariño, 2020). According to the population census made by the National Administrative Department of Statistics (DANE, 2018), the Nariño department has 1.335.521 people; its capital city San Juan de Pasto is the most inhabited city figure 1.
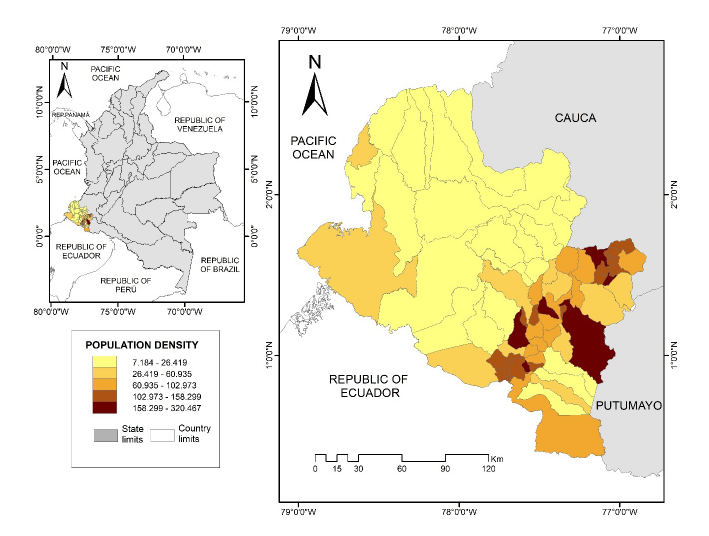
SOURCE: Own elaboration based on population census DANE 2018.
FIGURE 1 Population density, Nariño department.
Figure 1 shows the population density per surface area, where dark colours represent a higher concentration of population per surface unit. It can be identified that the municipalities located in the south-eastern zone that corresponds to high mountains have a higher concentration and a lower concentration in the western and central-northern zones.
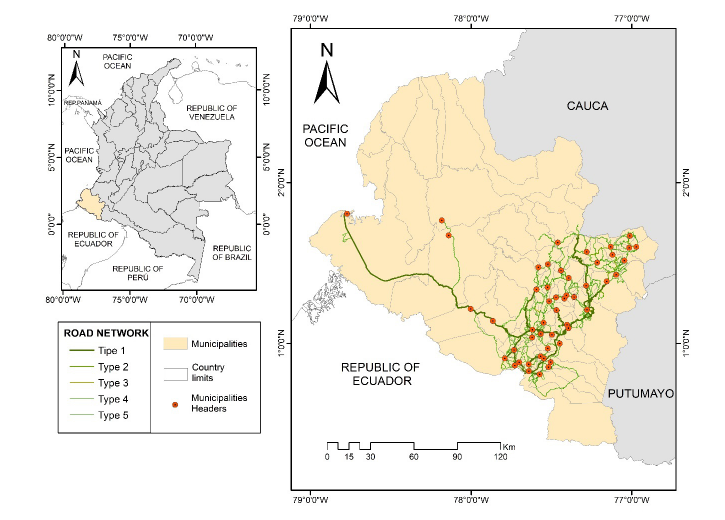
The region has approximately a total of 7.628,80 km of roads networks, classified according to its purpose as primary roads (768,48 km), secondary roads (1372,22 km) and tertiary roads (5.487,99 km) (Government of the department of Nariño, 2019). The network characterization is presented in the figure 2. It's important to clarify that the road network structure of the department for this analysis, was made up by 64 nodes, that represent each one of the municipalities headers and 1979 edges. It was identified that 7 nodes are not connected by roads; because of that they were not considered during the modelling. This information is considered as the inputs for the indicators analysis.
3.2 Evaluation of Accessibility Measurements
Through the implementation of the proposed methodology, the infrastructure-based indicators were calculated from the characterization of spatial information, which were evaluated to determine their spatial distribution.
Density Indicator
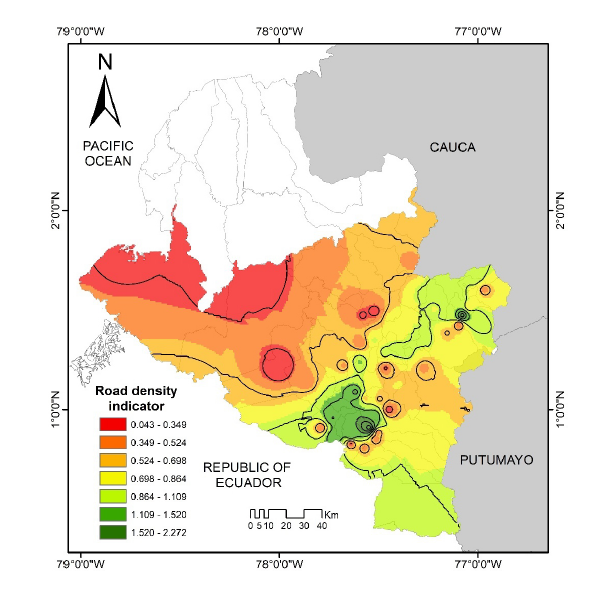
The calculus of the network density indicator allows to compare the development of the road infrastructure associated to the area of each municipality. With the results it was created a model of continual surface, by using the IDW method; likewise, curves of ISO- Accessibility were also generated to cartographic representation figure 3.
SOURCE: Own elaboration based on INVIAS data base, IGAC, 2021
FIGURE 3 Municipal road density indicator, Nariño department.
The results obtained in figure 3, indicate that in the north zone, close to the Pacific Ocean, there are 7 municipalities with no transportation infrastructure and at the west zone both have the lowest values for this indicator. It also can be seen that in these zones there are municipalities of large surface extension, but with poor road infrastructure, in which the area affects the indicator, with low values as result.
Likewise, the south and east zones have the highest road density values, which means that have better levels of accessibility with robust transportation network and municipalities with less extension area, where the 25,24 % of the department total population is gathered. The results were cartographically represented through different colours, from red to green, in which low values correspond to low levels of accessibility identified by the red colour and high values which means better conditions of accessibility identified by the green colour.
Integral Route Factor Indicator
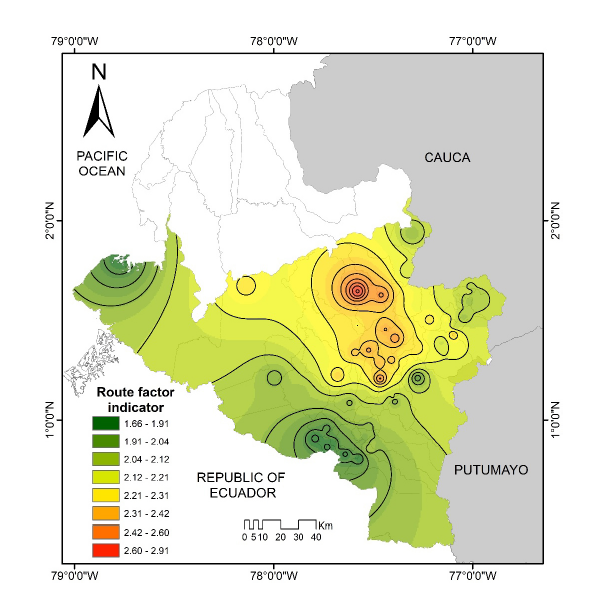
The objective of this indicator is to analyse the quality and efficiency of the road infrastructure network layout. With the results a continual surface model was created by using the IDW interpolation method and ISO- accessibility curves were also created figure 4, input for the cartographic representation of the accessibility levels for each one of the municipalities.
SOURCE: Own elaboration based on INVIAS data base, Openrouteservice, 2021
FIGURE 4 Integral Road Factor Indicator at municipality level, Nariño department.
The zones with the low values for this indicator are those which have better conditions of access, associated with the road's geometrics characteristic and roads availability, represented by green colours. Likewise, the zones with the highest values are those with more disadvantages and are represented by the red colour. In the figure 3 can be seen the municipalities that have better accessibility levels which are mostly located on the south and west zones. Similarly, the municipalities that have low levels of accessibility are located on the central - eastern zones.
3.3 Descriptive Statistical Analysis
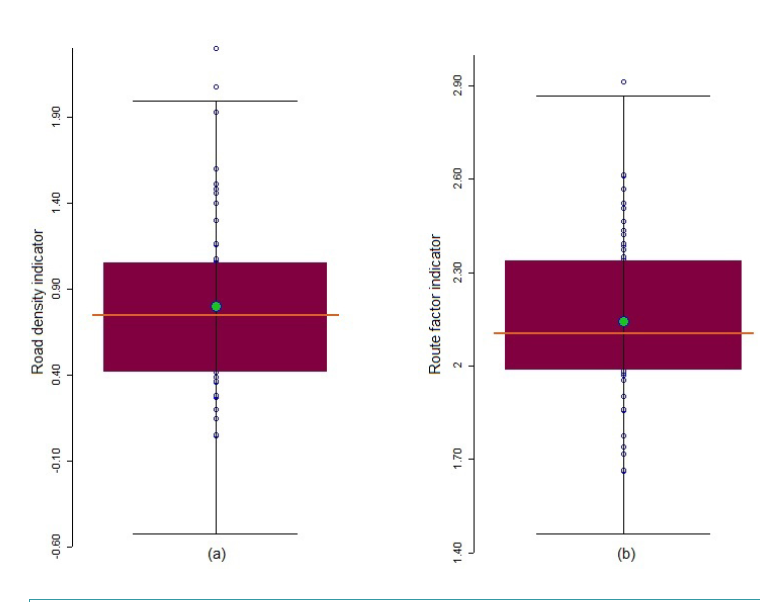
By using the software Geoda, a Descriptive Statistical Analysis was made for the two indicators. For the density indicator figure 5 (a) there are two superior atypical data, corresponding to Contadero and Gualmatán Municipalities; located at the south zone of the department (green colours figure 3), that are characterized for having smaller areas comparted to the rest of municipalities, but with good transportation infrastructure, which is the reason why the indicator has higher values. This does not necessarily mean that the rest of the municipalities have poor infrastructure since the administrative area of these two municipalities compared to the average surface of the rest are 27 % and 35 % of the area of the rest of municipalities. The lowest value is 0, 04 (green colours figure 3), the highest is 2, 29 (red colours figure 3) and the standard deviation is 0,534. A box plot was created with the results.
SOURCE: own elaboration, software GeoDa.
FIGURE 5 Integral Road Factor Indicator at municipality level, Nariño department
For the Integral route factor indicator, it was identified that all nodes that are part of the network have values slightly apart from the unit, with a value of 2,143 that means that the real data links have greater lengths compared to a straight-line distance or also known as desired. The lowest value of the results in zones with infrastructure is 1, 66 classified as irregular network (green colour figure 4), a maximum value of 2, 91 considering values higher that 2 as tortuous networks (red colour figure 4) and, standard deviation of 0,268. A box plot was created with the results, in which can be seen that 13 municipalities are above of the third quartile. With an atypical superior data that corresponds to the Cumbitara Municipality located at the north-central zone figure 5 (b).
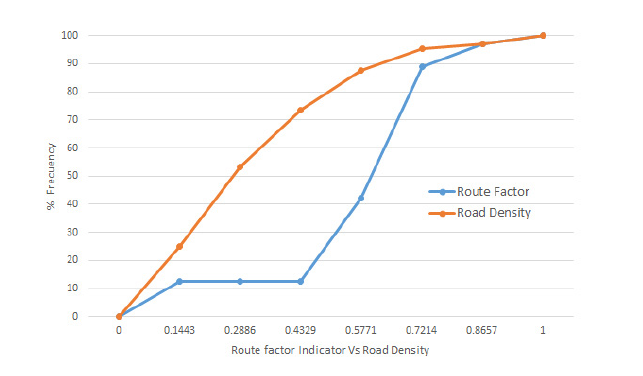
Figure 6 shows the cumulative frequency curve for the two indicators, in which could be identified that only in the 26,56 % of the municipalities the highest values of the road density are concentrated and, in the municipalities with low road density the 74,75% of department population are concentrated: corresponding to 1.019.878 people. Similarly, 8 municipalities located at the Pacific zone, corresponding to 12, 5% of the total of the municipalities are not connected by roads, where there is no coverage for 132.543 people corresponding to 9, 71% of the total of the department population.
SOURCE: own elaboration.
FIGURE 6 Cumulative frequency curve % of municipal frequency, route factor indicator, road density indicator.
For the integral road factor indicator, it was determined that 27 municipalities (42, 18 %) are classified within irregular network with a R i between 1.5 - 2.0, that covers a population of 872.924 people corresponding to 63, 98 %. Likewise, it was identified that 29 Municipalities (45,31 %) have an R i higher than 2, 0 which corresponds to a tortuous network, since they are zones with an uneven topography (mountainous) located at east-centre of the department. It should be noted that these areas have a population of 358.904 residents (26, 31 %).
3.4 Data exploratory analysis
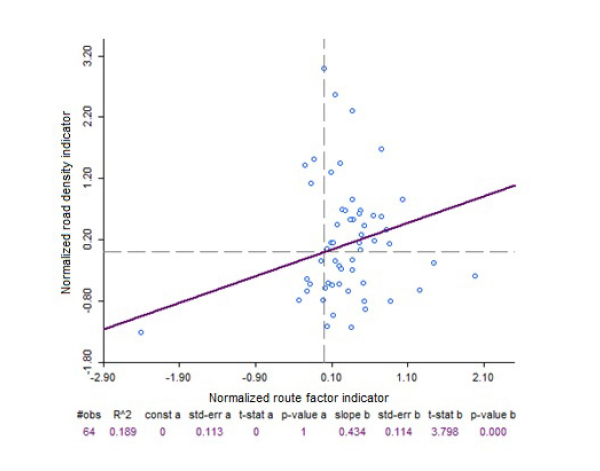
By using standardized dispersion diagrams, the relationship between the results of the calculated indicators can be represented, which makes it possible to identify the degree of correlation or association between the normalized variables. The results can be seen in the figure 7.
SOURCE: own elaboration, software GeoDa
FIGURE 7 Standard variable dispersion diagram, Road density Indicator - Route Factor Indicator.
As seen in figure 7, the value and sign of the correlation coefficient represented by the slope indicates that there is a weak positive lineal relationship (0,434); in other words, the grade of lineal association between the road density indicator and the route factor indicator is low. According to the results, there are 6 municipalities that correspond to 10, 71 % of the total, located in the south and east that have the best results in the route factor indicator regarding the rest, considering that for this case the lowest values are those with the best quality in the layout and network efficiency, these municipalities also have the lowest values in the density road indicator. Likewise, there are 4 municipalities (7,14 %) located in the south of the department, which results for the route factor indicator are low, that represents good conditions of accessibility, meaning that they have a high-density indicator. Also, it can be seen that there are 26 Municipalities (43,43 %) located in the east-central zone that have high values for the route factor, representing low levels of accessibility which means major deficiencies in quality and efficiency of the network layout, they have a high road density. Finally, there are 20 municipalities (35, 71 %) located in the central zone, that have high values for the route factor (low accessibility) and high values for the road density.
On one hand, according to the results obtained, it can be stated that the more communication routes and the less area of the analysis zone, an increase in the density values of roads is assumed. In the study by (Zuluaga & Escobar, 2017) similar observations were obtained, such as higher road density in the Andina zone and low values in the Pacific region, which is consistent with the results obtained in this study, where the areas that presented higher values in the indicator of road density were the municipalities located at high elevations and, lower density in the municipalities of low elevations that border the Pacific Ocean. On the other hand, the route factor indicator establishes the relationship between the distance from the network and the distance in a straight line, taking into account that if this relationship has values close to 1, better quality and efficiency conditions will be obtained. The network, also considering that values greater than 2 describe mountainous and steep areas, where there will be low levels of quality and efficiency in the layout of the network. The Nariño department is found in its greatest extension in the mountainous area, with a network layout of 64 % categorized as tortuous, observations similar to those made by Baradaran & Ramjerdi (Baradaran & Ramjerdi, 2001), where European cities settled in areas with rough topography obtained high scores in this indicator, indicating low accessibility. It is also worth mentioning the study of the assessment of road accessibility in Peninsular Spain (Lopez et al., 2016), in which it is mentioned according to the results obtained that mountainous areas generally show a very poor accessibility situation, which is consistent with the results of this analysis. Similarly, in the study of the evaluation of potential areas for distribution centres (Goyes Chaves et al., 2022) the special coffee producing areas that have deficiencies in geographic accessibility were identified, showing that the producing areas located in the East and North, present high values in the integral route factor indicator with values greater than 2 that corresponds to tortuous networks, results that agree with those obtained in this research.
Finally, it is important to mention that the research carried out takes road transport into account, so it does not include municipalities that do not have a road network located in the north, bordering the Pacific Ocean, being a limitation for the study. For future lines of research, it is proposed to consider an intermodal network by adding local maritime transport (cabotage), which allows incorporating zones without connection.
4. CONCLUSIONS
In this research a methodologic procedure was implemented that allowed to evaluate the conditions of accessibility of the different zones that are part of the Nariño department, by using indicators based on infrastructure, such as the road density indicator and the route factor indicator, in which the zones that have advantages and disadvantages were identified regarding the development of the road configuration, the quality and the layout efficiency of the transportation network.
It can be concluded according to the results obtained that the southern area presents better accessibility conditions regarding the development of the configuration of the transportation network and the quality and efficiency of its layout. For its part, the central and northern areas of the department have greater disadvantages in terms of spatial accessibility, where it should be noted that while the Central area is characterized by high mountain topography and steep slopes, the Pacific area lacks transportation infrastructure, which makes the possibilities of penetration from these areas to other municipalities much more difficult. This situation reflects a social gap, especially in the Pacific zone in relation to the other zones of the department. In the western part there are intermediate accessibility conditions, although it has good efficiency and quality of the network layout, according to the results of the route factor indicator, it has low road density.
Objectively, it was possible to show that it is possible to evaluate the accessibility conditions of any municipality of the department, previously analysing the scope, impacts and improvement of accessibility conditions in the face of a probable action on the transportation network, with a view to the identification of access inequalities. The evaluation of accessibility indicators based on infrastructure, with the support of technological tool systems such as GIS, facilitate spatial analysis, being an important tool for the planning, prioritization and management of transportation infrastructure projects, being an instrument for the organization and planning of improvements for the development of the regions.
It's important to highlight that the indicator of road density is not always an accurate measurement since the indicator distributes the phenomenon to analyse in a homogenous way over the surface and it does not consider deficiencies on the route layout, where on the mountainous zones the number of the network kilometres increases, considering that quantity in many cases doesn't mean quality. This indicator is related to the shapes and life quality levels of the population in the regions as the road network is known as an affordable way of communication, transportation of goods, people, services, and information.
For the development of this type of analysis, it was found that the main difficulty is access to updated information on the transportation infrastructure network, although it is true that the government entities have a robust network, it was necessary to complement it with other sources of open access data, such as Openrouteservice, in order to have a more complete network and fundamental basis for the reliability of the results obtained.
For future research, we can mention considering the modelling of new scenarios, incorporating new connections between nodes and making a comparison with the baseline, represented by the existing infrastructure network, such as including an intermodal network, adding local maritime transport (cabotage), considering the disconnected zones in the new model. In the same way, the results can be related to socioeconomic variables, such as the relationship with the gross domestic product at the municipal level and analyse whether the areas with the greatest infrastructure development are those with the greatest economic development and vice versa. Likewise, as future research, it is proposed to make a comparison of accessibility levels with neighbouring Departments and relate their results to regional competitiveness indicators. Also consider the use of other types of more specific indicators, such as analysing different modes of transport, taking into account the speed of operation, which directly affects travel times.

