


Serviços Personalizados
Journal
Artigo
 Inglês (pdf)
 Artigo em XML
 Referências do artigo
 Enviar este artigo por email
Indicadores
-
 Citado por SciELO
 -
 Acessos
Links relacionados
-
 Citado por Google
 -
 Similares em
SciELO
Similares em
SciELO -
 Similares em Google
Compartilhar

 Permalink
Revista U.D.C.A Actualidad & Divulgación Científica
versão impressa ISSN 0123-4226
rev.udcaactual.divulg.cient. vol.16 no.1 Bogotá jan./jun. 2013
CIENCIAS AGROPECUARIAS-Artículo Científico
DRIS NORMS FOR THE RUBBER CLONE FX3864 IN THE EASTERN PLAINS OF COLOMBIA
NORMAS DRIS PARA CAUCHO CLON FX3864 EN LOS LLANOS ORIENTALES DE COLOMBIA
Edinson Chacón-Pardo1, Jesús H. Camacho-Tamayo2*, Jaime H. Bernal3
1 I.A., M.Sc. Universidad Pedagógica y Tecnológica de Colombia, Facultad de Ciencias Agropecuarias, Grupo de Investigaciones Agrícolas, Tunja, Colombia. E-mail: echaconp@unal.edu.co
2 I. Agrícola, M.Sc. Profesor Asistente. Facultad de Ingeniería, Programa de Ingeniería Agrícola, Universidad Nacional de Colombia. Cra. 45 No. 45 - 03, Bogotá, Colombia. E-mail: jhcamachot@unal.edu.co *Corresponding author
3Corporación Colombiana de Investigación Agropecuaria - CORPOICA, C.I. La Libertad, Villavicencio, Colombia. E-mail: jbernal@corpoica.org.co
Rev. U.D.C.A Act. & Div. Cient. 16(1): 113 - 120, 2013
SUMMARY
The present study aimed to establish the preliminary diagnosis and recommendation integrated system (DRIS) norms for the rubber tree clone FX3864 (Hevea brasiliensis) under the conditions of the Colombian Eastern Plains for the elements N, P, K, Ca, Mg, Na, S, Fe, Cu, Zn and B. For this purpose, 77 foliar samples were taken from a 10- to 12-year-old commercial crop. The element ratios that contributed the greatest variance between high- and low- productivity populations were selected for conversion into norms. Of the 132 possible ratios, 66 were selected, with ratios including P/N, N/K and NXCa proving most important. The most limiting nutrients were K and N when deficient and Ca and S when in excess.
Key words: Foliar analysis, mineral nutrition, diagnosis and recommendation, fertilization.
RESUMEN
El objetivo del presente trabajo fue obtener las normas preliminares de diagnóstico y recomendación integral DRIS para el cultivo de caucho clon FX3864 (Hevea brasiliensis) bajo condiciones de la altillanura colombiana para los elementos N, P, K, Ca, Mg, Na, S, Fe, Cu, Zn y B, para ello se tomaron 77 muestras de tejido foliar de plantaciones comerciales con edades entre 10 y 12 años. Para la selección de las relaciones que se convirtieron en normas se utilizó el método de mayor relación entre varianzas entre la población de baja productividad sobre la de alta productividad. De las 132 relaciones posibles se seleccionaron 66, destacándose relaciones como P/N, N/K, NXCa. El nutriente más limitante es el K seguido del N por defecto y el Ca seguido del S por exceso.
Palabras clave: Análisis foliar, nutrición mineral, diagnóstico y recomendación, fertilización.
INTRODUCTION
The eastern plains of Colombia extend from the town of Puerto López (Meta) to the source of the Orinoco River. This area has a high agricultural potential, with an estimated 4.5 million potentially arable hectares (Rivas et al. 2004). Agricultural projects are being developed in the region with the hope of introducing crops such as soybean, sugarcane, oil palm and rubber, among others, as alternative crops for owners of both small and large farms.
In this region, rubber is principally found in the municipality of Puerto López, where there are commercial plantations in the productive and (primarily) growing stages. These plantations are managed at the nutritional level with fertilizer applications based on research from countries such as Malaysia, Brazil and India (DANE, 2010). This previous research was specific to the production zones in which it was conducted, and its applicability depends on the clone type, plant population, soil characteristics and environmental resources of the plantation. Therefore, although production in the eastern plains of Colombia is not low (approximately 1800 kg ha-1 y r-1), it could be improved by determining the specific fertilization requirements for the particular soil conditions of the area.
The diagnosis and recommendation integrated system (DRIS) is a tool for correctly interpreting foliar analysis under these conditions. DRIS was proposed by Beaufils (1973), based on research into plant physiology and nutrition, as an alternative to the nutritional evaluation of crops. In contrast to approaches such as the critical-value or range-of-sufficiency methods, DRIS is based on the utilization of nutrient ratios instead of absolute or individual concentrations. Some ratios among nutrients are more important than others for a specific crop, and these can be identified in high-productivity populations when compared to low-productivity populations, which nonetheless also occasionally display ideal or optimal ratios, as reported by Wadt & Dias (2012).
DRIS was initially developed using rubber crops in Vietnam, and subsequent refinements of the method were conducted in sugar cane and corn crops in South Africa by Beaufils (1973). At present, DRIS norms have been developed for crops such as roses, coffee, apples and citrus fruits, among others (Nachtigall & Dechen, 2007).
The DRIS method studies nutrient concentrations in the leaves of a crop to establish the interactions between pairs of nutrients, then uses the interactions observed in a highyielding population as references to develop norms (Mourão Filho, 2004). This method is based on the estimation of an index for each pair of nutrients (Dias et al. 2010a). DRIS norms are used for the nutritional evaluation of a low-yielding population, employing mathematical formulas derived from different DRIS functions (Beaufils, 1973; Jones, 1981; Wadt et al. 2007).
DRIS has advantages over other diagnostic methods because it generates an easily interpreted continuous scale, allows for the classification of nutrients from the most deficient to the most excessive, detects cases of yield limitation due to nutrient imbalances (including when no nutrients are below the critical level) and allows for a total nutritional diagnosis of the plant through the nutritional balance index (Huang et al. 2012).
Once the norms are established, DRIS indices are calculated for each nutrient. A negative index signifies that the element in question is deficient; if the index is positive, the element is present in excess; and if the index is near zero, the nutrient is present at an adequate or balanced level in the plant. The present study aims to establish the DRIS norms for the rubber crop clone FX 3864 under the conditions of the eastern plains of Colombia.
MATERIALS AND METHODS
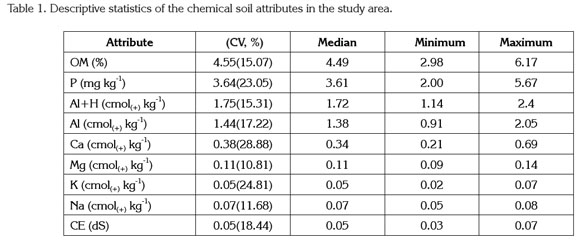
Study area. The study was conducted in the town of Puerto López in the province of Meta, Colombia, in a 10-year-old commercial rubber plantation located at 40°5'46''N, 72°57'30''W and an altitude of 184 m. The soil is an Inseptic Hapludox, characterized by a high aluminum saturation and a low base saturation. The predominant texture is sandy loam. The chemical characteristics of the soil are shown in table 1.
Foliar and yield sampling. During the month of July 2010, recently matured leaves from the third medium plant were sampled. Sampling occurred between 06:00 and 10:00 of each day to reduce diurnal nutritional variability, according to the methodology proposed by Malavolta et al. (1997). In total, 80 samples were taken. The samples were prepared by removing the petioles, and the films were washed with tap water and dried in a cool environment before being sent to the laboratory.
The foliar samples were taken to the laboratory and, by means of dry digestion and atomic absorption, the elements K, Ca, Mg, Na, K, Fe, Cu, Mn and Zn were determined. In a similar manner, the colorimetric method was used to determine P and B; as well as wet digestion and the Kjeldahl method for N and turbidimetry for S.
Three latex measurements were conducted in the field to establish productivity. These measurements were taken in June, September and December, coinciding with the periods of high, medium and low precipitation, respectively, because the productivity of rubber is highly related to the water state of the plant (Ribeiro & Cássia, 2006). These measurements were made on the same trees from which the foliar samples were taken.
Samples without productivity information or with a productivity of zero were eliminated from the study. Information regarding the planting date, area and production of each of the remaining analyzed lots was compiled.
Data analysis. Populations were separated using the descriptive statistics described by Wadt et al. (1999): samples in the highest quartile of productivity, averaged over the three latex measurements, were considered to represent high productivity, and those below that quartile were considered to represent low productivity.
DRIS norms. After the populations were selected, the coefficients of variation, minima, maxima and variances for each element, as well as the ratios between each element, were calculated in both the high- and low-productivity populations. The element ratios that contributed the greatest variance between high- and low-productivity populations were selected for conversion into norms, as proposed by Summer (1990), who stated that
If [s2 (A/B)b / s2 (A/B)r]> [s2 (B/A)b / s2 (B/A)r], then the norm and the relationship chosen ratio = A/B;
If [s2 (A/B)b/ s2 (A/B)r] <[s2 (B/A)b / s2 (B/A)r], then, the norm and the relationship chosen ratio = B/A;
where s2 (A/B)r is the difference of the ratio between the variances of the concentrations of the nutrients A and B in the reference population (r) and s2 (A/B)b is the difference of the ratio between the variances of the concentrations of the nutrients A and B in the low-productivity population (b).
Nutritional balance index. The nutritional indices (NI) were calculated using the methodology proposed by Beaufils (1973):
If A/B <a/b, then
f(A/B) = (A/B - a/b)/ sa/b x (a/b / A/B);
otherwise,
f(A/B) = (A/B - a/b)/ sa/b,
where f(A/B) is the DRIS function for any two nutrients (A and B), A/B is the ratio between nutrients A and B in the sample, a/b is the ratio between nutrients A and B in the reference standard and sa/b is the standard deviation of ratio A/B from the reference standard.The sum of the values for the modulus of the NI of all nutrients constituted the nutritional balance index (NBI), and the nutrient average balance index (IBNm) was obtained by dividing this value by the number of NBI nutrients according to the expression IBNm = (lNI_A&l+ lNI_Bl + lNI_Cl+...+ lNI_Nl/n, using as samples the averages of the lowyield population (Dias et al. 2011; Sánchez et al. 2009).
RESULTS AND DISCUSSION
Foliar description and population separation. The median values of N and K were deficient, at 2.85% and 0.67%, respectively (Table 2); the median value of P was at an adequate level of 0.27%. These conclusions are based on the values reported by Pushparajah & Teng (1972), who observed that the content of N in rubber leaves on the basis of dry mass is between 3.30% and 3.70%, that of P is between 0.209% and 0.25% and that of K is between 1.30% and 1.60%.
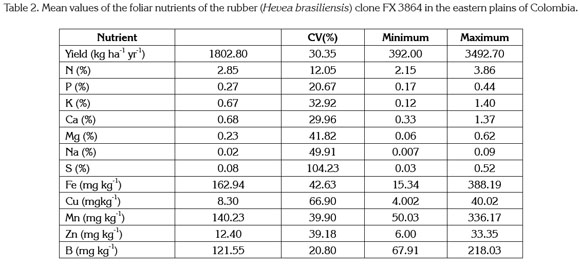
After eliminating those samples without complete productivity information from the database, 77 samples remained, exhibiting a normal distribution. The medium productivity of these samples was 1802.8 kg ha-1 y r-1, with a minimum of 392.0 kg ha-1 y r-1 and a maximum of 3492.7 kg ha-1 yr-1. These results suggest that the samples adequately represent the variation of the study area, a requirement for the development of DRIS norms (Maia, 2012).
The most productive quartile, the high-productivity/reference population, contained 19 of the 77 samples, with a minimum production threshold of 2183.4 kg ha-1 yr-1 (Table 3); 58 ofthe 77 samples were below this threshold and made up the low-productivity population. This division meets the criterion of Reis Junior &Monnerat (2003), who suggested that the high-productivity population should consist of at least 10% of the samples.
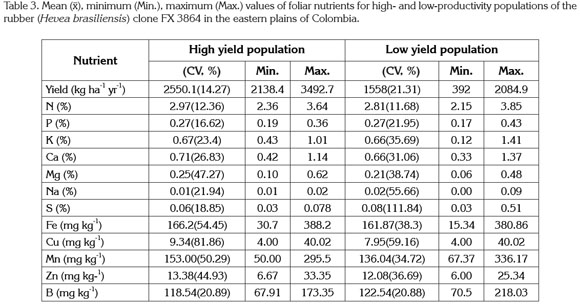
The median nutrient concentrations of N, K, Ca and Mg, among others, were greater in the high-productivity population; concentrations were similar between populations for P and greater in the low-productivity population for B and S. Because foliar analysis was conducted at the peak of production, elements such as N, Ca and Mg may have been in greater demand for latex formation than the other elements in the study.
Nutrient concentrations for the high-yield population were, in general, lower than those reported by Flores et al. (2004) in a study conducted in Venezuela on the clones IAN 873, IAN 710 and FX 3864, with the exception of Ca. The levels detected in the present study were, however, in agreement with those reported by Bataglia et al. (1988) for rubber trees in Brazil, with a production level greater than 1500 kg ha-1 yr-1. Both that study and the present study reported lower levels of N and P and higher levels of Mg than those suggested by Pushparajah & Teng (1972) to be adequate for the development of rubber in Malaysia. It must be considered that, according to the type of material and its genetics, nutrient contents vary to greater or lesser degrees (Mendes et al. 2012), and although previous studies provide reference levels, it is possible that plants exhibit different nutrient requirements depending on their different growing conditions (Bataglia et al. 1998; Nguyen, 2013).
DRIS norms. The respective norms of the high- and low- productivity populations were determined as coefficients or products, whichever was more appropriate in each case (Table 4). The coefficients of variation were highest for the ratios involving Fe, Cu and S. This result is due to the high coefficients of variation for these elements in the global database (Table 2), a situation that is generally true for the determination of DRIS norms, as reported by different authors (Nachtigall & Dechen, 2007). Flores et al. (2004) concluded that this situation does not complicate the interpretation of the norm, as the coefficient values represent the real variation that exists for the nutrient contents of rubber populations with average yield.
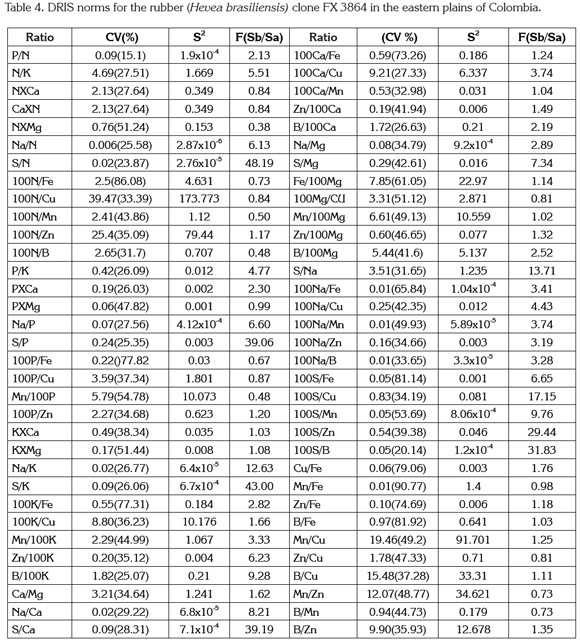
The norms obtained for the ratios and products of the elements were selected based on which contributed the greatest variance between the high- and low-productivity populations. Of the 132 possible ratios, 66 were selected, with ratios including P/N, N/K and NXCa proving most important. These ratios exhibited clear differences with the results of previous research on rubber trees conducted by Flores et al. (2004): for example, the P/N ratio was 0.07 in the Flores study and 0.09 in the present study, indicating greater quantities of P for the high-yield population in the present case. Bataglia & Santos (1999) concluded that low levels of P in the soil and leaves negatively affect the productivity of rubber trees in soils of otherwise high fertility.
For the N/K and NXCa ratios, Flores et al. (2004) obtained values of 6.67 and 1.07, respectively, whereas the values obtained in the present study were 4.69 and 2.13, respectively. Norms can vary significantly from one region to another, as has been previously reported (Dias et al. 2010b; Partelli et al. 2006). Bolton (1964) acknowledged these differences when he reported that the N, P and K standards for rubber obtained in Vietnam were inadequate for application in Ma- laysian plantations due to their improper balance for high- production populations.
The ratios involving K in the present study were either higher or lower than those reported by Flores et al. (2004), depending on K's role as either a numerator or denominator, respectively. Higher levels of K overall were observed in the leaves of the present study, a difference that may impact productivity.
Nutritional balance index. Once the DRIS norms were established, the nutritional diagnosis was conducted by calculating the DRIS indices for each nutrient (Table 5) and establishing the nutritional balance indices (NBI), grouping them from the most to the least limiting and using as samples the averages of the low-yield population, as has been proposed for coffee (Wadt & Dias, 2012), cupuaçu (Dias et al. 2011) and orange (Dias et al. 2013) in the Brazilian Amazon region.
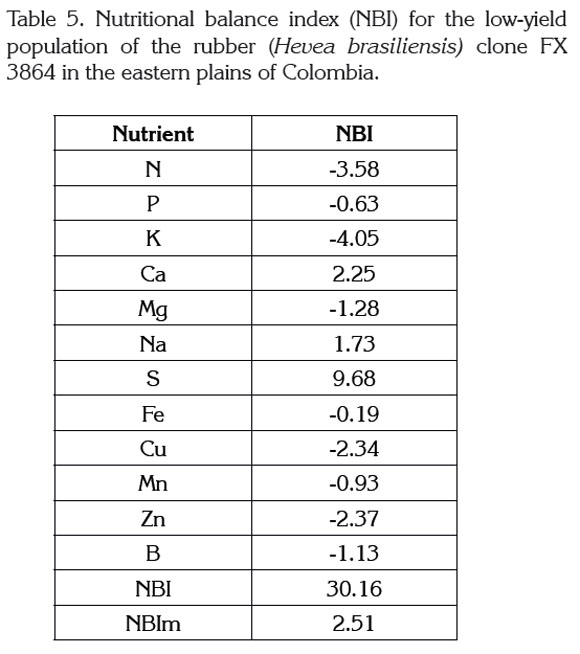
Wadt et al. (1999) and Wadt (2005) stated that if the NI of an element is greater than the NBIm, it is possible to generate a productivity response by adjusting levels of that element. Elements such as N and K, for example, would cause higher productivity when added, whereas the restriction of elements such as S would lead to higher productivity.
In addition, the nutritional balance of the sample was calculated, and the order of nutrients in terms of importance was K>N>Cu>Zn>Mg>B>Mn>P>Fe>Na>Ca>S.
These results suggest that, for the case of the low-yield population, the most limiting nutrients were K and N when deficient and Ca and S when in excess. These results are concordant with the levels found in the low-productivity population (Table 3) and support the results of Bataglia et al. (1998), who found that low contents of K and high contents of Ca induced deficiencies of K and N in rubber, respectively, negatively influencing its productivity.
DRIS norms were established for a rubber crop on the eastern plains of Colombia based on 66 nutrient ratios. These norms supply a tool for interpreting the nutritional state of a rubber crop based on foliar analysis. The most limiting element under the study conditions is K. The obtained norms establish the differences between highand low-productivity populations, indicating which elements and factors should be considered for future crop management.
Acknowledgements: The authors thank the "Ministerio de Agricultura y Desarrollo Rural" of Colombia for financial support and Mavalle S.A. for logistical support. Conflicts of interest: The manuscript was prepared and reviewed with the participation of all authors, who declare the absence of conflicts of interest that jeopardize the validity of the results presented.
BIBLIOGRAPHY
1. BATAGLIA, O.C.; CARDOZO, M.; VISCAINO, C.M. 1988. Situação nutricional de seringais produtivos no estado de São Paulo. Bragantia. (Brazil) 47(1):109-123. [ Links ]
2. BATAGLIA, O. C.; SANTOS, W. R. 1999. Efeitos da adubação NPK na fertilidade do solo, nutrição e crescimento da seringueira. Rev. Bras. Ciênc. Solo. (Brazil). 23(4):881-890. [ Links ]
3. BATAGLIA, O.C.; SANTOS, W.R.; IGUE, T.; GONÃALVES, P.S. 1998. Resposta da seringueira clone RRIM 600 à adubação NPK em solo Podzólico Vermelho Amarelo. Bragantia. 57(2):367-377. [ Links ]
4. BEAUFILS, E.R. 1973. Diagnosis and recommendation integrated system (DRIS). University of Natal (Bloemfontein, South Africa). 132p. [ Links ]
5. BOLTON, J. 1964. The manuring and cultivation of Hevea brasiliensis. J. Sci. Fd. Agric. (USA). 15(1):1-8. [ Links ]
6. DANE - Departamento Administrativo Nacional de Estadística. 2010. Informe de resultados del censo de unidades productoras de plantaciones de caucho -UPPC. DANE, Dirección de Regulación, Planeación, Estandarización y Normalización (Colombia). 66p. [ Links ]
7. DIAS, J.R.M.; PEREZ, D.V.; SILVA, L.M.; LEMOS, C.O.; WADT, P.G.S. 2010a. Normas DRIS para cupuaçuzeiro cultivado em monocultivo e em sistemas agroflorestais. Pesq. Agropec. Bras. 45(1):64-71. [ Links ]
8. DIAS, J.R.M.; WADT, P.G.S.; PEREZ, D.V.; SILVA, L.M.; LEMOS, C.O. 2011. DRIS formulas for evaluation of nutritional status of cupuaçu trees. Rev. Bras. Ciênc. Solo. (Brazil). 35(1):2083-2091. [ Links ]
9. DIAS, J.R.M.; WADT, P.G.S.; SAMPAIO, F.A.R.; PITTELKOW, F.K.; MIOTTI, A.A.; ROSA, M.R. 2010b. Estabelecimento de normas DRIS para cupuaçueiro na região amazônica. Rev. Caatinga. (Brazil). 23(4):121-128. [ Links ]
10. DIAS, J.R.M.; WADT, P.G.S.; TUCCI, C.A.F.; SANTOS, J.Z.L.; SILVA, S. V. 2013. Normas DRIS multivariadas para avaliação do estado nutricional de laranjeira âPera' no estado do Amazonas. Rev. Ciênc. Agron. (Brazil). 44(2):125-134. [ Links ]
11. FLORES, J.A.; GARAY, V.J.; PEÑA, C. 2004. Evaluación Nutricional de Plantaciones de Hevea brasiliensis Muell. Arg., Sector El Pozo, San Fernando de Atabapo, Estado Amazonas, Venezuela. Rev. For. Lat. (Venezuela). 19(2):83-107. [ Links ]
12. HUANG, H.; HU, C.X.; TAN, Q.; HU, X.; SUN, X.; Bi, L. 2012. Effects of Fe-EDDHA application on iron chlorosis of citrus trees and comparison of evaluations on nutrient balance with three approaches. Sci. Hortic. (USA). 146(1):137-142. [ Links ]
13. JONES, W.W. Proposed modifications of the diagnosis and recommendation integrated system (DRIS) for interpreting plant analyses. Comm. Soil Sci. Plant Anal., 12:785-794, 1981. [ Links ]
14. MAIA, C.E. 2012. Fertilization response likelihood for the interpretation of leaf analyses. Rev. Bras. Ciênc. Solo. 36(2):437-445. [ Links ]
15. MALAVOLTA, E.; VITTI, G. C.; OLIVEIRA, S. A. 1997. Avaliação do estado nutricional das plantas: princípios e aplicações. 2a. Edição. Potafos (Piracicaba, Brazil). 319p. [ Links ]
16. MENDES, A.D.R.; OLIVEIRA, L.E.M.; NASCIMENTO, M.N.; REIS, K.L.; BONOME, L.T.S. 2012. Concentração e redistribuição de nutrientes minerais nos diferentes estádios foliares de seringueira. Acta Amaz. (Brazil). 42(4):525-532. [ Links ]
17. MOURÃO-FILHO, F.A.A. DRIS: 2004. Concepts and applications on nutritional diagnosis in fruit crops. Sci. Agric. (Brazil). 61(5):550-560. [ Links ]
18. NACHTIGALL, G. R.; DECHEN, A. R. 2007. DRIS norms for evaluating the nutritional state of apple tree. Sci. Agric. 64(3):282-287. [ Links ]
19. NGUYEN, B.T. 2013. Large-scale altitudinal gradient of natural rubber production in Vietnam. Ind. Crop Prod. (USA). 41:31-40. [ Links ]
20. PARTELLI, F.L.; VIEIRA, H.D.; MONNERAT, P.H.; VIANA, A.P. 2006. Estabelecimento de normas DRIS em cafeeiro conilon orgÂnico e convencional no estado do Espírito Santo. Rev. Bras. Ciênc. Solo. 30(1):443-451. [ Links ]
21. PUSHPARAJAH, E.; TENG, T.K. 1972. Factors influencing leaf nutrient levels in rubber. In: Proceedings of the R.R.I.M. Malaya Planters Conference, Kuala Lumpur 1972. Rubber Research Institute of Malaya, Kuala Lumpur. p.140-154. [ Links ]
22. REIS JÚNIOR, R.A.; MONNERAT, P.H. 2003. DRIS norms validation for sugarcane crop. Pesq. Agropec. Bras. 38(3):379-385. [ Links ]
23. RIBEIRO, J.C.; CÁSSIA, C.E. 2006. Fotossíntese e relações hídricas de duas cultivares jovens de seringueira. Rev. Bras. Bot. 29(4):701-708. [ Links ]
24. RIVAS, L.; HOYOS, P.; AMEZQUITA, E.; MOLINA, D.L. 2004. Manejo y uso de suelos en la altillanura Colombiana. Análisis económico de una estrategia para su conservación y mejoramiento: construcción de una capa arable. CIAT (Cali, Colombia). 9p. [ Links ]
25. SÁNCHEZ, A.A.; CRUZ, J.G.; ZÉREGA, L.; RODRÍGUEZ, O.; DE OLIVEIRA, S.A., PÉREZ VIANEL, J. 2009. Normas preliminares DRIS desarrolladas para caña de azúcar a partir de un bajo número de muestras. Pesq. Agropec. Bras. 44(12):1700-1706. [ Links ]
26. SUMMER, M. 1990. Advances in the use and Application of Plant Analysis.Com. Soil Sci. Plant Anal. (USA). 21(13-16):1409-1430. [ Links ]
27. WADT, P.G.S. 2005. Relationships between soil class and nutritional status of coffee plantations. Rev. Bras. Ciênc. Solo. 29(2):227-234. [ Links ]
28. WADT, P.G.S.; DIAS, J.R.M. 2012. Normas DRIS regionais e inter-regionais na avaliação nutricional de café Conilon. Pesq. Agropec. Bras. 47(6):822-830. [ Links ]
29. WADT, P.G.S.; NOVAIS, R.F; ALVAREZ, H.H.; BRAGANCA, S.M. 1999. Alternativas da aplicação do DRIS á cultura do café conilon (Coffea canepora Pierre). Sci. Agric. (Brazil). 56(1):83-92. [ Links ]
30. WADT, P.G.S.; SILVA, D.J.; MAIA, C.E.; TOME JUNIOR, J.B.; COSTA PINTO, P.A.; MACHADO, P.L.O.A. 2007. Modelagem de funções no cálculo dos índices DRIS. Pesq. Agropec. Bras. 42(1):57-64. [ Links ]
Received: 12 October 2012 Accepted: 6 February 2013
