


Services on Demand
Journal
Article
 English (pdf)
 Article in xml format
 Article references
 Send this article by e-mail
Indicators
-
 Cited by SciELO
 -
 Access statistics
Related links
-
 Cited by Google
 -
 Similars in
SciELO
Similars in
SciELO -
 Similars in Google
Share

 Permalink
Revista U.D.C.A Actualidad & Divulgación Científica
Print version ISSN 0123-4226
rev.udcaactual.divulg.cient. vol.18 no.1 Bogotá Jan./June 2015
CIENCIAS EXACTAS Y NATURALES-Artículo Científico
DISTRIBUTION AND ABUNDANCE OF Oncaea media AND O. venusta (CRUSTACEA: COPEPODA) IN THE COLOMBIAN PACIFIC OCEAN DURING TWO PERIODS IN 2001
DISTRIBUCIÓN Y ABUNDANCIA DE Oncaea venusta Y O. media (CRUSTACEA: COPEPODA) EN EL PACÍFICO COLOMBIANO DURANTE DOS PERIODOS EN 2001
Raúl Hernando López1*, Luz Helena Mojica2
1 Marine Biologist, D. rer. nat., Assistant Profesor, Laboratorio de Hidrobiología, Facultad de Ciencias Básicas y Aplicadas, Programa de Biología Aplicada, Campus Nueva Granada, Universidad Militar Nueva Granada, km 2 vía Cajicá-Zipaquirá, Colombia, *Autor para correspondencia, e-mail: raul.lopez@unimilitar.edu.co
2Marine Biologist, Research Assistant, Laboratorio de Hidrobiología, e-mail: lhml1987@gmail.com
Rev. U.D.C.A Act. & Div. Cient. 18(1): 197-206, Enero-Junio, 2015
SUMMARY
Zooplankton of the Colombian Pacific Ocean was investigated during June-July (2001a) and August-September (2001b). Since Oncaea venusta and O. media predominated in the copepod community, their distribution and abundance were evaluated. Organisms were extracted from surface mesozooplankton samples taken with a conic net (50cm opening, 363µm mesh). Both species were widely distributed with highest abundances mainly in neritic waters (3°-5°N). Factor analysis revealed negative and positive correlations among abundances and abiotic variables depending on each period. Cluster analysis showed three groups in 2001a and five ones in 2001b, essentially consistent with night and day abundances, and thermocline depth and width suggesting the influence of these factors on O. venusta and O. media. In future analysis it may be necessary to consider the different forms of O. media and O. venusta to establish the importance of phytoplankton and other organisms in their diet. Higher night or day abundances allude to the possible diel vertical migration of these microcrustaceans to the surface. The decrease in the general abundance of O. venusta from 2001a to 2001b (66.4% to 47.5%) contrasted with the increase of O. media (33.6% to 52.5%). These changes could be explained by the different biological response of both species to short-term variability in oceanographic conditions and the occurrence of a weak La Niña event.
Key words: Oncaeidae, micro-crustacea, Colombian Pacific, thermocline.
RESUMEN
Se investigó el zooplancton del océano Pacífico colombiano durante junio-julio (2001a) y agosto-septiembre (2001b). Puesto que Oncaea venusta y O. media predominaron en la comunidad de copépodos, se evaluó su distribución y abundancia. Los organismos se extrajeron de muestras de mesozooplancton, tomadas en la superficie, con una red cónica (50cm de apertura, malla 363µm). Ambas especies se distribuyeron ampliamente con las mayores abundancias, en especial, en aguas neríticas (3°-5°N). El análisis factorial reveló correlaciones negativas y positivas entre las abundancias y las variables abióticas, según el período de estudio. El análisis de agrupamiento mostró tres grupos, en 2001a y cinco, en 2001b, dependientes, principalmente, de las abundancias diurnas y nocturnas y la profundidad y amplitud de la termoclina, sugiriendo la influencia de estos factores sobre Oncaea venusta y O. media. En análisis futuros es necesario considerar las diferentes formas de O. venusta y O. media, para establecer la importancia del fitoplancton y otros organismos en la dieta de las dos especies. Las mayores abundancias nocturnas o diurnas aluden a la posible migración vertical de estos microcrustáceos a la superficie. La disminución en la abundancia general de O. venusta de 2001a a 2001b (66.4% a 47.5%) contrastó con el incremento de O. media (33.6% a 52.5%). Estos cambios, se podrían explicar por la diferente respuesta biológica de las dos especies a la variabilidad, a corto plazo, en las condiciones oceanográficas y el acaecimiento de un episodio débil de La Niña.
Palabras clave: Oncaeidae, microcrustáceos, Pacífico colombiano, termoclina.
INTRODUCTION
Copepods are aquatic arthropods considered the most abundant and ubiquitous metazoans in the world (Turner, 2004). Oncaeidae is one of the families with the largest amount of marine pelagic species (>100) (Boxshall & Halsey, 2004) and dominates numerically copepod communities in many marine areas (Böttger-Schnack, 1996; 1997; Fazeli et al. 2012). Oncaea media Giesbrecht, 1891 and O. venusta Philippi, 1843 are cosmopolitan mesozooplankters (>1.0mm in body length) that inhabit the surface to bathypelagic depths (Böttger-Schnack, 1996; 1997; Nishibe et al. 2009), mainly from 0 to 500m (epi-mesopelagic). O. venusta is also demersal and semi-parasitic (Nishibe et al. 2009; Böttger- Schnack, 2010a; 2010b). These species also exhibit diel vertical migration (Lo et al. 2004; Itoh et al. 2014). In the eastern tropical Pacific Ocean O. media and O. venusta figure among the most abundant species (López-Ibarra et al. 2014).
Oncaeidae copepods feed mainly on phytoplankters and protists. Due to their high densities and substrate-feeding behavior, O. venusta and O. media, and other species may play important roles in biogenic fluxes (Turner, 2004) and trophic dynamics considerably, different from suspension- feeding calanoids (Nishibe et al. 2009).
Due to its importance, various topics of the copepod community have been studied along the Eastern Pacific (Böttger-Schnack, 2010a; 2010b; López-Ibarra et al. 2014), for instance in USA (Fiedler, 1983; Choi et al. 2005); Costa Rica (Morales, 1996; 2001), México (Hernández-Trujillo et al. 2004; López-Ibarra et al. 2006; Palomares-García et al. 2013); Ecuador (Prado & Cajas, 2009; Coello et al. 2010; Tutasi et al. 2011); Peru (Smith et al. 1971; Santander et al. 1981; Criales- Hernández et al. 2008) and Chile (Hirakawa, 1989; Escribano & Hidalgo, 2000; Hidalgo et al. 2010; 2012).
In the Colombian Pacific Ocean (CPO) these organisms have been considered in general zooplankton studies (Giraldo & Gutiérrez, 2007; López, 2012; Jaimes & López, 2014) and only a list of species has been published (Monsalve, 1976).
The goal of this manuscript was to evaluate the influence of salinity, temperature, thermocline, and chlorophyll-a on populations of O. media and O. venusta in the CPO in 2001. Night: Day variations of the abundance are additional data used in the analysis.
MATERIALS AND METHODS
Study area. The CPO (01°30"-07°10"N-77°40"-82°00"W) is part of the Panama Basin, located off the Pacific coasts of Panama, Colombia, and Ecuador (Figure 1). Hydrodynamic and thermohaline conditions are defined by solar radiation, wind distribution, rainfall pattern, freshwater run-off, and the variations of the Humboldt Current and the Equatorial Countercurrent. These conditions are influenced by the Intertropical Convergence Zone displacement and El Niño and La Niña events (CCCP, 2002; Kessler, 2006; Villegas & Málikov, 2006; Corredor et al. 2011).
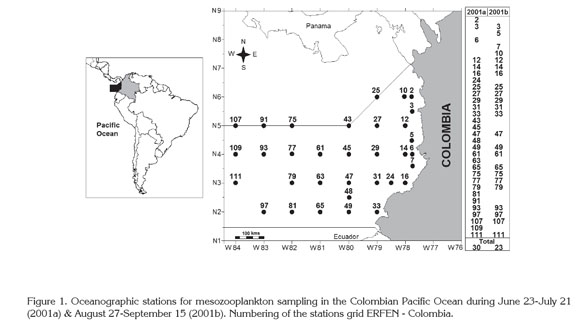
Sampling. This study was conducted during two oceanographic cruisers (CCCP, 2002) in June 23-July 21 (2001a) and August 27-September 15 (2001b) at 29 and 23 locations, respectively, belonging to the 113 oceanographic stations of the Regional Study of El Niño (ERFEN-Colombia) (acronym in Spanish). To facilitate the location of the sampling stations, the complete standard grid ERFEN-Colombia was not included (Figure 1). The original stations numbering was maintained for comparison with other studies.
The type of sampling was stablished by the ERFEN-Colombia. Mesozooplankton was collected at the surface during day- or night-time, depending on the arriving of the vessel to each station. In this task a conical net (50cm diameter, 185cm length, 363µm mesh) equipped with a flow-meter suspended in the center of the net frame to measure the volume of water filtered during the tow was used. The net was towed horizontally at a speed of 1.5m/s during 10 minutes. Biological samples were fixed in 10% formalin-seawater.
Water temperatures and salinities were calculated with data obtained with a CTD profiler SBE-19 at each oceanographic station. Five litter Niskin bottles were employed for taking seawater samples for chlorophyll-a analysis.
Laboratory procedures. Mesozooplankton samples were divided using a Folsom splitter, 50% for sorting organisms and 50% for further analysis. Both sub-samples were preserved in 10% formalin buffered with sodium borate. Counting of copepods was based on sub-samples of 10mL until approximately 200 organisms of the most prevalent species remain in the sub-samples (Suthers & Rissik, 2009). Identification was based on external morphology, details of the integument, and spine patterns of the specimens (Böttger-Schnack, 2010a; 2010b), dissected and mounted on slides with glycerin (Reid, 2000).
Spectrophotometric analysis of chlorophyll-a (Clesceri et al.2001) were performed, as this pigment is one of the main indicators of phytoplankton biomass and therefore of primary production in the oceans (Huot et al. 2007).
Data analysis. The original abundance values were transformed to number of copepods in 1m3 of seawater by the equation: N = 1m3*n/p*r2*d; where N= standardized abundance; n= individuals per sample; p * r2 * d= volume filtered per tow; r= radius of the net; d= total distance tow (m) (Suthers & Rissik, 2009). Abundances were divided into range size quartiles and then illustrated in maps drawn with Surfer 8 ®program. The night: day abundance ratio was calculated from the nighttime (18:12 and 05:00) and daytime (06:25 and 17:30) samplings based on the local times of sunrise (ca. 06:00) and sunset (ca. 18:00) during the oceanographic cruises.
O. media and O. venusta abundance were transformed by log (x+1) values prior to analysis to reduce the bias of sites with elevated abundance. Kruskal-Wallis non-parametric test was used to compare abundance and abiotic factors among sites and the two study periods. A cluster analysis was conducted to examine the inter-period differences of both populations and similarity among stations. Squared Euclidean metric distances were applied as measurement of similarity and the technique of the nearest neighbor (single linkage) as clustering method. The initial communality estimates have been set to assume that all of the variability in the data is due to common factors. A dendrogram (cluster) per study period was elaborated in order to determine which set of data could discriminate groups of stations depending on O. media and O. venusta abundances and abiotic variables.
A factor analysis by principal components was applied to study associations among O. media and O. venusta, and temperature, salinity, chlorophyll-a (phytoplankton), thermocline depth (Zt) and width (Wt), and night: day abundance variation. Varimax rotation was performed to simplify the explanation of the factors. The software package Statgraphics Plus 5.0 was used for statistical analysis.
RESULTS AND DISCUSSION
Abundance. Among the copepod species identified in 2001a (60 species) and 2001b (57 species) in the CPO, the general abundances of O. venusta and O. media were 29.1% & 14.7% in the first period, and 11.4% & 12.6% in the second one. The other species had low abundances (<6%).
This was an expected finding, since small-sized copepods dominate zooplankton communities in subtropical-tropical regions (Schnack et al. 2010), where O. venusta and O. media are numerous and widespread in the Eastern Pacific (Böttger-Schnack, 2010a; 2010b; López-Ibarra et al. 2014), in USA (Fiedler, 1983; Choi et al. 2005); Costa Rica (Morales, 1996; 2001), México (Hernández-Trujillo et al. 2004; López- Ibarra et al. 2006; Palomares-García et al. 2013); Ecuador (Prado & Cajas, 2009; Coello et al. 2010; Tutasi et al. 2011); Peru (Smith et al. 1971; Santander et al. 1981; Criales- Hernández et al. 2008) and Chile (Hirakawa, 1989; Escribano & Hidalgo, 2000; Hidalgo et al. 2010; 2012).
Abundance disparities between the two periods were observed (Kruskal-Wallis test p<0.001, 95.0% confidence level). Whereas general abundance of O. venusta decreased (66.4% to 47.5%) O. media increased (33.6% to 52.5%). Similar to 2001a, Monsalve (1976) did not find O. media but observed O. venusta throughout the CPO and higher abundances in coastal waters in September-October 1976 (ERFEN-Colombia). These results coincide with the known ubiquity of O. venusta (Böttger-Schnack & Huys, 2004).
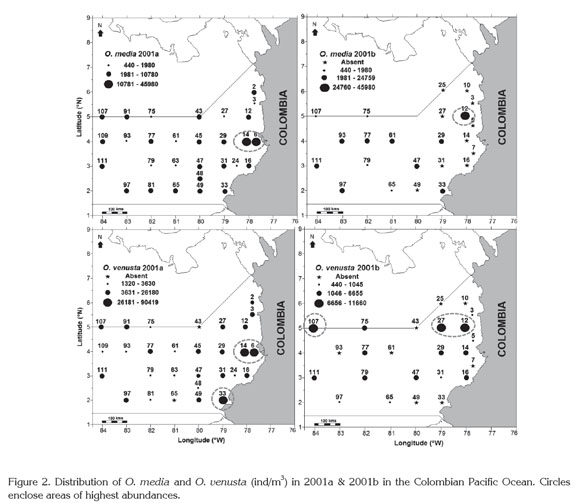
Spatial-temporal distribution. As all planktonic organisms (Suthers & Rissik, 2009; McManus & Woodson, 2012), O. venusta and O. media populations had a wide and heterogeneous distribution at the surface of the CPO in 2001a and 2001b, with the highest abundances in neritic waters (3°-5°N). O. venusta exhibited higher numbers also in southern coastal waters in the first period and in oceanic waters in the second one (Figure 2). Kruskal-Wallis test showed a significant difference among stations and periods (p<0.001, 95.0% confidence level). Martínez et al. (2007) mentioned changes in the general abundance of the copepod community in the CPO related with the sampling area and study period. Nevertheless they did not identify the organisms.
Latitudinal differences in distribution and abundance of both species have been related to oceanographic conditions, for instance in Costa Rica (Gulf of Nicoya, Coronado Bay and Golfo Dulce) (Morales, 1996; 2001) and Ecuador, where O. venusta can reach the first position among the top ten species (Tutasi et al. 2011). Something similar was observed off Central Peru, where O. venusta was numerically dominant during August 2006 (Criales-Hernández et al. 2008).
Surface temperature and salinity values were typical for the CPO, even though thermocline showed a decreasing range from 2001a to 2001b (Table 1). This situation was explained by a weak La Niña event (1998-2001) detected that year only in subsurface layers of the CPO (Cadena et al. 2006; Pabón & Torres, 2006). Especially around August-September the upper layer of the water column is warmer and deeper than in the first six months of the year (CCCP, 2002; Kessler, 2006; Villegas & Málikov, 2006).
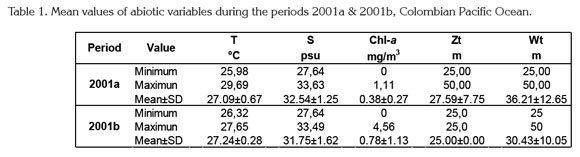
Surface chlorophyll-a concentrations were also normal and varied significantly in both study periods (Table 1) as habitually in the CPO, where large upwelling areas are common (CCCP, 2002). Comparatively, in upwelling and adjacent oceanic zones off northern Chile highest chlorophyll-a concentrations can reach >20mg/m3 between 0 and 25m depth (Hirakawa, 1989; Escribano & Hidalgo, 2000; Castro et al. 2007; Hidalgo et al. 2010; 2012).
It is usual to find high abundances (2000-15000 Ind.x103/ m3) and big number of copepod species in upwelling areas between the coast line of Ecuador and Galapagos Islands. Over there La Niña incidence was more evident in September- October 2001. From 107 copepod species, O. media and O venusta were found almost exclusively in the upper 50m. O venusta was one of the 10 most abundant species that best defined the Equatorial Front and the upwelling process (Tutasi et al. 2011).
In neritic waters of south California, Fiedler (1983) reported patches of O. media of more than 1000ind/m3. Depending on the time of the year, this species can be also abundant following O. venusta in Tosa Bay, southern Japan (Nishibe et al. 2009) and even more than O. venusta in the Straits of Malacca, a waterway connecting the Andaman Sea (Indian Ocean) and the South China Sea (Pacific Ocean) (Rezai et al. 2004), Arabian Sea (Böttger-Schnack, 1996; Fazeli et al. 2012).
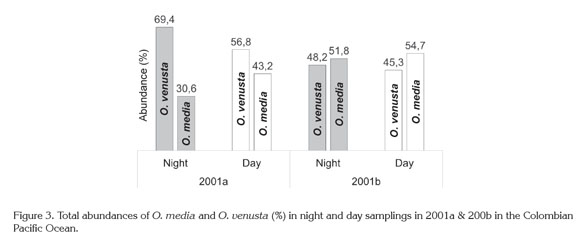
Night: Day variation. Given that O. venusta and O. media abundances were somewhat higher by night or day, these populations seemed to perform massive diel vertical migrations (DVM) to the surface in 2001a and 2001b (Figure 3), as along the American Pacific Basin (e.g., Smith et al. 1971; Escribano & Hidalgo, 2000; Hidalgo et al. 2010; Tutasi et al. 2011; Hidalgo et al. 2012) and other areas in the Pacific ocean (e.g., Böttger-Schnack, 1996: 1997; Lo et al. 2004; Nishibe et al. 2009; Itoh et al. 2014).
This circumstantial sign has to be corroborated in future evaluations because stratified sampling was not performed at the CPO and displacement of copepods through the water column is carried to different depths and with different rates out, depending on their size and development stages. Some of them remain in deeper layers and occasionally reach subsurface waters at night or twilight, while others exhibit inverse DVM. In this behavior thermocline could have an important influence (Böttger-Schnack, 1996; 1997; Lo et al. 2004; Nishibe et al. 2009; Tutasi et al. 2011), for example in the Kuroshio Region most Oncaea populations appear in the 0-50m surface stratum and shift downward, when the thermocline remarkably descended (August-November) (Itoh et al. 2014). As mentioned before, in the CPO thermocline showed a decreasing range from 2001a to 2001b explained by a weak La Niña event (1998-2001) (Cadena et al. 2006; Pabón & Torres, 2006).
Like other dominant copepod species, like Calanus furcatus and Temora discaudata in waters of Ecuador O. venusta and O. media apparently assemble in the surface at night (0 to ca. 1m), however occupying the upper 250m of the water column during the day, but remaining almost exclusively in the upper 50m during La Niña 2001 (Tutasi et al. 2011). This situation could be similar in the CPO in 2001a and 2001b because of the water column stratification, which could favored the retention of small-size copepods in the mixed layer, as pointed out by Jaimes & López (2014).
Statistical Analysis. Ordination analysis showed a strong correlation of the thermocline depth with both species in 2001a and only with O. media in 2001b. Moreover, positive and negative thermohaline associations with these species indicated a significant effect on their distribution/abundance (Table 2). Only the two factors of the ordination analysis were considered because they concentrate together the highest associations (2001a 46.86%, 2001b 48.61%).
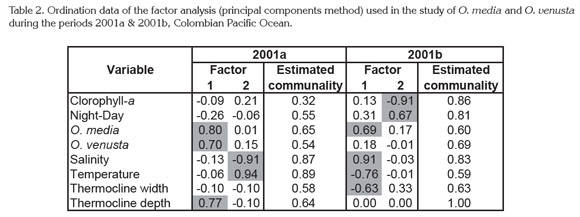
High statistical correspondences between chlorophyll-a and copepod abundance were not observed, subsequently phytoplankton seemed not to be very significant for O. venusta and O. media. In further analysis it is necessary consider their feeding ecology, their role as prey for predators at higher trophic levels, and aspects of their reproductive biology which could influence their trophic behavior (Turner, 2004). Other aspects to consider should be the cyclical nature of feeding activities and the short-term variability in grazing pressure (Champalbert et al. 2003).
Similar to the results in the CPO, a factor analysis in waters of Ecuador in September-October 2001 revealed that 91% of the variability in the distribution and abundance of the copepod species was explained by temperature and salinity. Nonetheless the low number of stations sampled (41), did not allow determining which of these factors caused a major impact on copepods (Tutasi et al. 2011). Perhaps in our case we must be also cautious, because of the limited number of oceanographic stations.
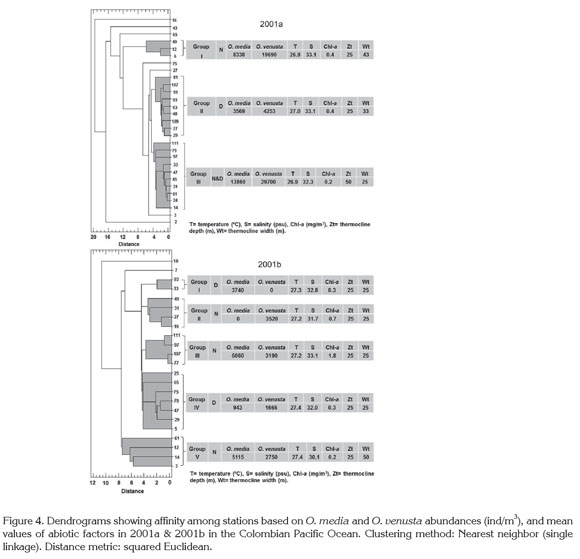
Cluster analysis divided the sampling stations into three groups in 2001a: Group I (night) and Group II (day) had the largest thermocline amplitude vs. a 25m-thermocline depth, and a 0.4mg/m3 chlorophyll-a mean concentration. Group III (night & day) included a thermocline amplitude less extensive vs. a 50m-thermocline depth, and 0.2mg/ m3 chlorophyll-a mean concentration. In 2001b five groups were obtained: Groups I and IV were diurnal and contained a 25m-thermocline amplitude and depth each. Group V had a 25m-thermocline located to 50m depth and 0.2-1.8mg/ m3 chlorophyll-a concentration. Copepod abundances fluctuated broadly per group but were higher by night (Figure 4). As in ordination analysis, these results evidenced the thermocline influence on copepod abundances.
The low sampling frequency did not allow to study the dynamic relationship between copepods and the considered variables more deeply. Presumably, currents influenced copepods distribution, as recognized worldwide for these organisms and all plankton communities, since ocean dynamics affects highly their transport, dispersal and/or retention to different spatial and temporal scales (Escribano & Hidalgo, 2000; Boxshall & Halsey, 2004; McManus & Woodson, 2012; Itoh et al. 2014). López (2012) and Jaimes & López (2014) refer to circulation pattern as maybe the main factor affecting the whole copepod community structure in the study area.
Conflicts of interest. This manuscript was written and reviewed by both authors, who declare the absence of any conflict which can put the validity of the presented results in risk. Financial support. This study is a product of the project CIAS-1181: "Copepoda: herramienta para evaluar la dinámica del mesozooplancton en el Océano Pacífico Colombiano", financed by Vicerrector of Research of the Universidad Militar Nueva Granada. Raw data of temperature, salinity and chlorophyll-a were provided by Centro de Investigaciones Oceanográficas e Hidrográficas-Dirección General Marítima (DIMAR).
BIBLIOGRAPHY
1. BÖTTGER-SCHNACK, R. 1996. Vertical structure of small metazoan plankton, especially non-calanoid copepods. I. Deep Arabian Sea. J. Plank. Res. 18:1073-1101. [ Links ]
2. BÖTTGER-SCHNACK, R. 1997. Vertical structure of small metazoan plankton, especially non-calanoid copepods. II. Deep Eastern Mediterranean (Levantine Sea). Oceanol. Acta. 20:399-419. [ Links ]
3. BÖTTGER-SCHNACK, R. 2010a. Remark in the species card of Oncaea media Giesbrecht, 1891. In: Razouls, C.; de Bovée, F.; Kouwenberg, J.; Desreumaux, N. 2005-2014. Diversity and geographic distribution of marine planktonic copepods. Available at http://copepodes.obs-banyuls.fr/en/fichesp?sp=2081 (Accessed 09/06/2013). [ Links ]
4. BÖTTGER-SCHNACK, R. 2010b. Remark in the species card of Oncaea media Giesbrecht, 1891. In: Razouls, C.; de Bovée, F.; Kouwenberg, J.; Desreumaux, N. (eds). 2005-2014. Diversity and Geographic Distribution of Marine Planktonic Copepods. Available at http://copepodes.obs-banyuls.fr/en/fichesp?sp=2112 (Accessed 09/06/2013). [ Links ]
5. BÖTTGER-SCHNACK, R.; HUYS, R. 2004. Size polymorphism in Oncaea venusta Philippi, 1843 and the validity of O. frosti Heron, 2002: a commentary. Hydrobiol. 513:1-5. [ Links ]
6. BOXSHALL, G.A.; HALSEY, S.H. 2004. An introduction to copepod diversity. London: The Ray Society (Londres). 966p. [ Links ]
7. CADENA, M.; ORTIZ, J.; MÁLIKOV, I.; REYNA, J.; PABÓN, D.; DEVIS, A. 2006. Relationship between the 1997/98 El Niño and 1999/2001 La Niña events and oil palm tree production in Tumaco, Southwestern Colombia. Adv. Geosc. 6(1):195-199. [ Links ]
8. CASTRO, L.R.; TRONCOSO, V.Z.; FIGUEROA, D.R. 2007. Fine-scale vertical distribution of coastal and offshore copepods in the Golfo de Arauco, central Chile, during the upwelling season. Prog. Oceanogr. 75(3):486-500. [ Links ]
9. CCCP. 2002. Compilación oceanográfica de la Cuenca Pacífica Colombiana. Centro Control de Contaminación del Pacífico. Ed. Imágenes de la Naturaleza (Cali). 109p. [ Links ]
10. CHAMPALBERT, G.; NEVEUX, J.; GAUDY, R.; LE BORGNE, R. 2003. Diel variations of copepod feeding and grazing impact in the high-nutrient, low- chlorophyll zone of the equatorial Pacific Ocean. J. Geophys. Res. 108(C12), 8145, Available at http://onlinelibrary.wiley.com/doi/10.1029/2001JC000810/pdf (Accessed 31/03/2015). [ Links ]
11. CHOI, K.H.; KIMMERER, W.; SMITH, G.; RUIZ, G.M.; LION, K. 2005. Post-exchange zooplankton in ballast water of ships entering the San Francisco Estuary. Plankt. Res. 27(7):707-714. [ Links ]
12. CLESCERI, L.S.; GREENBERG, A.E.; EATON, A.D. 2001. Standard methods for the examination of water and wastewater. American Public Health Association (Washington). 1325p. [ Links ]
13. COELLO, D; PRADO, M.; CAJAS, J.; DE CAJAS, L. 2010. Variabilidad del plancton en estaciones fijas frente a la costa ecuatoriana. Rev. Cien. Mar. Limnol. 4(2):23-43. [ Links ]
14. CORREDOR, A.; ACOSTA, A.; GASPAR, P.; CALMETTES, B. 2011. Variation in the surface currents in the Panama bight during El Niño and La Niña events from 1993 to 2007. Bol. Invest. Mar. Cost. 40(Sp. Suppl.):33-56. [ Links ]
15. CRIALES-HERNÁNDEZ, M.I.; SCHWAMBORN, R.; GRACO, M.; AYÓN, P.; HIRCHE, H.J.; WOLFF, M. 2008. Zooplankton vertical distribution and migration off Central Peru in relation to the oxygen minimum layer. Helgol. Mar. Res. 62(Suppl.1):85-100. [ Links ]
16. ESCRIBANO, R.; HIDALGO, P. 2000. Spatial distribution of copepods in the north of the Humboldt Current region off Chile during coastal upwelling. J. Mar. Biol. Ass. 80:283-290. [ Links ]
17. FAZELI, N.; REZAI, H.; ZARE, R. 2012. Spatial and temporal distribution of Oncaeidae in Chabahar Bay, Gulf of Oman. J. Life Sci. 6:216-220. [ Links ]
18. FIEDLER, E.P. 1983. Fine scale spatial patterns in the coastal epiplankton off California. J. Fish. Res. Board Can. 30:811-815. [ Links ]
19. GIRALDO, A.; GUTIÉRREZ, E. 2007. Composición taxonómica del zooplancton superficial en el Pacífico colombiano (septiembre 2003). Invest. Mar. 35(1):117-122. [ Links ]
20. HERNÁNDEZ-TRUJILLO, S.; PALOMARES-GARCÍA; R.J.; LÓPEZ-IBARRA, G.A.; ESQUEDA-ESCÁRCEGA, G., PACHECO-CHÁVEZ, R. 2004. Riqueza específica de copépodos en Bahía Magdalena, Baja California Sur, México. An. Inst. Biol. UNAM, SerZool. 75:253-270. [ Links ]
21. HIDALGO, P.; ESCRIBANO, R.; VERGARA O.; JORQUERA, E.; DONOSO, K.; MENDOZA, P. 2010. Patterns of copepod diversity in the Chilean coastal upwelling system. Deep-Sea Res. II. 57:2089-2097. [ Links ]
22. HIDALGO, P.; ESCRIBANO, R.; FUENTES, O.; JORQUERA, E.; VERGARA, O. 2012. How coastal upwelling influences spatial patterns of size- structured diversity of copepods off central-southern Chile (summer 2009). Prog. Oceanogr. 92-95:134-145. [ Links ]
23. HIRAKAWA, K. 1989. Planktonic copepods from Aysen fjord and adjacent waters, southern Chile. Proc. NIPR Sym. Polar Biol. 2:46-50. [ Links ]
24. HUOT, Y.; BABI, M.; BRUYANT, F.; GROB, C.; TWARDOWSKI, M.S.; CLAUSTRE, H. 2007. Does chlorophyll a provide the best index of phytoplankton biomass for primary productivity studies? Biogeosci. Discuss. 4:707-745. [ Links ]
25. ITOH, H.; NAKATA, K.; SASAKI, K. ICHIKAWA, T.; HIDAKA, K. 2014. Seasonal and diel changes in the vertical distribution of oncaeid copepods in the epipelagic zone of the Kuroshio Extension region. Plankt. Benth. Res. 9(1):1-14. [ Links ]
26. JAIMES, J.C.; LÓPEZ, R.H. 2014. Biomasa y abundancia de Copepoda (Crustacea) en aguas superficiales del océano Pacífico colombiano durante septiembre de 2007. Rev. Biol. Mar. Ocean. 49(1):31-41. [ Links ]
27. KESSLER. W.S. 2006. The circulation of the eastern tropical Pacific: A review Prog. Oceanogr. 69:181-217. [ Links ]
28. LO, W.T.; SHIH, C.T.; HWANG, J.S. 2004. Diel vertical migration of the planktonic copepods at an upwelling station north of Taiwan western North Pacific. J. Plankt. Res. 26:89-97. [ Links ]
29. LÓPEZ, R.H. 2012. Distribución y abundancia de copépodos pelágicos en el Pacífico colombiano. Rev. Fac. Cien. 8(1):108-131. [ Links ]
30. LÓPEZ-IBARRA, G.A.; PALOMARES-GARCÍA, R. 2006.Estructura de la comunidad de copépodos en Bahía Magdalena, México, durante El Niño 1997-1998. Rev. Biol. Mar. Oceanogr. 41(1):63-76. [ Links ]
31. LÓPEZ-IBARRA, G.A.; HERNÁNDEZ-TRUJILLO, S.; BODE, A.; ZETINA-REJÓN, M.J. 2014. Community structure of pelagic copepods in the eastern tropical Pacific Ocean during summer and autumn. Cah. Biol. Mar. 55:453-462. [ Links ]
32. MARTÍNEZ, T.; GIRALDO, A.; RODRÍGUEZ-RUBIO, E. 2007. Zooplancton en la corriente Colombia, Pacífico colombiano, durante marzo de 2006. Bol. Cient. CCCP. (14):69-82. [ Links ]
33. McMANUS, M.A.; WOODSON, C.B. 2012. Plankton distribution and ocean dispersal. J. Exp. Biol. 215:1008-1016. [ Links ]
34. MONSALVE, B. 1976. Copépodos del Pacífico colombiano, cruceros Pacífico V y VII. Div. Pesq. 18(3,4):2-9. [ Links ]
35. MORALES, A. 1996. Checklist of copepods from Gulf of Nicoya, Coronado Bay and Golfo Dulce, Pacific coast of Costa Rica, with comments on their distribution. Rev. Bio. Trop. 44(Suppl. 3):103-113. [ Links ]
36. MORALES, A. 2001. Biodiversidad marina de Costa Rica, los microcrustáceos: Subclase Copepoda (Crustacea: Maxillopoda). Rev. Biol. Trop. 49(Supl.2):115-133. [ Links ]
37. NISHIBE, Y.; HIROTA, Y.; UEDA, H. 2009. Community structure and vertical distribution of oncaeid copepods in Tosa Bay, southern Japan. J. Mar. Biol. Ass. U.K. 89(3):491-498. [ Links ]
38. PABÓN, D.; TORRES, A. 2006. Efecto climático de los fenómenos El Niño y La Niña en la sabana de Bogotá. Met. Col. 10:86-99. [ Links ]
39. PALOMARES-GARCÍA, R.J.; GÓMEZ-GUTIÉRREZ, J.; ROBINSON, C.J. 2013. Winter and summer vertical distribution of epipelagic copepods in the Gulf of California. J. Plankton Res. 35(5):1009-1026. [ Links ]
40. PRADO, M.; CAJAS, J. 2009. Variabilidad del plancton en estaciones fijas frente a la costa ecuatoriana durante el 2008. Bol. Cien. Téc. 20(5):24-42. [ Links ]
41. REZAI, H.; YUSOFF, F.; ARSHAD, A.; KAWAMURA, A.; NISHIDA, S.; OTHMAN, B. 2004. Spatial and temporal distribution of copepods in the Straits of Malacca. Zool. Stud. 43(2):486-497. [ Links ]
42. REID, J.W. 2000. Workshop on taxonomic techniques for copepods. World of Copepods website. Department of Invertebrate Zoology, Smithsonian Museum of Natural History. Available at http://invertebrates.si.edu/copepod/techniques.htm (Accessed 16 February 2013). [ Links ]
43. SANTANDER, A.; CARRASCO, Z.; LUYO, G. 1981. Zooplancton del norte del Perú. Inst. Mar. Peru. Bol. Ext. p.244-253. [ Links ]
44. SCHNACK, S.B.; MIZDALSKI, E.; CORNILS, A. 2010. Copepod abundance and species composition in the Eastern subtropical/tropical Atlantic. Deep-Sea Res. II. 57:2064-2075. [ Links ]
45. SMITH, S.L.; BOYD, C.M.; LANE, P.V.Z. 1971. Short term variation in the vertical distribution of copepods off the coast northern Peru. Bol. Inst. Mar. Peru. p.112-118. Available at http://biblioimarpe.imarpe/gob.pe:8080/handle/123456789/1356 (Accessed 12/05/2014). [ Links ]
46. SUTHERS, I.M.; RISSIK, D. (Eds.). 2009. Plankton: A guide to their ecology and monitoring for water quality. Comm. Sci. Ind. Res. Org. (CSIRO) Pub. (Collingwood), 272p. [ Links ]
47. TURNER, J.T. 2004. The importance of small planktonic copepods and their roles in pelagic marine food webs. Zool. Stud. 43(2):255-266. [ Links ]
48. TUTASI, P.; PALMA, S.; CACERES, M. 2011. Epipelagic copepod distributions in the eastern equatorial Pacific during the weak La Niña event 2001. Sci. Mar. 75(4):791-802. [ Links ]
49. VILLEGAS, N.; MÁLIKOV, I. 2006. Modelación de la estructura dinámica de las aguas de la cuenca del Pacífico colombiano. Bol. Cient. CCCP. 13:97-114. [ Links ]
Received: 20 July 2014 Accepted: 22 April 2015
