


 English (pdf)
 Article in xml format
 Article references
 Send this article by e-mail
 Cited by SciELO
  Cited by Google
  Similars in
SciELO
Similars in
SciELO  Similars in Google
 Permalink
INTRODUCTION
Globally, the livestock sector represents 14.5% of greenhouse gas (GHG) emissions from cattle production (4.6 Gt CO2-eq), mainly through enteric fermentation (2.1 Gt CO2-eq), which corresponds to the largest source (IPCC, 2007; Gerber et al. 2013). Enteric methane (CH4) emissions are highly variable, depending on the quality of feed, but also on climate conditions, dry matter intake and energy use. In order to contribute to the mitigation of climate change there is the current need to standardize accurate, affordable, and logistically simple methods to determine in vivo emissions of enteric CH4 accurately and at the more specific scales as possible. However, for the cattle sector, most of the default values given by the intergovernmental panel on climate change (IPCC) (Tier 1 emission factors) (Gavrilova et al. 2019) use to estimate emissions were developed in laboratories with mostly breeds and feeds in non-tropical countries, which lead to uncertainties in estimations when used in the tropics. Therefore, it remains unclear whether IPCC emission factors are reflective of CH4 emissions from cattle in tropical locations.
The polytunnel method is a promising, simple and accessible approach for quantifying enteric CH4 emissions in which individual or groups of cattle can be confined for selected periods of time during which the amount of CH4 they produce is collected and then measured (Storm et al. 2012; Goopy et al. 2016). Currently, CH4 concentrations in samples collected from polytunnels are collected and transferred to lab prior to being analyzed using gas chromatography (Murray et al. 1999), a resource demanding process. On the other hand, Gasmet DX4040TM (Gasmet) uses Fourier Transform Infrared Spectroscopy (FTIR) to measure up to 25 gases simultaneously, including CH4. The real-time measurements and portability of Gasmet raises the possibility of rapidly and cost effectively quantifying gas concentrations. This technology has been used to quantify enteric CH4 emissions from the feeding pen automatic milking systems (Lassen et al. 2012; Haque & Madsen, 2014). Gasmet has not previously been used for field measurements of methane in tropical countries, where humidity and temperature may affect performance. To the best of our knowledge, this is the first study to directly compare the FITR technology with gas NDIR system with gas chromatograph to measure methane emissions in cattle. We hypothesize that Gasmet (FTIR technology) gives comparable CH4 concentrations to those obtained by gas chromatograph (GC) technology.
MATERIALS AND METHODS
Two field experiments (ExpA and ExpB) were conducted at the Palmira campus of the Alliance of Biodiversity International and the International Center for Tropical Agriculture, ABC; average annual temperature and rainfall of 27°C and 1008mm respectively, altitude 1050m a.s.l. The same four zebu steers (234±11kg) were used in both experiments, consuming Urochloa hybrid cv. Cayman-CIAT BR02/1752 (Cayman) forage of different chemical composition due to different growth stages (45 days for ExpA and 65 days for ExpB). Measurements of CH4 emissions were made using the polytunnel technique (Murray et al. 2007) with two polytunnels, volume 134m3, with an entry for animals and staff and on the opposite side a 12” fume hood set at an extraction rate of 0.9m3s-1 to allow the sampling of gases. The evaluated steers had been consuming the same Urochola hybrid over a six-month period prior to measurements. The steers were acclimatized to confinement in the polytunnel for four days prior to conducting gas measurements (Murray et al. 1999). The fifth day, gas samples were collected every 80 minutes over 24-hours for a total of 18 sampling times. A total of 144 gas samples were analyzed for each measurement technique (18 times × 4 animals × 2 experiments). For GC analysis, at each sampling time, samples were collected using a 50mL plastic syringe, stored in 10mL Exetainer® vials and sent for analysis within 48h to the laboratory of greenhouse gases of ABC. On the other hand, in the case of Gasmet analysis, each sampling time consisted in measurements every 20 seconds for three minutes. The final Gasmet value to be compared with the GC result was the average of the nine measurements taken during the three minutes. The gas samples were taken inside and outside each polytunnel to correct values with the gas concentration in the environment. Gasmet used ultrapure N2 gas grade 5.0 for zero calibration; and it was purged flushing the N zero-gas for five minutes at a rate of 2L min-1. After every calibration the device was tested measuring the CH4 concentration in the zero gas and results were close to 0ppm CH4. The GC Shimadzu GC-2014 was equipped with a flame ionization detector. The temperatures of the gas chromatograph’s furnace, injector and detector were 250°C, 100°C and 325°C, respectively. To verify the accuracy of the measurements made with GC, SCOTTY® Specialty Gas Calibration Standards of different concentrations were used (10ppm CH4, 2000ppm CO2, 1ppm N2O and 2000ppm CH4, 5000ppm CO2, 5ppm N2O).
Significance of correlation between Gasmet and GC values was determined using the PROC CORR, in SAS version 9.1 (SAS, 2003). To evaluate Gasmet performance: Logarithmic Gasmet efficiency (LGE) (Equ. 1), the coefficient of determination (R2), normalized root mean square prediction error (RMSPEn) (Equ.2) and the mean bias (MB) (Equ. 3) (Tedeschi, 2006) were used.

LGE is a measure of accuracy. High Gasmet efficiency, is represented by a LGE value of 1. In contrast, an LGE value that is <0 indicates that the mean of the chromatograph values is a better estimator than Gasmet values (Tedeschi, 2006).
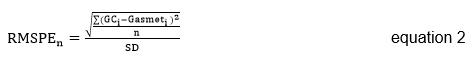
The RMSPEn is inversely related to R2.
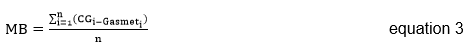
MB is used to assess Gasmet accuracy, reflects systematic deviations between chromatograph and Gasmet values. If MB is negative, it means that, for the specific variable, the Gasmet overestimates and, if it is positive, it means that the Gasmet underestimates (Smith et al. 1997). In this equation n: is sample size; CGi: represents the ith chromatograph value and Gasmeti: corresponds to the ithGasmet value.
RESULTS AND DISCUSSION
A significant correlation was observed when comparing the results obtained with the Gasmet and the GC techniques (R2=0.96, P<0.005). (Figure 1). The regression equation obtained was: Gasmet= 1.42 (GC). This result suggest that values recorded using Gasmet were lower than those obtained using GC (Table 1, Figure 1). This trend was confirmed with the positive MB value. The emissions observed in ExpB were higher than those in Exp A, which was associated to differences in the nutritional quality of the diets as the harvesting times of the grass varied between experiments. In ExpA the Cayman offered to the animals had the lowest nutritional quality and therefore had lower methane emissions in g/day, but the highest emission in g of CH4 per kg of digested DM. This agrees with reports that animals fed with forages of high nutritional quality had greater efficiency in the utilization of feed and therefore, had lower energy loss in the form of methane (Blaxter & Clapperton, 1965; Chuntrakort et al. 2014). In both experiments (ExpA and ExpB) we can observe that measurements with Gasmet and with CG have the same tendency in most sampling times (figure 1b) and this can be proven with the values of LGE (0.95) and RMSPEn (0.72) that provide further evidence that though precise, Gasmet values were systematically lower than those obtained through GC in this study (Table 1).
Table 1 Descriptive statistics of the methane concentrations measured either by Gasmet and gas chromatography in samples obtained in ExpA (low quality grass) and ExpB (intermediate quality grass).
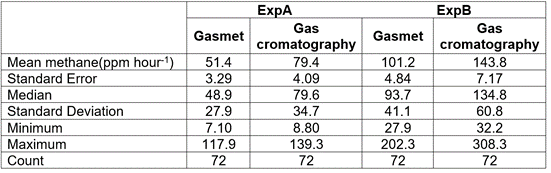
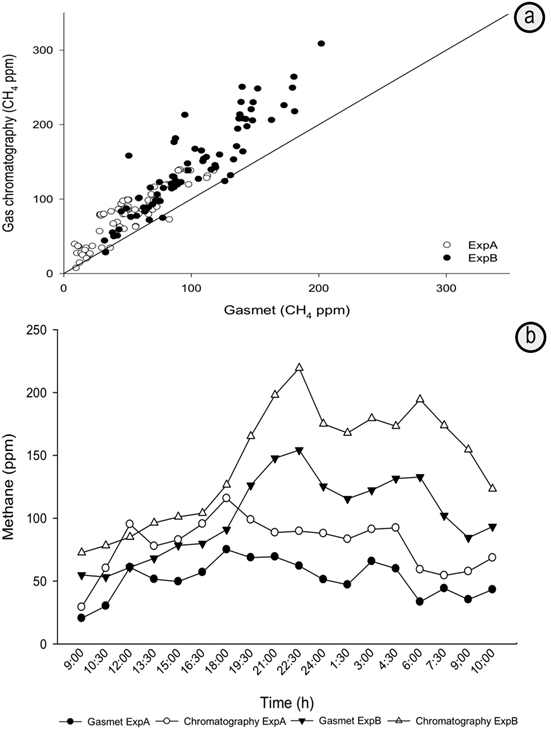
Figure 1 a. Relationship between enteric methane concentrations measured using gas chromatography and Gasmet DX4040 (FTIR) during different time periods; b. Correspondence between enteric methane concentrations measured using gas chromatography and Gasmet DX4040 (FTIR) during different time periods.
In previous studies (Lassen et al. 2012; Haque & Madsen, 2014), Gasmet technology was used to quantify CH4 concentrations over very short time periods (5-6 minutes) and at low frequencies (2.6 times per day). The low frequency of these studies was certainly insufficient to capture the diurnal variation in enteric CH4 emissions. Our results, for measurements conducted over longer periods (24h), suggest that Gasmet technology and GC are comparable for the quantification of CH4 emissions. Sypniewski et al. (2019) also used FITR analyzer to measure methane emissions in cattle and suggested that FITR analyzers provide reliable results for large scale CH4 and CO2 measurements. However, if results obtained through Gasmet technology are to be compared with those measured through GC, a correction factor (1.42) is necessary. We suppose that the observed difference in values obtained using Gasmet and GC may be partially due to differences in measurement approaches. and is constantly being reported (Goopy et al. 2016; Molina et al. 2016) furthermore, it is a technology that is calibrated by releasing pure gases in order to know its recovery rate, which is normally over 95% (Lockyer & Jarvis, 1995; Murray et al. 1999) and it is pertinent to note, that values presented in this study are gas concentrations and not absolute emissions.
Individual differences between production of CH4 are measurable using a portable FTIR measuring unit in an automatic Milking system and may be useful to generate largescale data for genetic evaluation of CH4 production in dairy cattle (Haque & Madsen, 2014). Shetty et al. (2017) evaluated the feasibility of FTIR spectroscopy of milk in predicting CH4 emission. Data collected from commercial farms had CH4 measurements and corresponding FTIR spectral profile. Low prediction accuracies were obtained for CH4: CO2 ratio and CH4 production when models were obtained using FTIR spectra. When models were integrated with other factors such as Milk Yield herd, and lactation stage, results showed improvement in the prediction accuracy.
The comparability of outputs and lower operational time-input requirements associated with Gasmet, compared to GC, makes it an attractive option when resources are limited. In this research, the predicted and reported values are variable, but it should be considered that these values do not include variations due to the animals and diet consumed by the animals, which is a factor that greatly influences the methane emissions. This is in line with Rey-Sanchez et al. (2019) who concluded that CH4 emissions differ between and within subjects and these differences must be identified and corrected to increase the reliability of measurements made with non-invasive methane measurement methods. The exact concentrations of CH4 shown by GC were not exactly reproduced by Gasmet. However, the correlation between both datasets and supported by complementary metrics suggest that although not with 100% accuracy, the emissions can be precisely estimated and are comparable to GC after applying a correction factor of 1.42.
We can conclude that methods such as Gasmet represent a viable, rapid and easy to implement approach for quantifying enteric CH4 emissions in contrasting conditions of emission levels. Many instruments and or techniques have been developed to measure enteric CH4 emissions from ruminants, each with their own scope of applications, advantages and disadvantages (Hill et al. 2016). No single method is perfect in all aspects and thus it is necessary to highlight its advantages and disadvantages. In methods such as Gasmet, there is a need for more repeated measures on multiple animals and further comparisons between techniques which estimate CH4 emissions in ruminants.

