


 English (pdf)
 Article in xml format
 Article references
 Send this article by e-mail
 Cited by SciELO
  Cited by Google
  Similars in
SciELO
Similars in
SciELO  Similars in Google
 Permalink
INTRODUCTION
An alternative that improves water use efficiency in fruit trees is RDI, which consists of making small water applications during periods of the crop cycle that have low sensitivity to water deficits and applying the necessary amount during the rest of the phenological cycle (Vélez Sanchez et al. 2012). Monitoring the evolution of the daily growth of buds allows for controlling the intensity of deficits to avoid losses in fruit production and quality (Moreno Hernández et al. 2017).
The vigor conditions of plants determine the extent, rate of growth, and elongation of shoots; a high-water deficit can affect trees or their parts (Bolat et al. 2014). The effect depends on the intensity, duration, and timing of the deficit. Imposing moderate levels of water stress during crop development improves fruit quality and saves water (Silveira et al. 2020).
The initiation and differentiation of vegetative and reproductive structures and cell lengthening once the cells are differentiated are very sensitive to water stress and, physiological processes, are not necessarily affected to the same degree (Marsal et al. 2002). Wu et al. (2013) and Molina Ochoa et al. (2015b), in the pear, found that the effect of water stress manifests itself clearly in vegetative growth, so one of the objectives of RDI is to avoid the excess vigor that affects fructification (Vélez Sánchez et al. 2007). Vegetative development is limited proportionally to reductions in the water supply (Moreno Hernández et al. 2017).
Growth curves show the behavior of a plant in a particular ecosystem over time, irreversible increases in dry matter or volume, and changes in size, mass, shape, or number of structures as a function of genotype and environment, resulting in a quantitative increase in the size and weight of the plant or a specific organ (Álvarez et al. 2021). The growth rates commonly used for analyses are absolute growth rate (AGR), which indicates changes in size per unit of time, and relative growth rate (RGR), which indicates variation in size per unit of initial size (Ardila et al. 2011).
The objective of the research was to determine the effect on the vegetative growth of the pear variety Triunfo de Viena of regulated deficit irrigation RDI during the rapid fruit growth stage in 2014 and 2015, taking into account the water status of the soil and of the plants.
MATERIALS AND METHODS
This experiment was carried out during 2014 and 2015 in the municipality of Sesquilé, Cundinamarca, Colombia, on a plot of 0.32ha, with 172 pear trees of the variety Triunfo de Viena, planted in 1998 at 4 x 4m. The soil, typical of the area has a clay-loam texture (IGAC, 2010). The weather information was obtained from a WS-GP1 portable weather station (AT delta-T Devices, USA) located next to the plot. The climate is cold and dry, the average temperature was 13.0°C and 13.14°C, relative humidity was 80.17 and 79.78%, and accumulated precipitation was 509.6mm and 820mm for 2014 and 2015. The mean potential evapotranspiration (ETo), calculated with the Penman-Monteith equation (Allen et al. 1998; Cleves-Legizamo et al. 2016), was 2.09 and 2.03mm day-1 in 2014 and 215, respectively.
The experiment design consisted of randomized complete blocks, taking into account the slope of the land and the distribution of the trees in the plot, with three treatments and four repetitions (12 plots); the experimental plot was formed by 4 or 5 contiguous rows of three, four and five trees each (with a total of 12, 15, 16 and 20 interior trees per plot).
The irrigation regime was determined by taking into account crop evapotranspiration (ETc). During the crop cycle, all treatments were irrigated at 100% ETc; in the rapid fruit growth phase, the following were applied: Control Treatment (T1), irrigated for two years at 100% ETc; and Deficit Treatments (T2), irrigated at 74% and 48% ETc, and (T3), irrigated at 60% and 27% ETc, in 2014 and 2015, respectively. The volume of water applied to each treatment was controlled by varying the irrigation time, maintaining the same frequency, every two days. The water was measured with 13mm volumetric counters (Zenner®) installed in each plot. The drip irrigation system used six 8Lh-1 emitters per tree.
The water matrix potential in the soil (Ψs) was measured every three days with eight granular matrix sensors (Watermark Mod. 200ss Irrometer Co., USA) per treatment, installed at depths of 15 and 30cm every 25cm on the emitter and drip line.
The leaf water potential was measured with a pressure chamber (PMS Instrument Company, Model 600, PMS Instrument Company, Oregon, USA). The determinations were made on leaves before dawn (potential at dawn, Ψa) and at solar noon (potential stem, Ψt) on leaves in which transpiration was prevented by covering them two hours before the measurement with hermetically sealed plastic bags covered with aluminum foil. For both the Ψa and Ψt, two and three adult leaves were used per tree from three and four representative trees per treatment in 2014 and 2015, respectively, which were located in the lower third on the north side of the tree. The determinations were made at the beginning of the water restrictions and every month thereafter for the Ψa and every 15 days for the Ψt.
On October 1 and 2 of 2013 and 2014 and September 20 of 2015, fruit pruning was carried out; after the harvest, the wood corresponding to two trees was weighed per repetition, for a total of eight per treatment, to determine whether the water regimes affected the vegetative development.
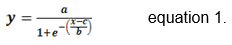
In November 2013 and 2014, 12 shoots, with an average length of 10cm, were selected and labeled by three in two trees per repetition, for a total of 96 per treatment, half on the north side and half on the south side, on which the length was measured in 2014 and 2015, every eight days with a precision flexometer (0.01mm) until harvest (May 9 of 2014 and April 10 of 2015). The growth curves were fitted to a three-parameter sigmoid logistic. Equation 1.
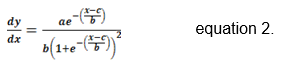
The (AGR) of the bud length corresponded to the growth derivative (δy / δt), which resulted in equation 2, with the parameters of the models obtained from the growth curves sigmoid logistic equation.
The absolute growth rate was calculated with equation 3
With the SAS/STAT program (SAS Institute Inc, 2010), the statistical analysis was carried out using analysis of variance and Tukey test, p<0.05, to compare the treatments and the control with the “glm” procedure.
RESULTS AND DISCUSSION
The volume of water applied. The irrigation treatments applied during the restriction from January 1 to February 28, 2014, 67.6, 49.8, and 40.9mm ha-1 and, from December 23, 2014, to February 22, 2015, 48.3, 23.3, and 13.1mm ha-1 to T1, T2, and T3, respectively. The amount of water supplied during the restriction was greater in 2014, coinciding with the weather conditions. The irrigation reduction in T2 and T3 during this period represented water savings of 26 and 40% (179 and 268m3 ha-1), in 2014 and 52 and 73% (249 and 351m3 ha-1), in 2015, respectively. The irrigation was carried out taking into consideration the precipitation lost through deep infiltration and runoff. The considered factor was the net storage in the soil. It permitted the planning of the deficit in each treatment with minimal differences in production. The water reserve in the soil coming from rain and irrigation before the rapid fruit growth phase mitigates the effects of reductions of water.
Bud length. The longitudinal growth of the shoots in 2014 and 2015 showed a sigmoid curve, defined by three characteristic phases: The first one with cell division from flowering to 44 and 46 days after flowering (DAF) and rapid growth; the second one 45 and 47 to 92 and 116 DAF with slow cell growth; and the third one with a constant increase from 93 and 117 DAF until after the harvest stage, in which the maximum length was reached, figure 1.
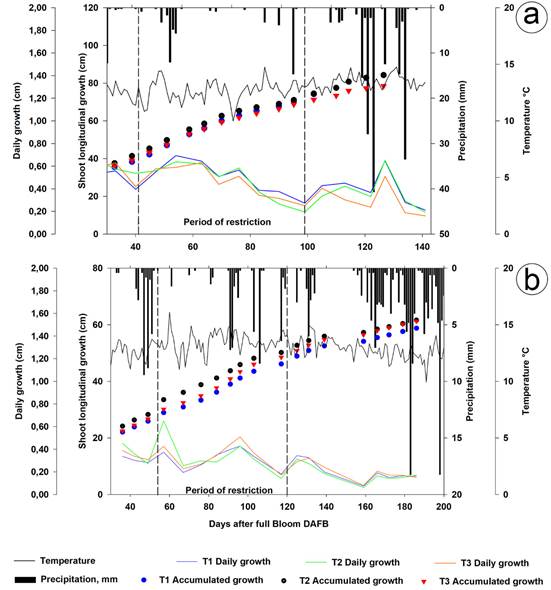
Figure 1 Evolution of length and longitudinal growth of the outbreaks. a. 2014; b. 2015. The values correspond to the average of 96 shoots: 12 per tree, in two trees per repetition, and eight per treatment. Temperature and precipitation (place restriction period).
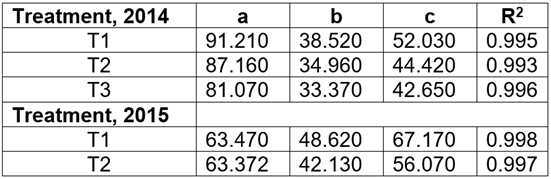
The parameters of the model obtained in 2014 and 2015, with coefficients of determination greater than 0.99, are shown in table 1, corresponding to Equation 1.
Table 1 Parameters of the sigmoid and logistic curve corresponding to the growth length model of the outbreaks and coefficients of determination in 2014 and 2015, respectively.
The bud lengths in T1, T2, and T3 in 2014 were, at the beginning of the restriction (41 DAF) 39.12, 41.45 and 39.53cm; 70.41, 72.04, and 68.43cm at the end of the restriction (99 DAF); and 83.17, 82.12, and 77.14cm (142 DAF) at harvest, respectively, without any significant differences between treatments. In 2015, the bud lengths were, at the beginning of the restriction (53 DAF) 27.14, 30.53, and 28.02cm; 45.94, 50.58, and 48.15cm at the end of the restriction (114 DAF); and 57.79, 60.20, and 60.16cm (180 DAF), respectively, without any significant differences between treatments. After 77 DAF (35 days after the restriction, DAR), in 2014 and 101 DAF (48 DAR), in 2015. All this presumably because the stress levels reached were not severe enough, despite significant water savings. With the lowest rainfall, the soil water potential (Ψs) and stem potential (Ψt), as seen in T3, decreased vegetative growth as a result of the effect of water restriction (Vélez Sánchez et al. 2007; Podesta et al. 2010; Hueso et al. 2019).
The maximum bud length in T1, T2, and T3, measured 154 DAF, in 2014 was 85.18, 83.53, and 78.29cm and in 2015 186 DAF was 58.40, 60.60, and 60.74cm, respectively, without any significant differences. The shortest shoot length was seen in 2015, because of the lower water regimes applied, as compared to those of 2014. Figure 1, shows that T3 in 2014 during the restriction and most of the crop cycle presented the shortest bud length, fulfilling one of the purposes of (RDI), to reduce the water consumption of the plants through transpiration; in 2015, T1 had the shortest bud length, following the weight of the pruned wood in T2 and T3, which were 15.07% and 44.23% lower than the control in 2014 and 6.98% and 10.47% lower in 2015, possibly because of the effect of alternating on deciduous trees (Molina Ochoa et al. 2015a).
The daily growth of the shoot length in 2014 had a difference, between T1 (0.513cm day-1) and T3 (0.443cm day-1) 63 DAF, while in 2015 there was no difference. The daily growth of the deficit treatments at the end of the crop cycle was lower than that of the control in 2014 and higher in 2015, possibly because of the compensatory growth of the fruits once 100% ETc irrigation was resumed (Figure 1).
The absolute rate of growth (AGR) of shoot length. The curve of the (AGR) of the shoot length corresponding to a Gaussian bell that described the daily growth and defined the maximum and the inflection point for T1, T2, and T3 as 0.592 (52 DAF), 0.623 (44 DAF), and 0.607cm day -1 (44 DAF), respectively, in 2014 and as 0.302 (70 DAF), 0.375 (60 DAF) and 0.352cm day -1 (71 DAF), respectively, in 2015, without significant differences between treatments, which means that, during the two years, T3 accumulated enough dry matter for the fruits to achieve the respective compensatory growth once irrigation was resumed.
The (AGR) of the bud length in 2014 and 2015 corresponded to the growth derivative (δy / δt), which resulted in equation 2, with the parameters of the models obtained from table 1.
The AGR of the bud length in 2014 for T1, T2, and T3 was, before the restriction (25 DAF), 0.525, 0.578, and 0.567cm day-1; 0.580, 0.622, and 0.607cm day-1 at the beginning of the restriction (41 DAF); 0.417, 0.357 and 0.320cm day-1 at the end of the restriction (99 DAF); and 0.146, 0.100 and 0.085cm day-1 at harvest (154 DAF), respectively, without any significant differences. In 2015, it was, before the restriction (25 DAF), 1.282, 1.459 and 1.420cm day-1; 1.205, 1.239 and 1.319cm day-1 at the beginning of the restriction (53 DAF); 0.481, 0.374 and 0.488cm day-1 at the end of the restriction (114 DAF); and after harvest (186 DAF), 0.113, 0.069 and 0.106cm day-1, respectively, without any significative differences. Contrary to that seen for the diameter of the fruits; the AGR of the bud length in 2014 in all treatments was on average lower than in 2015.
In the two years at the beginning of the restriction, the AGR in T2 and T3 was higher than in T1, because of the water reserve in the soil coming from the rain and the irrigation before the rapid fruit growth phase. In 2014 at the end of the restriction before the harvest was lower, while in 2015, T2 was lower than T1 and T3 (Figure 2).
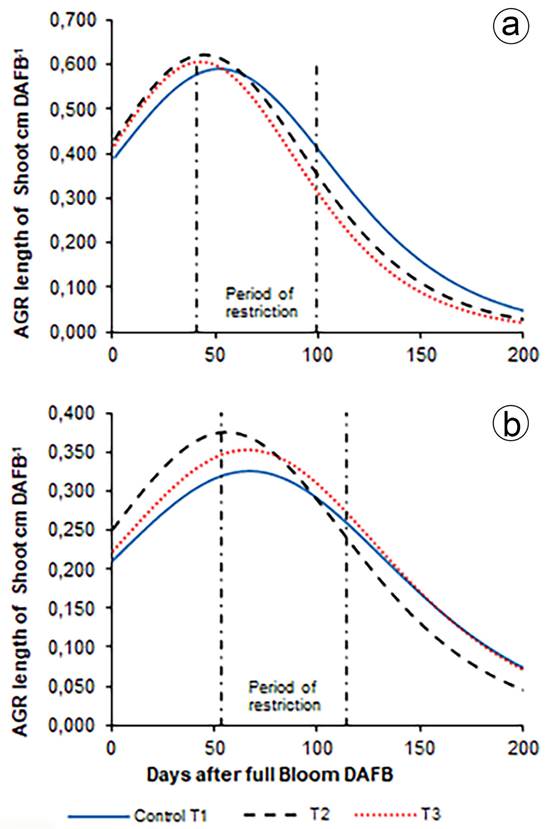
Figure 2 Longitudinal absolute growth rate (AGR) of the outbreaks. a. 2014; b. 2015. The values correspond to the average of 96 shoots: 12 per tree, in two trees per repetition and eight per treatment.
Relative growth rate (RGR) of shoot length. The relative growth rate (RGR) of the shoot length during the two years showed a decreasing trend in all treatments, with a rapid decrease at the beginning. The RGR of the bud length in 2014, in T1, T2 and T3 was, before the restriction (25 DAF) 0.0174, 0.0182 and 0.0189cm day-1; at the beginning of the restriction (41 DAF), 0.0148, 0.0150 and 0.0154cm day-1; at the end of the restriction (99 DAF), 0.0059, 0.0050 and 0.0047 cm day-1 and, before harvest (154 DAF), 0.0017, 0.0012 and 0.0010cm day-1, respectively, without any significant differences. In 2015, before the restriction (25 DAF), it was 0.0683, 0.0711 and 0.0747cm day-1; at the beginning of restriction (53 DAF), 0.0444, 0.0406 and 0.0471cm day-1; at the end of the restriction (114 DAF), 0.0105, 0.0074 and 0.0101cm day-1 and, after harvest (186 DAF), 0.0019, 0.0011 and 0.0017cm day-1, respectively, without any significant differences.
In the two years before the start of the restriction, the RGR in T2 and T3 was higher than in T1, and, at the end of the restriction and before the harvest, they were smaller, coinciding with the conditions of the treatments. The RGR in T1, T2, and T3 reached its maximum at the beginning of growth: 0.0174, 0.0182, and 0.0189cm day-1, respectively, in 2014. In 2015, the RGR was 0.0683, 0.0711 and 0.0747cm day-1, without significant difference between treatments, similar to the results reported by Molina Ochoa et al. (2015b), Díaz Abril et al. (2016) and Vélez Sánchez et al. (2007) (Figure 3). The (RGR) of the bud length in 2014 and 2015 was determined with the models of the absolute growth rate calculated with Equation 3, and the resulting parameters of table 1.
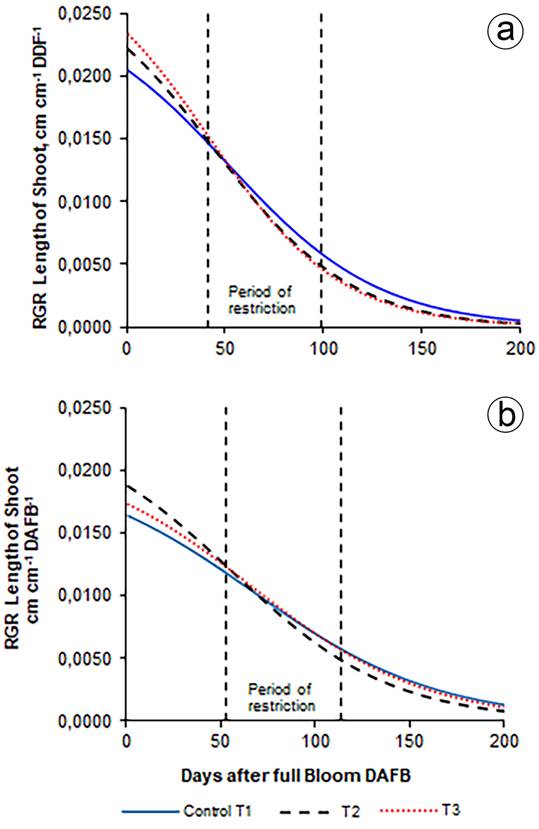
Figure 3 Relative growth rate (RGR) of shoot length. a. 2014; b. 2015. The values correspond to the average of 96 shoots: 12 per tree, in two trees per repetition and eight per treatment.
Comparison between the growth of the fruits and the buds. In 2014 for all treatments, the percentage of fruit growth was greater than the one for the buds in the initial stage. In 2015 the opposite occurred, possibly because of rainfall occurring between 40 and 55 DAF.
The percentage growth of the buds was greater than the fruits for all the treatments as a result of the water restrictions for two years. It coincided with the period of the slow growth of the fruits, and the rapid growth of the buds, resulting from the competition between them (Yang et al. 2016).
T2 and T3 presented the highest percentage of shoot growth and the lowest percentage of fruit growth. The greatest differences in percentages of growth between the shoots and fruits were seen in T2 (17.29%), higher than T3 (14.90%) and T1 (8.47%) at 76, 69, and 90 DAF in 2014, respectively. In 2015, T2 (15.81%) was higher than T3 (13.93%) and T1 (11.06%) up to 103 DAF (Figure 4).
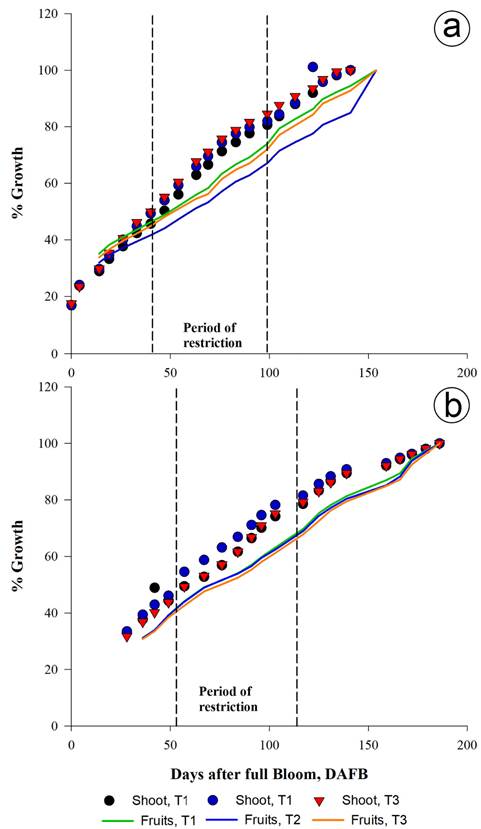
Figure 4 Comparison of the percentage of longitudinal growth of shoots and diameter of fruits. a. 2014; b. 2015. The values correspond to the average of 96 shoots and fruits, respectively: 12 per tree, in two trees per repetition and eight per treatment.
This behavior occurs when plants have decreased water supply and accumulate carbohydrates in the cellular structures that maintain it until transferred to the fruits or stored after harvest for use in the following season. This could be verified with the lower pruned wood weights in the deficit treatments, along with the volumetric humidities (Θv), soil water potentials (Ψs), stem potentials (Ψt) and rainfall, but with the same number and average weight of the fruits, which presented no differences in 2014 and 2015.
The lower percentage of fruit growth in 2014 and 2015 in the deficit treatments was also due to other factors, such as pruning and the level of stress to which the plant was subjected. This allowed for the separation of the vegetative and fruit growth, which occurs after the end of shoot growth, similar to that found by Marsal et al. (2002), in the pear.
Figure 5 summarizes the evolution of the different water status indicators of soil and plants during the trial and show that, as the Ψs decreased, the leaf water potentials at dawn (Ψa) decreased as did the stem potential (Ψt), suggesting a relationship between these variables with the use of the water reserves of the plants. The influence of precipitation on each one was also observed: when it rained or the potentials were irrigated, they were equal and decreased, and even became smaller in the deficit treatments with respect to the control. This potential was a good indicator of state hydric of plant.
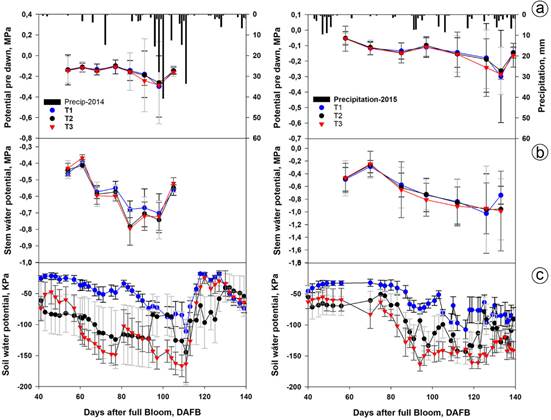
Figure 5 Evolution of the indicators of soil and plant water status in irrigation treatments in 2014 and 2015. a. water potential of the leaf at dawn (Ψa) and precipitation; b. water potential of the leaf to the stem (Ψt), c. soil water potential (Ψs), The values correspond to the means of two leaves per tree in each repetition, in eight trees per treatment. The bars correspond to the standard error.
With the imposition of the deficit, the Ψa and Ψt, as expected, tended to decrease: the smallest regime (T3) had Ψa values of -0.29 MPa and Ψt values of -0.80 and 0.99MPa in 2014 and 2015, respectively. T2 had similar values of Ψa (-0.26 MPa) and Ψt (-0.78 MPa and 0.96MPa), in 2014 and 2015, respectively, while, in the control, the Ψa was -0.30 MPa and the Ψt was -0.70 and 1.03 MPa in 2014 and 2015, respectively.
Pruned wood weight. One of the objectives of the RDI was to avoid excess plant vigor so as not to have negative effects on the production, which was achieved because of the clear separation that was found in this variety between the vegetative growth of the shoots and the growth of the fruits, where part of the growth of the fruit occurred after the end of the vegetative growth (Figure 4).
The results in 2014 showed an increase in the weight of the pruned wood in T1, which had the greatest volume of water applied, as compared to T2 and T3, 17.75% and 79.31%, respectively, with a difference, from that of T3. In 2015, there was no difference, between the treatments although the wood weight was lower in T3 and T2, 9.35% and 5.25%, than in T1. This indicates that the decrease in the vigor of the trees was achieved through the RDI. However, in the control T1 treatment, there was no difference between the two years, while in T2 and T3 there was. The vigor increased, which could be verified in the same plot in 2013 through the effect of the deficit treatments carried out in 2012 (Molina Ochoa et al. 2015b). This variation was very marked in the pome fruit trees because the floral buds can also develop leaves and short branches, which does not happen in drupe fruit trees, where the formation of fruits and flowers has a greater separation (Fischer, 2012). The lower volumes of wood also mean important savings because of the high labor costs for pruning (Martínez et al. 2019).
When there is a decrease in the slope of the daily growth curve of the outbreaks longitudinal, the plant begins to experience slight water stress that signals the start of irrigation, which is why it is used as a highly sensitive indicator of stress.
The bud growth curve was fit to a sigmoid logistic type with three parameters, with which the AGR and RGR were determined, which allows for coordination of the irrigation in such a way that the vegetative growth is controlled to reduce water consumption through transpiration (Panigrahi & Srivastava, 2016).
These results indicate the possibility of programming the automating irrigation when there is no previously established reference equation, and well-watered trees are available in the same plot. It is needed to monitor the water status of the plants continuously, so the imposed deficit does not reach too severe stress situations that could compromise productivity (Vélez Sánchez et al. 2012).

