


 Inglês (pdf)
 Artigo em XML
 Referências do artigo
 Enviar este artigo por email
 Citado por SciELO
  Citado por Google
  Similares em
SciELO
Similares em
SciELO  Similares em Google
 Permalink
INTRODUCTION
At a global level, soybean is one of the most important legume species in animal and human nutrition due to its high protein and oil contents. In the 2018-2019 period, the worldwide soybean area was 125.33 million hectares (USDA, 2020), where Brazil ranked first with 28.6 % of the total area, followed by the USA with 28.3 % and Argentina with 13.2 %. The average yields recorded were 2.87, 3.31, 3.40, and 3.33 t ha-1, respectively.
In Colombia, soybean demand is 468,000 t/year of grain and 1,043,000 t/year of imported soybean meal. The country only produces around 105,980 t/year, in approximately 36,370 ha (Fenalce, 2019). Thus, it is necessary to plant approximately 500,000 ha in the Altillanura subregion of the Colombian Orinoquía region, representing about 90% of the national soybean production. The department of Meta is the largest producer focused mainly on the production of concentrates for poultry and swine feed. In this vast region, the Altillanura subregion, with the largest soybean cultivation area of 32,600 ha (Fenalce, 2019), has an agricultural potential of 2,800,000 ha (DNP, 2014) for different productive systems, where soybean, due to its comparative and competitive advantages, is one of the most viable alternatives.
The dynamic expansion of soybean cultivation in the flat Altillanura subregion has generated the need to seek new genetic resources with traits of interest to contribute to improving the sustainability of the production system. This same approach has been adopted by Brazil, whose greatest interest has been the constant release of new soybean cultivars with high yield, adaptation to different edaphoclimatic conditions, and resistance to major diseases (Hamawaki et al. 2012).
The previous determination of the genetic parameters and the available variability measurement is essential for any breeding program because they characterize a population genetically and allow predicting the expected gains to establish selection strategies (Baldissera et al. 2014; Zamudio et al. 2002). However, generating varieties successfully with high genetic potential depends on the precision with which the relevant parameters are estimated (Wellmann & Bennewitz, 2019). The genotypic (CVg), the phenotypic (CVf) and the environmental coefficients of variation (CVe), the heritability (H2) and the genetic progress (GG), are useful parameters to determine genetic variability (Aditya et al. 2011; Firouzian, 2003; Ali et al. 2016) and the successful selection of superior genotypes (Hamawaki et al. 2012; Baraskar et al. 2014; Silva et al. 2018).
For decades, the variance components were estimated from the mean squares in the linear model for fixed effects. Currently, in mixed models, the restricted maximum likelihood method (REML) is a widely used procedure for the estimation of variance components (Searle et al. 1992), when there are both fixed and random factors in the treatment structure of an experiment; thus, the genetic parameters of interest are estimated.
Heritability is the proportion of phenotypic variance that can be inherited in these parameters. It is not the portion of the phenotype attributed to genetics but rather a proportion of the phenotypic variance due to genetic factors. It has been described by Falconer & Mackay (1996), as the σ 2 g/ σ 2 f ratio defined from 0 to 1. The phenotypic variance (σ 2 f) is a variability measure that can be decomposed into genotypic (σ 2 g) and environmental (σ 2 e) variances and the genotype x environment interaction (σ 2 ge). The genotypic variance, in turn, is comprised of additive (σ 2 A) and epistatic (σ 2 AD) variances and dominance (σ 2 D). Heritability refers to a particular population that also develops under a particular environment. It is a property of the character, population, and environmental effects (Falconer, 1981). Further, the same character in two different populations can show different heritability values, which can vary when the environment is changed. This genetic parameter is essential to measure, in quantitative traits, the response to selection and efficiency in plant breeding (Bekele et al. 2012). According to Badiali et al. (1995), to know the variability and heritability of agronomic characters in the broad sense, their determination should be made in the environment in which the selection is carried out. Characters with high heritability can be improved faster and with less evaluation intensity than those with low H2. High heritability and genetic progress values allow a more effective selection based on phenotype expression. For their part, CVg and CVf coefficients provide information on the nature and magnitude of the variation. A high difference between these coefficients denotes a greater environmental effect on the character (Ali et al. 2016).
Several genetic breeding programs have contributed to the development of soybean varieties with high yields and adapted to different edaphoclimatic conditions of the low tropics. However, new, more competitive, and sustainable genetic alternatives must overcome this varietal offer. To this effect, it is necessary to have a broad genetic base, know its expression in the tropics, and study and apply the necessary genetic parameters that contribute to a successful selection. Additionally, having a highly diverse collection is not guaranteed to broaden the varietal genetic base if this variability is ineffective. Wysmierski et al. (2013), when evaluating the pedigrees of 444 Brazilian soybean varieties released (before 1971, 1971-1980, 1981-1990, 1991-2000, and 2001-2009), according to its origin (public or private), found a narrow genetic base comprised of four main ancestors (CNS, S-100, Nanking and Tokyo), contributing with 55.26 % of the diversity. Only 14 ancestors represent 92.41 % of the Brazilian genetic base. This genetic base is very similar to the one in the United States, sharing six of the main ancestors. Genetic variability is the primary factor in a breeding program when developing a superior variety. Furthermore, breeding will be faster if this variation is wide (Kuswantoro, 2017) and effective. Thus, estimates of genetic gain allow the breeder to know the potential genetic progress and guide the selection process (Vallejos et al. 2010).
The current research was aimed to determine the genetic parameters of broad-sense heritability, the coefficients of genetic and phenotypic variation, and the prediction of the genetic progress of 60 advanced soybean lines from a breeding program.
MATERIALS AND METHODS
Study area. The evaluation of soybean lines and varieties in a Preliminary Yield Trial (PYT) was carried out during the second semester of 2019 at the Taluma headquarters of Agrosavia, located in the municipality of Puerto López, department of Meta. The coordinates of the study area are 4°72' N latitude and 72°13' E longitude at 176 m a.s.l.
The climate of the study area is monomodal from April to December, with an average temperature of 25.8 °C and average annual rainfall of 2,200 mm irregular in frequency and intensity (Bernal et al. 2013). The soil is an oxisol of the Colombian Altillanura region, with an acidic pH (5.1), low contents of organic matter (1.63 %), phosphorus (8.8 ppm), and low cation exchange capacity (2.35 meq/100 g).
Genotypes. Sixty-four discriminated soybean (Glycine max L. Merril) genotypes were evaluated in 60 advanced lines (F6-F7) of the soybean genetic breeding program of Agrosavia, three registered commercial varieties of Agrosavia (C. Superior 6, C. Achagua 8, and C. Primavera 11), and the ICA variety Soyica P-34.
Experimental design, variables, and information analysis. The experimental units were distributed in an alpha lattice design of 8x8 (genotypes x block) with two repetitions, described by Patterson & Williams (1976). This design assumes that the variation within a block is less than between the units of different blocks, increasing the precision of the analysis by controlling experimental errors. Furthermore, the treatments had the same frequency in each block, i.e., the distribution of blocks and treatments was orthogonal. Orthogonality facilitates the mathematical computation necessary to produce an analysis of variation (Barreto et al. 1997).
Each experimental unit consisted of four rows of 5 m long, 0.45 m apart, and a distance between plants of 0.07 m. Agronomic management was uniform for all experimental units, following the technical recommendations for cultivation previously established by various national and international agricultural sector entities (Valencia & Ligarreto, 2010).
Variables evaluated: days to the beginning of flowering (DIF), days to full flowering (DFC), plant height to flowering (ALTF), number of nodes to flowering (NF), days to physiological maturity (DM), days period from flowering to maturity (DPFM), height to maturity (ALTM), number of nodes at maturity (NM), number of embryonic abortions or pod compartments without grain (AE), number of vain pods (VV), total number of pods (VT), weight of 100 grains (PG) in grams, and grain yield (REN) in t ha-1 adjusted to 14 % humidity.
An analysis of variance was carried out to evaluate the variability of the quantitative traits, according to the statistical model described by Singh & Bhatia (2017), as follows.
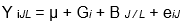
where Y iJL is the value of the character studied, μ is the general mean, G i is the genotype effect, B J / L is the block effect within each repetition, and e iJ is the experimental error.
The SAS 9.4 software (SAS Institute Inc, 2014) was used to analyze the information. Variance components for continuous variables were estimated by applying the linear mixed model (PROC MIXED), with the random-effects adjustment through the restricted maximum likelihood method (REML), proposed by Patterson & Thompson (1971). The generalized linear mixed model (PROC GLIMMIX) was applied for discrete variables. The repetitions were considered fixed in the model, while the lines/varieties and block (repetition) were random. The mixed model assumes normality, so it was necessary to transform using √x. With these variance components, genotypic (Vg) and phenotypic (Vf) variances, broad-sense heritability (H2), genotypic (CVg) and phenotypic (CVf) coefficients of variation, CVg/CVe ratio, genetic gain (GG), and genetic gain related to the mean (Gg) of each variable or character were estimated. The genetic parameters were calculated using the following formulas:
Broad-sense heritability H2=Vg/Vf*100, where Vg is the genotypic variance and Vf is the phenotypic variance (Allard, 1960). Its magnitude was valued as low (< 30 %), moderate (30-59 %), high (60-80 %), and very high (> 80 %).
Genetic gain (GG) = kσfH2 (Johnson et al. 1955), where k is the selection index, σ f is the phenotypic standard deviation, and H2 is the broad-sense heritability. The selection pressure is 20 % (K=1.4). Genetic gain was determined as its proportion with respect to the mean, i.e., Gg=GG/*100, where is the mean. Genetic progress was classified as low (< 10 %), moderate (10-20 %) and high (> 20 %).
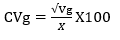
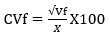
The genotypic and phenotypic coefficients of variation were calculated according to Burton & Devane (1953), as follows:
Coefficient of genotypic variation
Coefficient of phenotypic variation
Genetic variability was estimated as wide or narrow for a trait, based on genetic variance (Vg) and its standard deviations (σVg), as described by Sulistyo & Mejaya (2018). Genetic variability is wide if Vg is higher than twice the standard deviation of the genotypic variance (Vg>2 σVg), and it is narrow if the genotypic variance is less than or equal to two times the standard deviation of the genotypic variance (Vg≤2 σVg).
To obtain more information on the relations between agronomic and yield traits, the data, due to being on different scales, were standardized with the general mean and analyzed through multivariate methods with principal components (CP), using the PROC PRINCOMP instruction of SAS 9.4. (SAS institute inc, 2014).
RESULTS AND DISCUSSION
The statistical description of the original soybean lines and varieties population shows an important variability in the characters under study, both in flowering and in maturation and their yield components (Table 1). These results were ratified by the analysis and interpretation of mixed models applying REML, where the statistical differences between lines/varieties were evident for all the variables evaluated. For Pushpa Reni & Koteswara Rao (2013) and Ahsan et al. (2015), knowledge of the nature and magnitude of the variability between genotypes due to their attributes is essential for effective selection in varietal breeding. The assessment of the different genetic parameters estimated in the edaphoclimatic conditions of the current research is presented in table 2.
Table 1 Descriptive statistics of the original population of 60 lines and 4 soybean varieties in the Colombian Altillanura region 2019B.
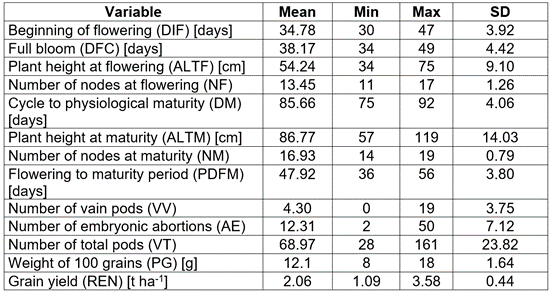
SD: Standard deviation.
Table 2 Genetic parameters of agronomic characters and yield components in a soybean population of 60 lines and four commercial varieties 2019B.
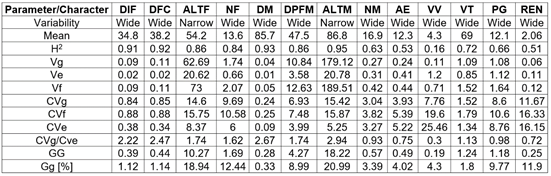
DIF: Days to the beginning of flowering; DFC: Days to full bloom; ALTF: Plant height from plant to flowering; NF: Number of nodes at flowering; DM: Days to maturity; DPFM: Days period from flowering to maturity; ALTM: Plant height at maturity; NM: Number of nodes at maturity; AE: Number of embryonic abortions; VV: Number of vain pods; VT: Number of total pods; PG: Weight of 100 grains; REN: Grain yield. H2: Broad-sense heritability; Vg: Genotypic variance; Ve: Error variance; Vf: Phenotypic variance; CVg and CVf: Genotypic and phenotypic variation coefficients; CVe: environmental variation coefficient; GG: Genetic gain; Gg: Genetic gain in relation to the mean.
Analysis of genetic parameters at flowering. In the mixed model analysis using REML, the flowering characters (DIF, DFC, and ALTF) and the Glimmix analysis for NF showed highly significant differences for the covariance parameter between genotypes (P <0.01). The variables at flowering showed high broad-sense heritabilities ranging from 84 to 92 %. The high heritability of flowering has also been reported by Ali et al. (2016) and Teixeira et al. (2017). In these very high heritability traits (> 80 %), the selection is relatively easy, since there is a close correspondence between the genotype and the phenotype due to the small relative contribution of the environment to the character (Singh, 2001), with a selection accuracy higher than 92 % as seen in table 2. CVf coefficients were higher than CVg, agreeing with the results found by Kuswantoro (2017). However, these coefficients were very close to each other, confirming the low environmental effect on flowering. Wide variability was observed for DIF, DFC, and NF, while in ALTF, the variability was narrow (Vg≤2 σVg). Similar results for DFC in their CVg were reported by Sulistyo & Mejaya (2018). The average genetic gains for DIF, DFC, and NF were less than 10 %, with a selection pressure of 20 %. However, in DFC, there is a significant potential to exploit since it is associated with the juvenile period and the growth habit of the genotypes. Soybean is a plant with short days (long dark period); it tends to flower early (short juvenile period) in the tropics, limiting grain production. According to Miranda et al. (2020), knowing the influence of the juvenile period and the growth habit, development, and adaptation are crucial to optimizing phenology and improving soybean yield potential in tropical environments. Fehr & Caviness (1977) established that temperature, day length and genotype are determining factors to initiate flowering and later reproductive development. In varieties with a determined growth habit, flowering is simultaneous in nearly the entire plant ((DFC-DIF) ≤2 days) and grows very shortly after initiating flowering. On the other hand, in varieties with an indeterminate growth habit ((DFC-DIF) ≥3 days), these continue to grow up to 50 % more. In the varietal breeding process, it is not enough to obtain genotypes with long juvenile periods and ideal plant architecture if there are not favorable environmental conditions to achieve the best plant performance to maximize yield and quality.
Analysis of genetic parameters at maturity. In ALTM, PDFM DPFM, DM, and NM, highly significant differences for the covariance parameter between genotypes (P <0.01) were found. ALTM, DM, and DPFM reached very high heritability values between 86 and 95 %, while in NM, the values reached only 63 %. High heritability has been reported in days to maturity (MD) by Kuswantoro (2017) and Ali et al. (2016), in ALTM and PDFM by Zhang et al. (2015) and in NM by Teixeira et al. (2017). In general, in traits with high heritability where the environmental effect is low or very low, effective selection can be made directly by the phenotype. In characters with heritability close to 60 %, there is a slight but important environmental effect to consider when carrying out selection processes. The selection accuracy in the very high heritability variables reached values higher than 93 % and only 80 % for NM. In these variables at maturity, the low environmental effect is ratified by the scarce difference between the coefficients of variation CVg and CVf of each character (Table 2). Similar results were reported by Chandrawat et al. (2017). Genetic variances, except for ALTM, were higher than two times their standard deviation (Vg>2 σVg), which, according to Sulistyo & Mejaya (2018), is an indicator of wide variability. Narrow variability (Vg≤2 σVg) was observed for ALTM and ALTF, as was also recorded by Kuswantoro (2017).
Although selection is more effective in populations with high genetic variability (Allard, 1960), its comprehensive analysis with the expected genetics gain is fundamental. The traits at maturity showed low genetic gain except for ALTM. It is necessary to increase the selection pressure (higher index) to increase the gain in a trait with high or moderate heritability and high CVg. If the expected objective is not achieved, it is essential to expand the genetic base of parents or validate the performance of the genotypes in favorable environments for the expression of the character of interest.
Analysis of genetic performance parameters and their components. There were highly significant differences for VT, PG, and REN between lines/varieties (P <0.001) and significant differences (P <0.05) for VV and AE. In these yield components, VT and PG achieved high heritability (72 and 66 %, respectively), moderate for AE (53 %) and REN (51 %), and low for VV (16 %). High heritability for VT and PG was also recorded by Ali et al. (2016). CVg and CVf showed differences associated with significant environmental and non-additive genetic effects. These effects were evident in order of importance: VV> REN> AE> PG with CVg/CVe ratios lower than 1 (Table 2). On the contrary, in VT, it was higher than 1, suggesting a lower environmental effect on this character.
In VV, the low heritability, the high difference between CVg and CVf, and a CVg/CVe ratio of 0.3 demonstrate a high environmental effect on the expression of the character. Something similar happened in AE (Table 2), with a moderate heritability of 53 % and a marked difference between the variation coefficients. These types of variables with high environmental effects make selection processes difficult because the phenotype does not fully describe the genotype, especially when their expected genetic gains were less than 4.3 %. Although VT reached high heritability, a CVg/CVe ratio higher than 1, and a wide variability (Vg>2 σVg), the genetic gain was still low, as also happened with PG (Table 2). High heritability and low expectation of genetic progress as a percentage of the mean may indicate that the trait may be governed by additive and non-additive gene actions, and selection to improve the trait may be challenging (Netra & Rabendra, 2019). The performance components VV, AE, and VT, were positively and significantly associated with days to full flowering (r=0.33*, 0.21*, and 0.26*, respectively), while PG was negative and significant (r=-0.40*). These results indicate that the longer the juvenile period (days to flowering), the greater the number of total pods, but with a high proportion of vain pods and grain abortion, coupled with a reduction in the weight of 100 grains.
Grain yield (REN) showed values from 1.09 to 3.58 t ha-1 and a general average of 2.06 t ha-1. The moderate heritability, a CVg/CVe ratio of 0.72, and other REN genetic parameters (Table 2) indicate additive action of genes on their expression and, according to Mohammed et al. (2019), the possibility of achieving genetic gains in selection. The grain yield was differential between lines/varieties and reached a moderate genetic gain of 0.25 t ha-1 (11.9 %). With the antecedents described in the analysis at maturity and the yield components, the water deficit in the reproductive state primarily affected the performance of the lines/varieties. Plant maturity accelerated, empty pod and embryonic abortion increased, and the weight of 100 grains was differentially reduced by an average of 32 % and, therefore, grain yield. A study on the response of no-till soybean to timing of preplant and foliar potassium applications in a claypan soil reported that in the period between flowering and grain filling, the highest water demand by the plant occurs (Nelson et al. 2004). In this period, a moderate or severe water deficit reduces the number of total pods associated with flower and pod abortion (Nunes et al. 2016) and reduces the quantity and quality of soybean seeds (Ku et al. 2013). Results showed marked differences between lines/varieties, and although late flowering genotypes could apparently be the most affected, there was no significant correlation between flowering and grain yield. This means that both early and late lines/varieties responded differently to this type of stress in the reproductive phase, generating an excellent selection opportunity for these particular climatic variability conditions.
The comprehensive analysis of the genetic parameters of grain yield and its components allows deducing that the variables VV and AE have little relevance when selecting lines due to their low heritability and genetic gain. The PG and VT characters with moderate to high heritability but with reduced genetic gain, and REN, with moderate values, are the most discriminant when identifying the superior lines in the study conditions.
Analysis of main components. Multivariate statistical techniques such as principal components are especially useful tools to describe or group a set of genotypes, simultaneously including several characteristics while considering the relations between all the characters under study (Rojas, 2003). A principal component analysis (PCA) is essential for the breeder because it allows identifying traits that contribute to significant genetic variability between genotypes and selecting those of interest for varietal breeding. The first four principal components contributed 81 % of the total variation in this analysis. However, CP1 is associated with flowering (42 %), CP2 with maturity (18 %), CP3 with yield and its components (13 %) and CP4 with the weight of 100 grains (8 %). In CP1, the variables at flowering had a positive and highly significant behavior together with the variables at maturity DM and VT, in inverse relation with ALTM, NM, and PG. In CP2, DM, ALTF, ALTM, and NM were highly significant and positively opposed to VT and REN. In CP3, REN, PG, VT, and NM showed a positive and highly significant association. These results confirm that the number of total pods was favored by long juvenile periods with an inverse response for the weight of 100 grains. This phenomenon is attributed to the scarcity of water resources when filling the pods and grains, with repercussions on final plant yield.
Gain yield is a quantitative character, a function of a large number of loci that control it, allowing a greater environmental influence and, consequently, a reduced relation between genotype and phenotype (Hamawaki et al. 2012). Although very complex, yield is highly relevant in generating new varieties. Its expression depends on many genetic-environmental variables that interact and deserve to be analyzed with caution. Currently, the aim is to increase performance in an economically viable way and in highly sustainable systems. Therefore, when selecting an improved line/variety, it is vital to consider its yield potential for a given environmental condition, phenotypic stability, tolerance to adverse biotic or abiotic factors, seed quality for multiplication and dissemination, and grain quality for the processing and consumer market.
Based on the results obtained, it can be concluded that a wide genetic variability and heritabilities from moderate to high (51 to 95 %) was found when evaluating genetic parameters in a population of 60 lines and four soybean varieties in the conditions of the Colombian Altillanura region, except for plant height with narrow variability (Vg≤2 σVg) and the number of vain pods with low heritability (16 %). In general, CVg/Cve ratios were close to or higher than 1, indicating a low environmental effect on the characters, except for VV, AE and REN, with indices much lower than 1. The number of total pods, empty pods, and flower abortions was higher in genotypes with long juvenile periods. The expected genetic gains for the next selection cycle were moderate to low (<20 %). The moderate heritability and grain yield gain (51 and 11.9 %, respectively) demonstrate an additive action of genes desirable for future recurrent selection. The most discriminating characters were, in their order, grain yield (REN), weight of 100 grains (PG), and total pods (VT). The adverse weather conditions that affected soybean cultivars differentially, as it is an increasingly recurrent situation of climatic variability in the Orinoquía region, make it essential to know the performance of all lines in multi-environment trials (yield trials - ER) to determine the effects of the genotype by environment interaction (GxE) and achieve an effective selection of those with the highest genetic potential for the Colombian Altillanura region.

