


 English (pdf)
 Article in xml format
 Article references
 Send this article by e-mail
 Cited by SciELO
  Cited by Google
  Similars in
SciELO
Similars in
SciELO  Similars in Google
 Permalink
INTRODUCTION
Geostatistical analyzes have been developed in the last decade as a tool to demonstrate the spatial dependence of different parameters, as input for site-specific management of water and soil resources and to encourage the development of strategic plans in geolocated areas. In general, it is necessary to use different software tools for the phased processing of the database. Some authors propose the use of the Gamma Design Plus (GS+) tool to obtain variograms, selecting models based on the best coefficient of determination "r2" and the smallest sum of the residual of squares when theoretical variance models such as spherical, exponential, and Gaussian (Cortez et al. 2018), but with the need to use a new additional tool for generating Kriging interpolations with graphical output.
Other authors as Schossler et al. (2019) propose the implementation of combined tools, generating the construction of variograms in the GS+ software and the generation of contour maps with the Surfer v. 8.0, that is, without the possibility of integration in a single environment and requiring a greater processing time per variable. The third group of researchers suggests developing geostatistical analyzes with the robust Cressie variance estimator, which allows an omnidirectional analysis of 2D variograms (Alesso et al. 2020).
About the variables used to test the reliability of the proposed methodology, penetration resistance (RP, for its initials in Spanish) is defined as a variable that represents the physical-mechanical quality of the soil (Guimarães et al. 2013), evaluated to identify the degree of compaction in surface layers (estimated in MPa), and indirectly measure the energy that a crop root must develop to deform the soil structure (Cortés-D. et al. 2016), and establish the anchoring conditions according to the ground conditions. It particularly defines the level of restriction for the development of the effective roots of crops (Hummel et al. 2004), which simultaneously affects the movement of water through the pores of the natural substrate (Machiwal et al. 2006), highlighting that this last process is fundamental for the capture and distribution of water and nutrients, especially for situations where it is sought to establish the effect of potential soil restrictions on physiological and productive developments (Medina et al. 2012) and with greater incidence if, in addition, the apparent spatial variations of soil properties are not considered (Da Silva Martins et al. 2010).
The movement of water in the soil is generally analyzed through infiltration (i) (Fasinmirin et al. 2018), a hydrodynamic parameter that describes a unidirectional movement (vertical downwards) that, by supplying a constant head of pressure, aims to simulate the application of a sheet of irrigation with the constant flow; results that are used as the basis for the design and operation of sprinkler and/or micro-sprinkler irrigation systems (Orjuela-Matta et al. 2011).
Multiple studies around the spatial variation of physical, hydrodynamic, and physical-mechanical parameters of the soil (Camacho-Tamayo et al. 2013), established univariate and bivariate geostatistical analyzes (Cortes-D. et al. 2018) and in some cases defining analyzes of temporal variability of these properties, have been developed to generate strategies for localized management of activities inherent to agronomic management (Gebler et al. 2015).
Traditional methodologies require the use of multiple computer tools for processing geospatial data. One of the purposes is to facilitate the process through a single work environment with a graphical output option, with alternatives with a free use license (R Studio). Additionally, the methodological proposal is based on processing the raw data without adjusting known probability distributions and subsequently, for graphical representation, adjusting to known variance models available in the same processing tool. The proposed methodology allows for reducing response times in the processing and representation of spatial information captured in the field and facilitates decision-making based on the graphic results achieved.
Geostatistics is the predominant tool to describe and analyze spatial changes in the soil (Rodríguez-Vásquez et al. 2008), which allows the generation of Site-Specific Management Methodologies, where a series of sampling in georeferenced nodes and through the use of an interpolation technique known as Kriging, contour maps are generated for each of the variables of interest, according to the previous adjustment of theoretical variograms from experimental data represented graphically and according to the degree of spatial dependency detected (Cortés-D et al. 2016).
Projects developing similar analysis methodologies have been developed for other cultivars and different soil and climate conditions, allowing this methodology to be validated according to the variation of soil properties depending on the particular production conditions, such as the results highlighted in the project “Metodología de Manejo por Sitio Específico de un suelo con vocación agrícola, a partir de análisis de variabilidad espacial de parámetros físicos - mecánicos e hidrodinámicos”, as a basis for testing Site-Specific Management methodologies, developed by the authors of this article.
The objective of this study was to build and validate a spatial analysis methodology for penetration resistance and soil infiltration. As a case study, the spatial variation of these properties was evaluated for an instant or moment within a productive cycle of the Feijoa (Acca sellowiana) crop, for a period defined for the investigation.
MATERIALS AND METHODS
It is intended to discriminate the stages that were designed and implemented to establish the spatial correlation between the RP and the infiltration of water in the soil.
Design and construction of the methodology. The stages developed and that make up the advanced methodological structure are described below.
Preliminary stage. Definition of parameters to be evaluated: Infiltration and Resistance to Penetration, then the definition of a sampling mesh (40 x 40 m). After that, enlistment of equipment required for the measurement of parameters:
Double infiltrometer rings height 0.4 m, internal diameter 0.2 m, external diameter 0.4 m.
Spectrum technologies, Inc. brand penetrometer, number 6120 (4 depths).
Parameter measurement stage. Establishment of sampling mesh in the field, then georeferencing of sampling nodes, according to the variable to evaluate, including.
Soil sampling at two depths (0.07 m and 0.15 m) using the ring method with known volume: 0.07 m high x 0.05 m diameter.
Penetration resistance measurement for four defined depths. RP1: 0.08 m; RP2: 0,15 m; RP3: 0.23 m; RP4: 0.30 m. The maximum root depth of the crop was estimated in 0.50 m.
Development of infiltration tests with double ring infiltrometers, with a duration of 60 minutes per test.
Data organization and processing stage. Generation of captured data tables with the physical variables of the soil and resistance to penetration, then processing of infiltration data with adjustment to empirical models: Kostiakov, Kostiakov - Lewis and Philip, and generation of associated parameters. After that obtain input parameters per node including consolidated and georeferenced data (according to the number of variables to be evaluated per sampling point), then input consolidated data (.csv file) for processing in QGIS v. 2.18.28 with data matrix organized with geographic coordinates (.csv file). After that generation of individual output files "shape" (.shp) with the information of nodes and polygon of the lot. It needs transformation to planar coordinates and generation of the independent output file for nodes and polygon of the lot area. Then load shapefiles (.shp) into Rstudio, starting with the information for each node. Finally, a script for processing in Rstudio by variable, with tabulated and graphical results.
Descriptive statistics by variable.
Empirical variograms by variable.
Adjustment to theoretical variograms by variable. Visual method to adjust experimental data based on saddle data, nugget effect, and range, as well as the degree of spatial dependence (GDE).
Generation of contour maps by variable (Cortes-D. et al. 2018). i) Selection of the best fit theoretical variogram model based on the saddle data, nugget effect, and range, as well as the degree of spatial dependence (GDE). ii) Generation of temporary graphical output of the contour map. iii)Generation of graphical output of the interpolation variance map, articulated with the Kriging Interpolation Incidence (KII) (Table 1; Table 2). iv) Visual verification of the homogeneity of the interpolation variance, on an individual variance map. v) Process iteration if the selected variogram generates a high interpolation variance. vi) Generation of source code for printing definitive maps.
Table 1 Selection of theoretical variance models for the hydrodynamic and physical parameters of the soil.
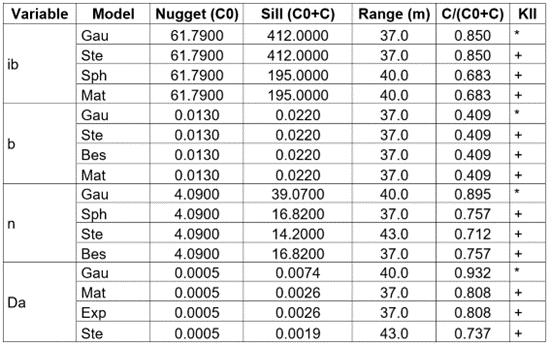
* Homogeneity in the variance of the Kriging interpolation; + Heterogeneity in the variance of the Kriging Interpolation; C/(C0+C): Degree of spatial dependence; Ste: Mater Stein parameterization; Nug: Pure nugget effect; Exp: Exponential; Bes: Bessel; Hol: Hole; Gau: Gaussian; Wav: wave; Exc: Exponential class; Sph: Spherical; Rug: Matron; KII: Kriging Incidence Interpolation; ib: basic infiltration; Ks: Saturated hydraulic conductivity; S: Sortivity; a, b: Kostiakov model empirical parameter; Da: bulk density; n: total porosity.
Table 2 Selection of theoretical variance models for the physical-mechanical parameters of the soil.
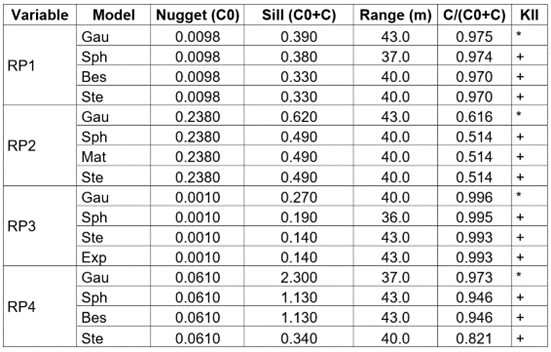
* Homogeneity in the variance of the Kriging interpolation; + Heterogeneity in the variance of the Kriging interpolation; C/(C0+C): Degree of spatial dependence; Ste: Mater Stein parameterization; Nug: Pure nugget effect; Exp: Exponential; Bes: Bessel; Hol: Hole; Gau: Gaussian; Sph: Spherical; Mat: Matron; KII: Kriging Incidence Interpolation; RP1: Penetration Resistance at depth 0.08 m; RP2: Penetration Resistance at depth 0.15 m; RP3: Penetration Resistance at depth 0.23 m, RP4: Penetration Resistance at depth 0.30 m.
Analysis of results. Start with the generation of tables with the best fit theoretical variance models, then a presentation of contour maps with variables that showed spatial dependence. After that the analysis of variables that showed a degree of spatial dependence (DSD), as well as those that showed a nugget effect. Finally, a presentation of variance maps of the Kriging interpolations was selected and identified as the "best fit".
Experimental zone. The research was developed in the El Cortijo farm where previous studies have been carried out as the work of García et al. (2008), the farm is located in the rural area of the municipality of La Vega, Cundinamarca, Colombia (4°55’16.89’’ N, 74°17’29.98’’ W). The property is located at an altitude of 2,352 m and is part of the Sabaneta River Sub-basin with clay loam texture without the apparent effect of compaction, an area destined for the production of feijoa, which is a species of perennial fruit of the Myrtaceae family (Parra-Coronado et al. 2018). According to data from the Sabaneta Ordinary Climatological Station (code 2306510), the average annual temperature does not suffer great variability, ranging between 12.4 and 14.8 °C, an average annual rainfall of 1442.8 mm, an average annual relative humidity of 83%, and 1,377 hours of annual sunshine (CAR, 2014). According to Holdridge's classification system, the “life zone” is called “Lower Montane Very Humid Forest (Bmh - MB).
Measurement of variables and sampling. For data collection, sampling nodes were defined forming a rectangular grid of 40 m x 40 m, to cover an area of 1.36 ha, with repetition in data capture. Penetration resistance was determined with a Spectrum technology, Inc. brand penetrometer (Duffera et al. 2007), number 6120, for four defined depths (RP1, RP2, RP3, RP4): 0.0762 m (7.62 cm), 0.1524 m (15.24 cm), 0.2286 m (22.86 cm), 0.3048 m (30.48 cm), associated with different effective root depths of a feijoa crop. Infiltration was determined through the use of double-ring infiltrometers (Orjuela-Matta et al. 2010; Kroulík et al. 2007) of 0.2 m and 0.40 m in internal and external diameter, and a height of 0.4 m, for 60 min, maintaining a constant pressure head, guaranteeing application rates in the state stable.
Analysis of data. Before spatial analysis, the captured infiltration data were fitted to the Kostiakov, Kostiakov - Lewis and Philip empirical models (Haghighi Fashi et al. 2014). The main hydrodynamic variables analyzed with univariate Geostatistics were the saturated hydraulic conductivity (Ks) of the Philip model (Shiraki et al. 2019), parameters "a" and "b" of the Kostiakov model, basic infiltration (ib) of the Kostiakov - Lewis model (Orjuela-Matta et al. 2012), and the “sorptivity” (S) of the Philip model (Sihag et al. 2018).
For all the data, experimental variograms were generated, based on the definitions established in the theory of regionalized variables, using the general expression (Da Silva Martins et al. 2010):
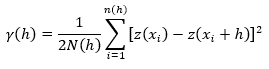
The experimental data, the adjustment to theoretical variograms, the Ordinary Kriging Interpolation, and the generation of the contour and variance maps per parameter, were developed integrally with the Rstudio v. 1.1.456 (RStudio Team, 2018), which operates as an interface to the R v. 3.6.1 (R Core Team, 2018). The fit to the variance models was based on the analysis of the coefficients the Nugget Effect (C0), the Sill (C0+C), and the Range (a). In addition, the degree of spatial dependence (DSD) will be extended for each variable from the relationship between the sill and the nugget effect (C/(C0+C)), classifying it as strong, when DSD>75 %, moderate for DSD between 25 % and 75 %, and weak, if DSD<25 % (Cortés-D et al. 2016), with special attention when pure nugget effect occurs.
With the selection of the best fit theoretical variogram, the Ordinary Kriging technique was implemented to advance predictions in the non-sampled regions of the lot, generating a graphic environment of the contour maps by variable, together with variance maps, allowing to analyze the reliability and degree of interpolation adjustment.
RESULTS AND DISCUSSION
The maximum Euclidean distance of the sample, considered for the construction of the variograms, was 45 m, and a range between 35 m and 45 m was estimated for each of the variables evaluated, which represents the univariate spatial dependence of this lot. The foregoing represents that the sampling distance from the implemented methodology and analysis is within the initially selected range, failing a variation of georeferenced demonstration points between 35 m and 45 m, with utility for future tests, and in that same range existence spatial dependence for each parameter evaluated.
The parameters for the variable’s basic infiltration (ib), porosity (n), and bulk density (Da), which were used to generate the strong spatial dependence models, are recorded in table 1. These other variables were used for checking the relations between penetration resistance and infiltration.
The RP1 variable suggests a moderate compaction trend (Figure 1) in the areas with less slope (Figure 2) of the terrain, which suggests a region with a sufficient root growth condition, while RP2 does not show an apparent densification process, indicating for this depth good conditions for root development. Variables RP3 and RP4 (Figure 1; Table 2), suggest the incidence of compaction in the peripheral area and the middle north third of the lot, independent of the variations in the slope of the land. The results for these variables point to a condition of sufficient root growth (RP3) and a condition of poor root development (RP4), according to the description in the user manual of the penetrometer used (ranges). This behavior was considered comparable for plots with similar slopes in the same site. Analog studies with the relation between compaction and slope have been reported previously to assess problems associated with soil compaction and root growth (Rodríguez-Vásquez et al. 2008).
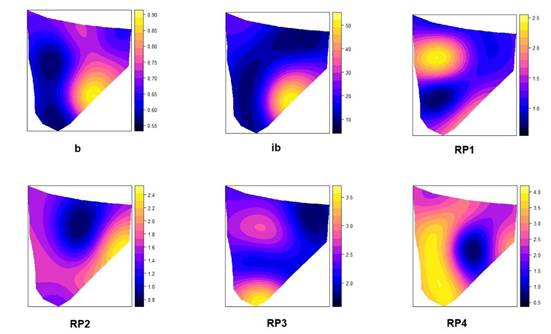
Figure 1 Contour maps generated from the Ordinary Kriging interpolation for the variables resulting from infiltration and resistance to penetration. Kostiakov parameter (b), basic infiltration (ib) in cm h-1, penetration resistance for four depts (RP1, RP2, RP3, RP4) in MPa.
Figure 2 The topographic profile of the lot is evaluated on the orientation of the greatest slope (width of the lot, West-East direction).
When comparing these latest results with the basic infiltration rates, it is estimated that ib decreases between 76 % and 82 %, in these areas, which coincides with what was published by (Chyba et al. 2014), although it is noteworthy that the authors evaluated the incidence of machinery traffic on the infiltration of water into the soil, using the cone index parameter. Low infiltration rates suggest a water deficit, which could promote negative effects on processes such as photosynthesis, respiration, growth, and metabolic reactions of feijoa (Peña Baracaldo & Cabezas Gutiérrez, 2014). In this case, the densification processes at these depths (RP3 and RP4) are argued because the crop has an establishment age of 15 years, which implies that the soil has not suffered mechanical alterations since sowing with machinery but if it has had anthropic effects of usual soil management for the maintenance of the crop. In addition, cultural practices are developed manually because the lot has an average slope of 25 %, in a scheme of the high density of trees with a separation between plants of 2.5 m and separation between rows of 4.0 m (García et al. 2008), making mechanized work difficult.
The results of RP1, RP2, RP3, and RP4 (Table 2) indicate that the spatial dependence of the cone index or penetration resistance increases as the sample is deepened (Chyba et al. 2017), in this case suggesting a densification proportional to the analyzed depth because of the cultural practices developed for the establishment and management of the crop.
Similar results for the compaction analysis in oxisol soils without the use of agricultural machinery report an increase in soil densification as a function of depth, suggesting a relation with the cultural practices (Camacho-Tamayo et al. 2013), particularly if the soils do not have evidence of the use of tillage activities (Cortez et al. 2018).
The proposed methodology offers the alternative of integrated processing in a single script, reducing the time to generate results, necessary to project a site-specific management implementation on land with variable slope, by identifying the dynamics between infiltration and penetration resistance, demonstrating the reliability to establish the relationships of spatial dependence between the physical and mechanical characteristics of the terrain.
Researchers such as Rodríguez-Vásquez et al. (2008), related the variation of infiltration in soil with spatial variations of bulk density. In fact, bulk density is a variable with a high correlation with RP (Table 1; Table 2). This variable was analyzed in the present study but as the dependent variable of infiltration and penetration resistance and verified to DSD “moderate to strong” which results in a definition for new separations sampling used to represent the contour maps, it means new sampling to 45m.
It was shown that in long-lived perennial crops such as feijoa, the spatial distribution of soil attributes such as penetration resistance and infiltration are particularly due to natural densification processes. Alterations in the infiltration rate point to the presence of compact zones for different depths, confirmed by the changes detected in penetration resistance according to variations in-depth, a condition that could influence the heterogeneity of physiological and productive development, validated with verification of bulk density, as a variable in space (Table 1).
The proposed methodology has the option of replicating itself parallel to other agronomic planning activities associated with the crop, although for these soil characteristics (physical, chemical, and microbiological), it is suggested to reduce the sampling separations to increase the probability of establishing a degree of spatial dependence on a greater number of parameters. Larger sampling separations while maintaining spatial dependency allow a reduction of processing and analysis times for future studies, although this depends on the soil characteristics.
The processing methodology is an alternative to represent the spatial variation through contour maps of the different parameters of soil as a base for planning agronomic activities. It is necessary to find the range of separation sampling combining the variables analyzed to understand different times or moments related to the crop cycle because each parameter could change the spatial dependence according to the dynamic of water in soils. This study had this limitation because it was analyzed in one moment.

