


 English (pdf)
 Article in xml format
 Article references
 Send this article by e-mail
 Cited by SciELO
  Cited by Google
  Similars in
SciELO
Similars in
SciELO  Similars in Google
 Permalink
INTRODUCTION
The need to satisfy a growing demand for food is substantially related to the management of water and soil resources, compared to the phenological behavior of crops, often ignoring the particularities of the terrain (Da Silva Martins et al. 2010). An efficient distribution of water, seen from the design and operation of an irrigation system, depends fundamentally on the infiltration capacity, considering also that there is the heterogeneity of the physical properties of soils, which generate zones of non-uniform and variable infiltration speed in space (Novak et al. 2000), affecting the efficiency of the irrigation water distribution rate (Machiwal et al. 2006), over an area, according to the development of agricultural work, within the period marked by each crop cycle. When these speeds promote rapid saturation of the soil pores, water flows are formed as surface runoff, with such intensity and duration that they can trigger degradation processes in the soil (Da Silva Martins et al. 2010). The infiltration capacity depends on the changes in the different physical properties of the soils, such as organic matter content, porosity, apparent density, and real density, where low humidity levels suggest high infiltration rates in the first moments in which the movement of water in the soil occurs, with decreasing modifications as the empty pores of the soil become saturated with water over time (Liu et al. 2011).
The spatial and temporal variation of infiltration in agricultural areas under irrigation or with irrigation potential has been evaluated by different researchers, as suggested by Jaynes & Hunsaker (1989), Camacho-Tamayo et al. (2013) y Cortes-D. et al. (2018), defining spatial changes in infiltration as a function of variations in soil moisture content (Guzmán-Rojo et al. 2019; Gebler et al. 2015), above all, due to changes in the soil matrix potential, a highly relevant variable in irrigation programming (Orjuela-Matta et al. 2011), and in general, by hydro-physical and physical-mechanical attributes, which lead to localized planning and management by the specific site (Cortés-D. et al. 2016; Medina et al. 2012), in agricultural soils with crop rotations and variable phenology.
One of the most usual techniques to evaluate infiltration, for irrigation purposes under the management methodology by a specific site, to identify regions with similar characteristics (Moshia et al. 2014), is Geostatistics, a tool that allows for determining Spatial-temporal distribution models (Varón-Ramírez et al. 2018; Alesso et al. 2020), and its relationship with physical, hydrodynamic and physical-mechanical parameters of the soil, evaluated on a georeferenced sampling grid or mesh (Rodríguez-Vásquez et al. 2008).
The objective of this study was to develop an integrated methodology for geostatistical processing in Rstudio from infiltration sheet data, obtained using double infiltrometer rings for different test periods, generated at two moments of the crop cycle, related to the germination and harvest season, from a pea crop, located in the Bogotá Savanna, Colombia.
MATERIALS AND METHODS
The research was developed in the rural area of the municipality of Tenjo (4°48’ 14.9” N, 74°10’23.7” W), Cundinamarca, Colombia. The area has a warm and temperate climate, according to the Köppen-Geiger classification (Peel et al. 2007), and a Cold Humid climate, according to the Caldas-Lang model (IGAC, 2011). The average altitude of the region is estimated at 2.580 meters, with an average temperature of 12.5 °C, relative humidity between 74 and 86 %, and an average annual rainfall of 765 mm (Parra-Coronado et al. 2018). The predominant soil corresponds to the Inceptisol series, particularly Fluventic Eutrodepts, followed by Typic Dystrudepts, with thick loam and fine loam families, respectively, which present flat slopes, with a gradient ranging between 1 and 3 %, and texture class silty loam to loam (IGAC, 2011).
For data collection, infiltration tests were defined in two periods called Phase I and II, which are related to the germination phase (15 days after the sowing) and harvest phase (15 days before harvest) with a duration of 80 minutes per test, using double infiltrometer rings, with dimensions of 0.2 m and 0.4 m in internal and external diameter, respectively, and a height of 0.4 m, on a total of 48 points, distributed perpendicularly, on a rectangular mesh of 20 x 20 m (De Lima et al. 2015), until covering an area of 1.6 ha, on which a pea crop was arranged. This methodology starts from an existing geostatistical process but with modifications in the processing stages because it takes the data with integration to a unique tool (Rstudio) to calculate and develop contour maps for analyzing variables without making adjusting data to normal distribution. The purpose was to prove the degree of accuracy of the methodology through the process in the tool and validate the adjusted methodology developed for each variable. The validation included the generation of contour maps and variance maps to establish the distribution of the spatial variability, and the homogeneity of the spatial variance by analyzed variable.
The data obtained allowed evaluation of the accumulated infiltration, defined for different moments: 1, 2, 3, 4, 5, 10, 15, 20, 25, 30, 40, 50, 60, 70, 80 minutes, guaranteeing the Obtaining 15 infiltration sheet data per node and per phase, covering as a reference, two key stages within the crop cycle, these are germination and harvest.
First, the infiltration data were organized in a data matrix, making initial adjustments to empirical infiltration models such as Kostiakov, Kostiakov-Lewis, and Philip as it is mentioned by (Orjuela-Matta et al. 2012; Rodríguez-Vásquez et al. 2008; Fasinmirin et al. 2018). After that, it proceeded to organize the instantaneous values of infiltration per node corresponding to each period evaluated. These input data were organized in independent arrays, generating files for the development of geospatial analyses for each of the 15 data obtained in each of the study phases. For each data matrix associated with each instant of infiltration time, the spatial dependence was determined, based on what was defined in the theory of regionalized variables, initially constructing the experimental variograms, according to the following expression:
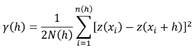
Where γ(h), represents the experimental variogram, z(xi ) is the value of the variable at site x, z(x_i+h) is another sample value separated by a distance h, and N is the number of pairs separated by a distance h (Hossain Bhuiyan et al. 2016).
The experimental values was adjusted to a theoretical variance model, with the purpose of estimating the coefficients without defining a fit to a normal distribution with the de purpose of establishing the spatial variation of the data captured in the field: Nugget Effect (C0), Sill (C0+C), and Range (a). The Sill is a value of the variance that gives stability to the model, while the Range is the limit distance for which there is a constant correlation (Orjuela-Matta et al. 2012). In the cases in which the Nugget Effect occurs, this is an indicator of the discontinuity between the samples or spatial variability that has not been detected within the sampling process (Cucunubá-Melo et al. 2011).
The Rstudio and R tool were used to process de initial data but with a programming code, with which data previously processed in GIS tools (QGIS v. 2.18.28) is loaded using files with “.shp” (shape) extension, distinguishing the lot through polygons and the sampling sites as points. This part is essential because spatial modeling in Rstudio needs to define an “around area” to construct the interpolation process with the collecting data. This process is realized per each variable considered in the study.
After that, in Rstudio the collected data loaded as “shape files” are processed to generate the experimental variograms, defining a processing code to establish different parameters to generate theoretical variograms. The adjustment of the experimental variograms to the theoretical ones was developed by visual methods, for which the software tool used Rstudio v. 2022.07.1 (RStudio Team, 2022), which operates as an interface to the R v tool. 4.1.3 (R Core Team, 2021), offers the possibility of executing different theoretical variance models, allowing the manual modification of the parameters (Range, nugget effect, and sill), to ensure minimum interpolation variances, based on the results generated and identified in the experimental variograms. The R software tool, especially the Rstudio interface, has 17 variance models in its library, which were fully tested with each of the 15 data samples for each node and study phase. As an example, the equation of the theoretical Gaussian variance model is presented, where the spatial dependence vanishes when the distance (range) tends to infinity (Cucunubá-Melo et al. 2011):
With the degree of spatial dependence parameter (DSD), estimated from the relationship between the sill and the nugget effect (C/(C_0+C)), the dependence of the accumulated infiltration for each evaluated instant was established, classifying it as strong, when DSD>75 %, moderate for DSD between 25 % and 75 %, and weak, if DSD<25 % (Cortés-D. et al. 2018). If the degree of spatial dependence is close to zero, it is said that the experimental variogram detects a nugget effect, evidencing randomness in the spatial distribution of the variable (Haghighi-Fashi et al. 2014).
After evaluating the degree of spatial dependence, and once the theoretical variogram with the best-adjusted fit per parameter was selected, with the R software through Rstudio, the Ordinary Kriging technique was implemented, with the purpose of generating the contour maps, for the 15 data arranged on each of the 48 georeferenced nodes, for each evaluation phase (moment). In addition, Kriging variance maps were generated for the same number of data, with the purpose of evaluating the reliability and degree of adjustment in the spatial interpolation.
RESULTS AND DISCUSSION
The maximum Euclidean sampling distance considered for the analysis of the variograms was 85 m, although, during the construction of the theoretical variograms, a range between 32.0 and 85.0 m was estimated for the increasing instants of infiltration (1 to 5 min), while for the period of infiltration recession (10 to 80 min), distances between 32.0 and 80.0 m were examined, in Phases I and II, verifying the degree of adjustment of the theoretical variograms to the experimental ones by means of the visual method, with the ease offered by the R software, of "running" specific lines of code, allowing the individual graphic visualization of the degree of adjustment by variable, the Gaussian being the predominant variogram model (Haghighi-Fashi et al. 2014), followed by the Bessel model. The Kriging interpolation model (Figure 1), by variable, was evaluated using the cross-validation coefficient (CVC) (Faraco et al. 2008), and also generated the variance of the interpolation (Figure 2), verifying the variogram with the highest degree of adjustment (Figure 3) for the elaboration of the contour maps of the accumulated infiltration (Figure 4).
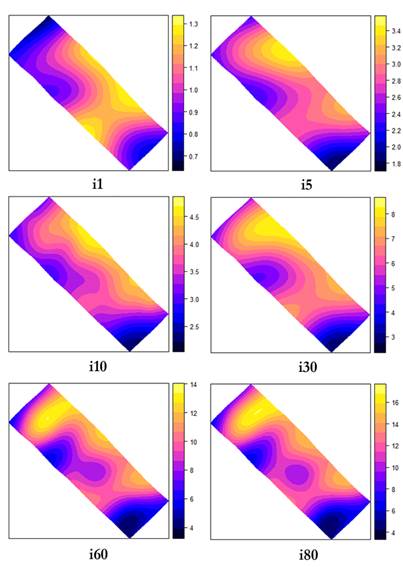
Figure 1 Contour maps generated through the Kriging Interpolation to phase I (germination phase of a pea crop in the Bogotá savanna) process and different times. i10 to i 80: refers to instants 10 to 80 min.
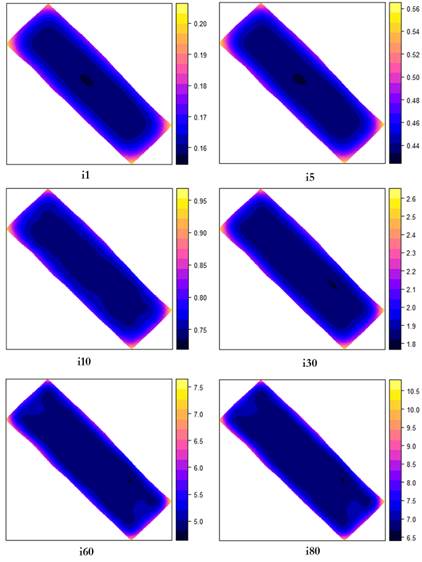
Figure 2 Variance generating starts with the Kriging Interpolations process in the phase I (germination phase of a pea crop in the Bogotá savanna). i10 to i 80: refers to instants 10 to 80 min.
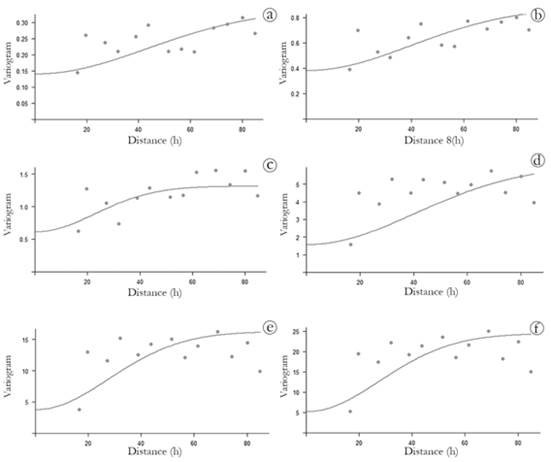
Figure 3 Theoretical variograms are adjusted as input data to generate contour maps. a) Bessel variogram for instant of 1 minute; b) Gaussian variogram for instant of 5 minutes; c) Gaussian variogram for instant of 10 minutes; d) Hole variogram for instant of 30 minutes; e) Hole variogram for instant of 60 minutes; f) Bessel variogram for instant of 80 minutes.
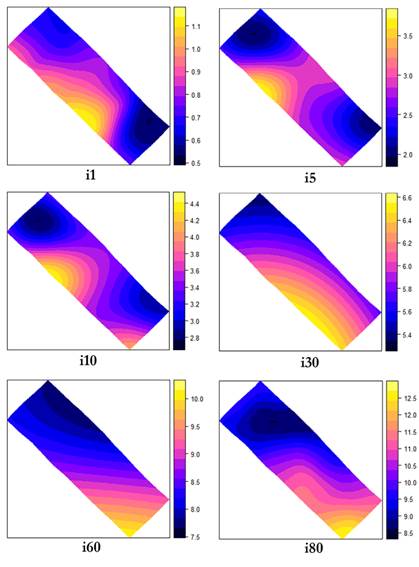
Figure 4 Contour maps generating of infiltration data for Kriging Interpolation before phase II (harvest of a pea crop in the Bogotá savanna). i10 to i 80: refers to instants 10 to 80 min.
The results suggest that the DSD is in a weak to moderate classification for the first 5 minutes of the infiltration test, in phase I (Table 1), while for the remaining 70 minutes, DSD (Grade of Spatial Dependence) is mostly preserved in the moderate to strong categories (Table 2). The foregoing suggests that the degree of spatial dependence of the hydro-physical parameter (i) increases, to the extent that saturation of the soil pore space occurs, as a consequence of the increase in accumulated infiltration, in a specific period, demonstrating a direct relationship between the time of the test and the degree of spatial dependence of the infiltration.
Table 1 Selection of theoretical variogram models for the first five instants of infiltration in the phase I (germination phase of a pea crop in the Bogotá savanna).
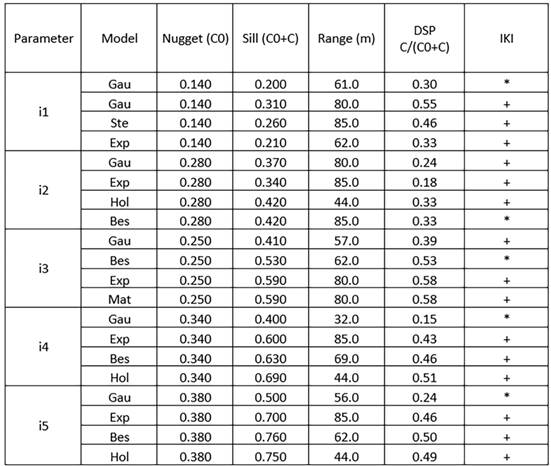
* Variance Homogeneity with Kriging Interpolation; + Variance Heterogeneity with Kriging Interpolation; DSP C/(C0+C): Degree of Spatial Dependence; Ste: Mater Stein Parameterization; Cir: Circular; Exp: Exponential; Bes: Bessel; Hol: Hole; Gau: Gaussian; IKI: Incidence in Kriging Interpolation; i1 to i5: accumulate infiltration to instants 1 to 5 min.
Table 2 Selection of variogram theoretical models for instants 5 to 80 min for the phase I (germination phase of a pea crop in the Bogotá savanna).
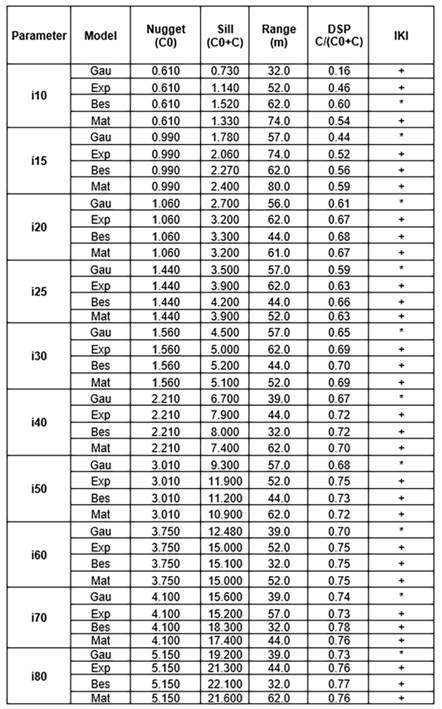
* Variance Homogeneity with Kriging Interpolation; + Variance Heterogeneity with Kriging Interpolation; DSP C/(C0+C): Degree of Spatial Dependence; Ste: Mater Stein Parameterization; Cir: Circular; Exp: Exponential; Bes: Bessel; Hol: Hole; Gau: Gaussian; IKI: Incidence in Kriging Interpolation; i10 to i80: accumulate infiltration to instants 10 to 80 min.
The Incidence in Kriging Interpolation (IKI) indicates the selection of the theoretical variograms with which the best degree of adjustment was achieved, with respect to the experimental variance models, corroborated information according to the degree of homogeneity or heterogeneity identified in the variance maps. of the interpolation, generated in Rstudio (Figure 2).
The results of DSD at the end of the infiltration test in phase I indicate relative reliability of the fit of the data to the theoretical variograms, a necessary condition to reduce the uncertainty during the interpolation process, and the generation of contour maps.
The contour maps (Figures 1 and 4) confirm the existence of spatial variability of the accumulated infiltration on a plot cultivated with pea crop, determined mainly by the incidence of the size and distribution of the roots of the crop. (Imhoff et al. 2010).
In all the cases of Phase I, the lowest ranges of accumulated infiltration were concentrated in the first georeferenced nodes, while the highest magnitudes of accumulated infiltration were observed towards the final nodes, showing a marked dependence, for each of the instants in which the hydro-physical parameter was evaluated, showing spatial heterogeneity.
The variance maps (Figure 2) indicate a relative homogeneity during the Kriging interpolation process, confirming that the selected theoretical variograms (Tables 1 and 2) were the ones that presented the best degree of adjustment to define the behavior of the accumulated infiltration, for each of the instants evaluated in Phase I. However, the trend of the variance was incremental, showing a direct relationship between the variation of the accumulated infiltration and the time of the test, suggesting that the soil was not in a condition close to saturation at the end of the 80-minute test. The adjusted processing methodology demonstrates these given that it is effective in evaluating the spatial variability of the infiltration parameters, with special relevance to the results of accumulated infiltration, but establishing the spatial variations of water movement in the soil as a function of the time of the test.
For the increasing instants of accumulated infiltration (instants 1 to 5 min) of Phase II, it was determined that DSD is in a moderate range, while for the recession period (instants 10 to 80 min) of the hydrodynamic parameter (i), the degree of spatial dependence was estimated from moderate to weak.
It is important to note that in Phase II (harvest), the accumulated infiltration for instants 25, 40, and 50 min, showed a degree of spatial dependence close to zero, which suggests a nugget effect, and, therefore, spatial randomness of the hydro-physical parameter, therefore, the sampling distances at those moments were not sufficient to establish spatial variability. Again, the adjusted processing methodology demonstrates these given that it is effective in evaluating the spatial variability of the infiltration parameters, with special relevance to the results of accumulated infiltration, but in this case not with the same precision compared to phase I, which still de sampling was the development with the same distance between nodes.
When comparing the contour maps of Phases I and II (Figures 1 and 4), it can be seen that the magnitudes of accumulated infiltration are similar for moments 1 to 5 min. However, the magnitudes of accumulated infiltration for instants 10 to 80 min decreased significantly during Phase II. The identification of larger areas with lower infiltration ranges suggests the existence of natural densification processes in the soil throughout the crop cycle, demonstrated with the processing methodology developed. The differences between the accumulated infiltration of Phases I and II could be argued because before planting peas, in the study lot, the land preparation was carried out with agricultural machinery, together with cultural practices such as weed control, while, from the middle of the cycle to the harvest, the activities carried out to sustain the crop were minimal. Additionally, a higher moisture content stored in the soil decreases the empty spaces present in the porous medium, generating reductions in water movement (Rodríguez-Vásquez et al. 2008; Hummel et al. 2004; Guimarães et al. 2013), affecting the accumulated infiltration of Phase II.
The results obtained in both phases were used to analyze a simulation process for irrigation programming of a localized system (drip), with validation of the adjusted methodology of the data processing, with integration between irrigation programming and the contour maps allowing the generation of infiltration differentiated by sectors, discriminating variation in times and irrigation sheets, and considering the variations sectorized in the simulated application periods between the periods 1 to 10 minutes and 10 to 30 minutes, which are those corresponding to a daily scheduled irrigation application for pea cultivation, according to a proposed irrigation design.
Evaluating the spatial variability of soil infiltration through geostatistical techniques, compared to different moments and periods associated with variations in crop development with this adjusted methodology, offers the possibility of managing water resources at least in the design process, because it allows spatial irrigation programming, defining specific areas of sheets, and irrigation times.
With the proposed methodology was validated that the degree of spatial dependence of the accumulated infiltration, for each evaluated phase, is directly related to the time of the infiltration test, maintaining an incremental trend, which means that the spatial dependence is more evident to the extent that the soil pores are in a condition close to saturation, allowing adjustment of irrigation programming times by sectors, according to the simulation of the irrigation programming.
The proposed data processing strategy has the option of being replicated in parallel to show changes in soil properties, although it should be noted that the sampling spacings change significantly depending on the variable to be analyzed. The present methodology it could be integrated with irrigation programming at least to design process.

