Services on Demand
Journal
Article
 English (pdf)
 Article in xml format
 Article references
 Send this article by e-mail
Indicators
-
 Cited by SciELO
 -
 Access statistics
Related links
-
 Cited by Google
 -
 Similars in
SciELO
Similars in
SciELO -
 Similars in Google
Share

 Permalink
Colombian Applied Linguistics Journal
Print version ISSN 0123-4641
Colomb. Appl. Linguist. J. vol.15 no.1 Bogotá Jan./June 2013
Establishing placement test fit and performance: Serving local needs*
Establecimiento de ajuste y desempeño en exámenes de clasificaciín de acuerdo con necesidades locales
Gerriet Janssens**,
Valerie Meier***
Department of Second Language Studies
University of Hawai'i, Mãnoa
E-mail: gjanssen@hawaii.edu,
meierv@hawaii.edu
*This article reports findings of the research Project titled: Establishing test fit and test performance: One internally-motivated case study from Colombia carried out at University of Hawai'i, Mãnoa; and Universidad de los Andes–Colombia between January and May 2012.
**Gerriet Janssens, After completing his MA in Applied Linguistics and TESL (UCLA, 2005), he worked for six years at Universidad de los Andes, which strongly supported his growing interest in curriculum development. Currently, he is a PhD candidate at University of Hawai'i, Mãnoa's Department of Second Language Studies, where he is pursuing his research interests in exam and program validity, language test development, corpus linguistics, and quantitative research methodologies. He intends to return to Colombia and Los Andes in order to finish his dissertation research and teach.
***Valerie Meier, After completing an MA in Composition (SFSU, 2003) she taught a variety of academic writing and reading classes at US universities and business English in Asia. She has just finished an MA program in Second Language Studies (2013) at the University of Hawaii, Manoa, where she further developed her interests in academic literacies, EAP program development and evaluation, computermediated communication, and language assessment.
Received: 31-Oct-2012 / Accepted: 4-June-2013
Abstract
Accountability in language education is often associated with top-down national policies unresponsive-or even hostile to-local needs; however, when accountability is driven by local stakeholders seeking to better understand and enhance their programs, it can foster productive cycles of action research and curriculum development. This paper reports on one such internally-motivated accountability effort, in which program insiders sought to determine the efficacy of a reading test being administered to a new population of students at one Colombian university. Descriptive statistics, reliability estimates, and item facility and discrimination measures were used to determine whether this test was sufficiently reliable and appropriately matched to test takers' ability in order to warrant its use as part of a high-stakes English-language placement exam. A detailed analysis of this test is used not only to propose specific recommendations for revision but also to illustrate a useful set of statistical tools appropriate for test analysis in other language programs. Moreover, we conclude that the involvement of local instructors as part of an iterative, self-reflective, test development process provides opportunities for professional development and deeper engagement in accountability projects.
Key words: Language programs, tests analysis.
Resumen
Frecuentemente se asocia el concepto de accountability en la enseñanza de lenguas con políticas de estado impositivas que pueden ser indiferentes ante (o ser hostiles a) las necesidades de la comunidad académica local. Sin embargo, cuando los proyectos de accountability son impulsados por la misma comunidad académica-buscando dentro sus programas curriculares un mejor conocimiento de si mismos-estos proyectos pueden fomentar ciclos productivos de investigación-acción y de desarrollo curricular. Este ensayo presenta parte de los resultados de una investigación en accountability motivada internamente dentro de un programa de lenguas en una universidad colombiana; como parte de ésta, los involucrados locales querían determinar en qué medida la prueba de lectura establecida por la universidad era apropiada para una nueva población de estudiantes. Se calcularon las estadísticas descriptivas, estimaciones de confiabilidad y medidas de item facility y item discrimination para determinar si el examen fue lo suficientemente confiable y si se adecuaba bien a las habilidades de los estudiantes para justificar el uso de este examen como parte de una prueba de clasificación de alto impacto. Se usó un análisis detallado de este examen para sugerir revisiones específicas y para ilustrar el uso de un grupo de herramientas estadísticas para el análisis de exámenes que pueden ser usadas dentro de otros programas de lenguas. Concluimos que la participación de los profesores locales dentro de un proceso de desarrollo cíclico y auto-reflexivo les da oportunidades para su desarrollo profesional y un nivel de compromiso más profundo durante proyectos de accountability.
Palabras clave: Programas de lenguas, análisis de exámenes.
Résumé
La notion de responsabilité (accountability, en anglais dans l'original) dans l'enseignement de langues est souvent associée à des politiques d'État imposées, qui peuvent être indifférentes (voire hostiles) aux besoins de la communauté académique locale. Néanmoins, lorsque les projets de responsabilité sont entrepris par la communauté académique elle-même –en quête d'une meilleur connaissance de leurs plans d'études- ces projets peuvent nourrir des cycles productifs de recherche-action y de développement des programmes d'études. Cet essai présent une partie des résultats d'une recherche sur la responsabilité, motivée au sein d'un programme de langues d'une université colombienne; dans le cadre de celle-ci, les intervenants locaux voulaient déterminer jusqu'à quel point l'épreuve de lecture établie par l'université était adaptée pour une population nouvelle d'étudiants. Les statistiques descriptives, les estimations de fiabilité et les mesurages des points facility et discrimination ont été calculés pour déterminer si l'épreuve a été assez fiable et si elle était adaptée aux compétences des étudiants en vue de justifier l'application de cette épreuve dans le cadre d'une épreuve de classement à fort impact. Une analyse détaillée de cette épreuve a été utilisée pour suggérer des révisions spécifiques et pour illustrer l'usage d'un groupe d'outils statistiques qui peuvent être utilisées dans d'autres programmes de langues. Notre conclusion en est que la participation des enseignants locaux dans un processus de développement cyclique et de réflexion sur eux-mêmes, leur donne des chances pour leur développement professionnel et un niveau d'engagement plus profond au cours des projets de responsabilité.
Mots clés: Programmes langues, l'analyse de test.
Resumo
Frequentemente se associa o concepto de accountability no ensino de línguas com políticas de estado impositivas que podem ser indiferentes ante (ou ser hostis a) às necessidades da comunidade acadêmica local. Entretanto, quando os projetos de accountability sã impulsionados pela mesma comunidade acadêmica-buscando entre seus programas curriculares um melhor conhecimento de si mesmos- estes projetos podem fomentar ciclos produtivos de pesquisa-ação e de desenvolvimento curricular. Este ensaio apresenta parte dos resultados de uma pesquisa em accountability motivada internamente dentro de um programa de línguas em uma universidade colombiana; como parte desta, os envolvidos locais queriam determinar em que medida a prova de leitura estabelecida pela universidade era apropriada para uma nova população de estudantes. Calcularam-se as estatísticas descritivas, estimações de confiabilidade e medidas de item facility e item discrimination para determinar se o exame foi o suficientemente confiável e se se adequava bem às habilidades dos estudantes para justificar o uso deste exame como parte de uma prova de classificação de alto impacto. Usou-se uma análise detalhada deste exame para sugerir revisões específicas e para ilustrar o uso de um grupo de ferramentas estatísticas para a análise de exames que podem ser usadas dentro de outros programas de línguas. Concluímos que a participação dos professores locais dentro de um processo de desenvolvimento cíclico e auto-reflexivo lhes dá oportunidades para seu desenvolvimento profissional e um nível de compromisso mais profundo durante projetos de accountability.
Palavras chave: Programas de línguas, análise de teste.
Introduction
It is a little disputed fact that language educators currently live in an era of accountability. This has been clearly evidenced in European countries in the creation and use of standardized language performance scales such as the Common European Framework of Reference as a measurement of language proficiency; in the United States, accountability measures such as No Child Left Behind (Bush, 2002) have encouraged schools to produce the "right" type of test scores, with schools otherwise facing punitive consequences such as the firing of teachers and administrators or the loss of funding. This is a very serious situation, especially so in areas where low levels of local taxation alreadychronically underfund public schooling.
Accountability is also important in the case of Colombia, where accountability ventures have entered into the educational sphere with the Programa Nacional de Bilingüismo 2004-2019.1Many have discussed this situation and the results these laws (will) have for education within the Colombian context, with most of the conversation centering on critiques of this educational program. Very early on, Clavijo (2004) worried that bilingual curricular planning in the city of Bogotá was not only unplanned, but that it privileged Spanish-English bilingualism at the expense of the other languages spoken in Colombia. Cárdenas (2006) and Truscott de Mejía (2006) contributed to this developing conversation, noting that despite whatever good intentions that the government policy would not treat all Colombian languages equitably. Somewhat later on, González (2008) described how Colombia Bilingüe focuses predominantly on English and that the policy is divorced from realities, especially within the public sector. Usme (2009) extended these arguments described above to level a strong critique against Colombia Bilingüe: Usme wrote how Colombia Bilingüe is not equitable, privileging upper-middle and upper-class students and how it promotes a questionable trans-national agenda instead of one that is based on locally-relevant needs. Lípez and Janssen (2010) shift the focus of critique and analyze the ECAES test, a measurement instrument used by this educational policy. They report many many areas where this exam failed, especially how many language items on the test required skills other than language skills to complete the test items. Quite recently, Truscott de Mejía, Lípez Mendoza, and Peña Dix (2011) followed up on an earlier project by Truscott de Mejía, Ordíñez, and Fonseca (2006) and presented us with an edited volume, whose first section presents a comprehensive reporting of the ways in which Colombia Bilingüe is (and is not) being developed within different public and private schools in the Bogotá area. All in all, it is evident from these articles and many more like them in the field that imposed, top- down accountability efforts do not have good traction in the Colombian context.
Though issues related to down-top accountability in the public sphere have been thoughtfully discussed and cri ti q ued -and with very good reason-accountability for locally-contextualized and locally- driven ends can be much more empowering and productive. One can argue that accountability in a bottom-up context may foster action research cycles and other improvement-oriented philosophies when language teaching: accountability goals (i.e., having a good class or program) can drive cycles of planning, observation, and reflection (e.g., Kemmis & McTaggart, 1988). These self-driven, accountability- oriented action-research cycles can be very fruitful when developed within a systems approach to curriculum development, another iterative process of continued needs analyses, objective defining, testing, materials development and teaching, all supported by evaluation procedures (cf. Brown 1995; Dick, Carey,& Carey, 2000).
This paper presents results from one internally- motivated accountability project. At its core was the goal of understanding a locally used test with greater precision, as the testing context had recently changed: at this school, an established language placement test had been used for many years for undergraduate English program placement; this test was now being included in a new test battery with different, PhD-level students. As "tests are, or should be, situation-specific, [which] is to say, a test can be very effective in one situation with one particular group of students and be virtually useless in another" (Brown, 2005, p. 30), this school wanted to ensure that this new use of its established test was warranted. Thus, this investigation asked the following questions:
- What can we notice about the established, local placement test in its new use and context using descriptive statistics, reliability measures, and item facility and discrimination values?
- What recommendations for next steps can be made for this particular placement test, in this particular testing context?
- Wh at recommen dation s can b e generally made concerning the value of locally-driven accountability based projects?
Review of the Literature: Statistical Tools for Measurement
Descriptive statistics for testing
There are a variety of statistical measures that can be used to study the performance of tests. Some of the most important are the basic descriptive statistics, (e.g., mean, median, standard deviation). These descriptive statistics are very important in their own right, as just like their name suggests, they depict whether the data set is normally distributed or not-- that is, whether it produces a bell-shaped distribution. Normal distributions are considered to be the ideal way in which a generic population will respond to a norm-referenced test such as a proficiency or placement test, and there are important properties of this normal curve that are used throughout much of the field of statistics.2
The first group of descriptive statistics typically studied are statistics of central tendency (e.g., mean or average; median, or middle score in a descending- order list of scores; mode, or most frequent score), which explain "the typical or most representative characteristics of a set of scores" (Hudson, in press, p.4-7). In the world of real data, where score distributions are usually not perfectly normally distributed (i.e., again, the ideal bell curve distribution), understanding these different measures and the degree to which they are close or far away from each other helps to indicate the degree to which the data set is normally or non-normally distributed. If the mean, median, and modes of a data set are the same, then one can predict that the distribution will be perfectly normal.3As a counterexample, seeing that the median (or middle score) of a data set is quite a bit higher than the mean (or average score) helps document that this data set has a few data points that are extremely low, which has had the effect of lowering the average.
When considering placement test performance- tests designed to separate differently proficient test- takers into different groups-classical testing theory establishes that the mean score on the test should be at or near 50% (Brown, 1995).4 If the mean and median scores are centered at or near 50%, the test is considered to fit the population well, as these scores a placement test doesn't fit the population it is used with: for example, if a median score on a placement exam is 10% on a 100-point scale. This would indicate that approximately half of the test-takers scored at or below the 10% mark, compressed into the small range of 10 percentage points, while the other half were distributed over 90 percentage points. This skewness (non-centeredness of the data distribution) is very important to detect, as indicates that scores on a placement test are not evenly distributed: when tests are negatively skewed, the majority of scores bunch up towards the high end of the scoring scale, and when tests are positively skewed, they bunch up towards the low end.5 In this example,6the test is positively skewed and one can imagine how, within a narrowly constricted 10 percentage point range, it would be much more difficult to distinguish different levels of ability within the lower half of the test-takers than it would be to do so for the upper half of the group. Accordingly, when reviewing placement exam performance, having mean and median scores at or near 50% is widely considered desirable so as to maximize possibility of a normal distribution.
The other group of descriptive statistics studied in placement exam development are those of dispersion (e.g., min or minimum score; max or maximum score; range or difference between min and max; and standard deviation or how much scores on average deviate from the mean). In conjunction with mean and median values, descriptive statistics of dispersion can help us sense the normal or non- indicate that there is an equal range (50 percentage points) for the more proficient test-takers to distinguish themselves from each other as there is for less- proficient test-takers to distinguish themselves from each other. However, consider what happens when nature of the data set. These measures all help depict how widely and evenly test scores are distributed. For instance, if a 100-point test has a mean score of 50 and a range of 20, with a min score of 40 and a max score of 60, one can predict that the distribution will be symmetrical, as it seems to be evenly centered around the mean-the first step towards establishing a normal distribution.7
However, min, max, and range also have a second predictive power: they are able to show the distribution's kurtosis or distribution density: whether the distribution is highly concentrated with a sharp central peak-leptokurtotic-such as the example in the prior paragraph or very weakly concentrated with a small, flattish central mound-platykurtotic. When examining a placement test for its functionality, extreme forms of kurtosis (i.e., leptokurtosis and platykurtosis) are thought to demonstrate that a placement exam is not distributing scores well. If a distribution is leptokurtotic the test does not seem to be widely and clearly separating test takers. This is an indication that test takers are quite close in ability to each other and that there is a problem with the test's difficulty at the higher and lower ability levels (i.e., they are respectively too difficult and too easy). On the other hand, if a distribution is highly platykurtotic, then this might indicate that there may be too few data points in the data set, forming a diluted distribution with a smallish center, or that the match between the population and the test be reconsidered.
While min, max, and range are useful in beginning to depict the distribution of a data set, standard deviation-"the average amount that the scores vary from the mean" (Hudson, in press, p. 4-9)-is the most useful measure when discussing score distributions. While knowing the min, max, and range-and then comparing these to the mean-can reveal a distribution's skewness and kurtosis, similarly, knowing only the standard deviation and the mean can also help predict the shape of a distribution.
By knowing how much scores vary from the mean on average, we can evaluate the degree to which a distribution is normal or whether it is skewed or not. A normally-distributed test whose mean is centered at 50% will have sufficient "room" for approximately three standard deviations on either side of the mean; this range of plus or minus three standard deviations accounts for 99.72% of the scores in a normal distribution. A distribution which does not have room for three standard deviations above the mean is negatively skewed, whereas a distribution which does not have room for three standards deviations below the mean is positively skewed. Furthermore, standard deviation is a tool for identifying the outlying scores within the data set: scores at a distance of more than three standard deviations from the mean are considered to be outliers as they are outside of the margin of 99.72% of the data points.
Reliability, Item Facility, and Item Discrimination
Cronbach's alpha is a statistical indicator of a data set's consistency. It is a way of gauging "how stable ... the position of a given score [is] in a distribution of scores when measured at different times are in different ways" (Tabachnick & Fidell, 2013, p. 11), or the degree to which a test-taker would score the same when taking the exam a second time. This indicator is measured between 0.0 and 1.0; the closer the measure approaches 1.0, the more internally consistent the data set is considered to be. Exams for high-stakes purposes (e.g., classification exams that are used for entrance into university programs) are generally recommended to have reliabilities above .93.
While reliability is paramount to ensuring that measurements are consistent, there are nevertheless several caveats to keep in mind concerning reliability. First, an exam's global reliability might be somewhat lower than the reliability of each of the exam's subsections. This is possible since an exam subsection will typically develop one construct closely, while the global test will be comprised of several of these constructs. Intuitively, more variation could arise across different constructs than within one construct. Secondly, test instruments with a large number of items may have a high reliability due to the sheer number of items. Thus, the other indices of exam fit and functioning (i.e., item facility and item discrimination values) are critical to consider. Most importantly, reliability should not be conflated with validity: "a test can be reliable without being valid. In other words, a test can consistently measure something other than that for which it was designed" (Brown, 2005, p. 220).
Item facility (IF) values are an important indicator that addresses the fit between the test items and the test taker sample. This calculation considers each test- item individually and asks the question "to what degree is this test item appropriately easy or difficult for the sample population?" IF values are very easy to derive: they are simply the percent of people that answered any test item correct, expressed as a decimal (e.g., .90 or .35). Brown (2005) recommends for placement exams that test items be between 0.30 (difficult; only 30% of the test-takers correctly answer the item) and 0.70 (easy; 70% of the test-takers correctly answer the item). Having large numbers of items that are much beyond these suggested IF value margins will create a test that does not "fit" the test population, and as a consequence, will not serve to help distribute the test takers into groups of different abilities-the purpose of a placement exam. Having a few items beyond this range is possible, to provide some easy questions for more novice test-takers and some challenges for more proficient test-takers.
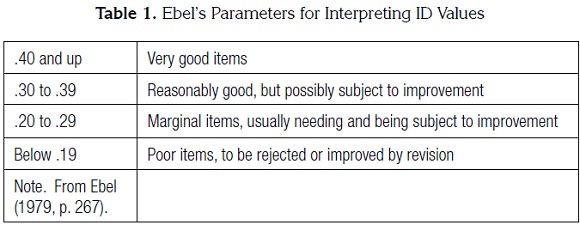
Item discrimination (ID) is a second calculation that is very useful when evaluating the fit between exam items and a local test-taker sample. ID values reflect the degree to which each test item functions to separate a more proficient test-taker from one that is less-proficient. Measurement scholars Ebel and Frisbie state that:
"the job of a test item is to discriminate between those who have and those who don't have some element of knowledge.... Those who have achieved command should be able to answer the question correctly without difficulty. Those who lack it should find a wrong answer attractive. To produce items that will discriminate in this way is one of the aims of item writing." (1991, p. 149)
ID values are calculated by subtracting the IF value calculated for the lower third of the sample for the test item from the IF value for the upper third of the test takers: ID = IF – IF (Brown, 2005, p. 69). The following table presents Ebel's suggested parameters for interpreting ID values.
Together, these three calculations-in addition to basic descriptive statistics- provide a quantitative depiction of the degree to which test items and the test as a whole reliably function and fit the test taker population. These analyses can and should be supplemented by a review of the exam's content validity by field experts, usually the instructors who will be working with the test-takers placed by this exam, though this is not the focus of the present paper. In this way, validity concerns about the exam's fit with program content are sure to be addressed.
Methodology
Participants
Test takers (n = 128) presented the May 5th, 2012 administration of this reading exam. Earlier student populations that had taken this exam had been undergraduate students, who took the exam for English class placement or exemption at one Colombian university. This sample, though a convenience sample of available, dichotomously scored data, was a group of PhD students from different programs around the university who are required to take English as part of their PhD studies; there is no noticeable difference in majors or global test scores or reading section scores between this group and the larger population. Accordingly, and because of this relatively large n-size, it is assumed that this sample group reflects the larger population of PhD applicants at this Colombian university.
Test instruments
The placement exam used for this doctoral student population consists of three subsections. The speaking and writing subsections are performance exams scored by raters using analytic rubrics; these subsections were analysed using a form of analysis better suited to tests involving rater judgements (i.e., Rasch analysis) and so are not considered in the present paper, which addresses the reading subsection.
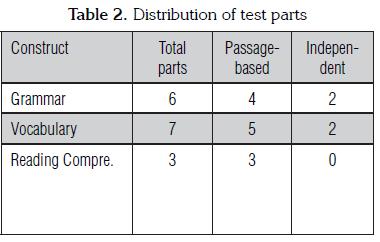
The reading portion of this placement exam is a 70-minute timed exam which consists of 78 multiple- choice questions and is administered on a computer. This section has been constructed to measure three different language constructs: grammar, vocabulary, and reading comprehension.8 The grammar and vocabulary parts of the reading exam consist either of questions based on reading passages or independent questions that are not passage-based. A summary of how these different test parts have been distributed can be found in the table below.
At this point, it is important to note that a comprehensive investigation of the test's suitability would also include a thorough review of its content validity in terms of the program the test is being used for. However, at this stage in the test review process, program stakeholders were primarily interested in ascertaining whether the test was still reliable and functioning efficiently as a placement test when used with the new test taker population (i.e., the Phd students), and so this is the focus of the present paper.
Analyse
Descriptive statistics (both statistics of centrality and statistics of dispersion) were calculated for the reading test using Excel (Microsoft Office, 2007). The curious reader should note that descriptive statistics can also be run through IBM's SPSS and on the free statistical program MYSTAT (SYSTAT Software, 2007). Reliability estimates (Cronbach's alpha) were calculated for the reading subsection as a whole and each of the subsection's language constructs using MYSTAT (SYSTAT Software, 2007). ID and IF values were calculated using Excel.
Results
Reliability
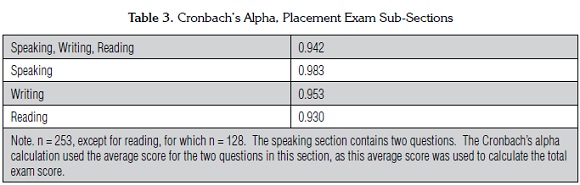
Reliability estimates for the placement exam as a whole and each test sub-section are presented in Table 3. Each of the Cronbach's alpha values are appropriate for a high-stakes testing situation; that is, all the values are .93 or higher. Although the values for the reading and writing subsections are slightly higher than the value for the exam as a whole, this can be explained by the relatively more narrow scope of each these subsections, which theoretically address one major construct and are measured in a similar way. In contrast, the placement exam consists of several distinct subsections targeting different constructs and/or using different testing approaches (e.g. performance tests for reading and writing versus multiple choice tests for reading); students might not perform equally well on each of these sections and the Cronbach's alpha for the exam as a whole will be lower. This does not indicate that the test as a whole is less reliable, only that test takers' scores across different constructs are not as consistent as they are within a given construct.
Table 4 provides additional information about the reading subsection and the reliability of the items that target the three main constructs tested in this exam: grammar, vocabulary, and reading comprehension. Unlike the results presented in Table 3, these values indicate that the reading subsection as a whole has a higher Cronbach's alpha than any of the three constructs. In this case, the component constructs and the way in which they are measured (as multiple choice items) are similar enough so that students' performance across all three areas is consistent and does not noticeably affect the global reliability score. Therefore, the number of items seems to be the more important factor: the larger number of items used to calculate the reliability of the reading subsection as a whole is likely leading to a higher reliability estimate, whereas the smaller number of items used to calculate the reliability of each construct is producing lower reliability estimates.
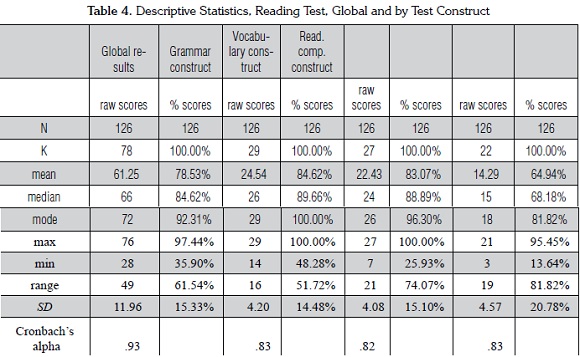
Measures of central tendency. Table 4 contains the most important measures of central tendency, including the mean, median, and mode. Even without more elaborate analyses, examining the means yields important insights into how the reading subsection is functioning. The means for the entire reading subsection and the individual constructs are all above the ideal mean of 50%, suggesting that the test is negatively skewed and so the more proficient test takers in particular (those with scores above the mean) are not being spread out enough to enable test administrators to make fine distinctions between them (Brown, 2005). There is, however, a notable twenty point difference between grammar, the easiest section (84.62%), and reading comprehension, the most difficult one (64.94%). This gives us a rough idea that those items targeting reading comprehension generally fit the population better than items targeting the other constructs and provides initial direction for test revision.
The values for the median and the mode confirm that the distribution of scores is negatively skewed. In fact, the median values indicate that the means actually underestimate how easy the test is: they show that half of the test takers earned scores above 89% on items targeting grammar and above 88% on items targeting vocabulary. Put another way, the items targeting grammar and vocabulary only provide 10-12 point range with which to distinguish the proficiency levels of half of the test takers, a range which is too narrow to allow for fine-grained distinctions. Conversely, if the test is revised so that the mean and median scores are closer to 50%, the scores of test takers with higher proficiency levels will be spread out over a much larger range and it will be easier to differentiate between different levels of proficiency.
Measures of dispersion. Table 4 also contains the main statistics of dispersion, including min (minimum), max (maximum), range, and standard deviation, which help reinforce the conclusions reached by examining the measures of central tendency. The min, max, and range values provide information about how widely scores are spread and the degree to which they are centered around the traditional placement test mean of 50%. For a normally distributed test based on 100 percentage points we would expect a min score close to zero and max values close to100, which would indicate that the test is measuring the full range of test takers ability, from the least to the most proficient. Table 4 shows that while the max values for all three constructs are close to 100, for the grammar construct in particular, the min value is quite far from zero; in fact, it is close to 50. In other words, the very least proficient test takers are earning scores that, on a normally distributed test, would belong to the test takers with average proficiency. High min values also have implications for the range values, which are simply a measure of the distance between the min and max scores. While the range values for all three constructs are less than the theoretically possible 100 points, the range for grammar (51.72) is markedly constricted.
Standard deviation values presented in Table 4 confirm the conclusions we have reached for far. Both the grammar and vocabulary language constructs have standard deviations of approximately 15% and means of approximately 84%, which indicates that there is only room for about one standard deviations above the mean and five standard deviations below. The reading comprehension construct more closely approximates the normal distribution, with room for almost two standard deviations above the mean and slightly more than three below. A quick glance at a normal distribution curve shows that three standard deviations represents a wide range of ability, as it takes increasingly greater proficiency to move away from the mean. However, because the items targeting grammar and vocabulary only allow for one standard deviation above the mean, test takers at the highest proficiency levels-those whose ability is two or three standard deviations above the mean-do not have the opportunity to distinguish themselves.
Again, these values indicate that the distribution of scores is negatively skewed, reflecting a mismatch between the proficiency of the population and the difficulty of the test, but that in general items targeting reading comprehension are a better fit than the items targeting the other two constructs. In the next section we will demonstrate how items analysis can be used to pinpoint the specific items that are working well and those that are good candidates for revision.
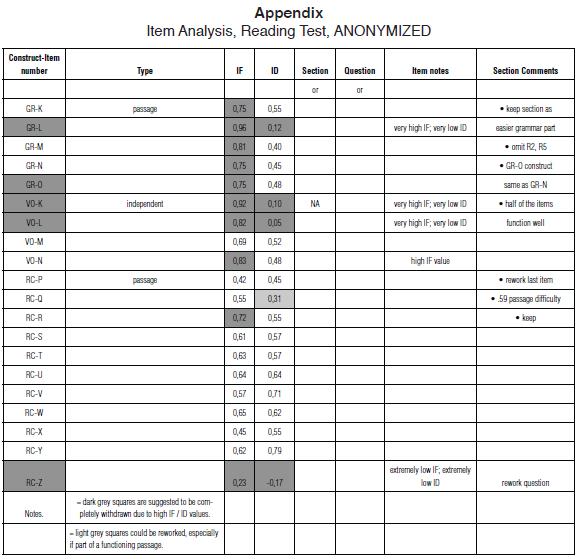
Item analyses. To conduct item analyses, we calculated item facility (IF) and item discrimination (ID) values for each of the 78 items on the reading subsection; the appendix includes a representative sample of these values.
Item facility (IF) is simply a ratio of the number of students who answered an item correctly to the total number of students taking the test; the higher the IF value, the easier the item. As mentioned previously, items with IF values between 0.30 and 0.70 are considered appropriate for a placement test because items that a majority of test takers get right or get wrong will not provide useful information about differences in proficiency levels (Brown, 2005). The appendix shows that only one item (RC-Z) has an IF value below the recommended parameter of .30, while all of the grammar items, three of the vocabulary items, and one of the reading comprehension items have IF values above the recommended parameter of 70. However, some of these items are only slightly easy for the population (e.g. RC-R) whereas others are quite easy (e.g. GR-L). In deciding on which specific items to revise, it is useful to consider both the extremity of the IF scores as well as the ID scores.
Item discrimination (ID) values reflect the degree to which a test item separates a more proficient test- taker from one that is less-proficient; the higher the ID value, the more effectively an item is distinguishing between test takers. As indicated in Table 4, ID values above .40 are considered "very good" and those below .19 are considered "poor." The appendix indicates that of the five grammar items with high IF values only one has an low ID value (item GR-L); the other four items all have ID values above .40. Thus although these four items are easy for this population, they are still providing useful information and could be retained as an easy warm-up. Item GR-L, on the other hand, needs to be substantially revised. Similarly, two of the three vocabulary items with high IF values also have very low ID values and should also be revised, as should the one reading comprehension item with low IF and ID values. Once problematic items are revised they can be piloted in future exam administrations and ID and IF values recalculated in order to ensure that they are neither too easy nor too difficult and that they distinguish between test takers. As more of the items conform to ideal IF and ID values, the test as a whole will better fit the proficiency level of the test taker population, the distribution of scores will more closely approximate a normal distribution, and test administrators will be better able to make more accurate placement decisions.
Discussion
Question 1. What can we notice about the established, local placement test in its new use and context using descriptive statistics, reliability measures, and item facility and discrimination values?
To begin, the placement test as a whole and each sub-section (reading, writing, and speaking) have a high reliability estimate; this is critically important as it is considered a high-stakes exam and results need to be consistent results across administrations.
Though the exam was found to be highly reliable-a significant and positive first step-it is also important to keep in mind Brown's (2005) caution that a test can be reliable without being valid. As a first step to establishing this exam's validity, we checked to see if the reading portion of the placement exam fits the new population of test takers. Descriptive statistics indicated that the distribution of scores on the reading subsection is negatively skewed and that this test in its new use is generally easy for the new test taker population. Because the test is quite easy for this new population test developers should consider creating more difficult items that would more strongly challenge the test takers so that scores are more widely distributed and the test will better separate the strongly proficient from the very strongly proficient, something that is not possible with the current test.
More specifically, item analysis demonstrated three trends in terms of item facility and item discrimination. First, it was determined that many sections of the test, such as reading comprehension questions RC P-Z, both fit the test taker population in terms of the difficulty (i.e., appropriate .30-.70 ranged IF values) and the power the items had to distinguish between more and less proficient test takers (i.e., ID values above .30). These values support the argument that this section and exam sections with results similar could be included with confidence in future versions of this exam.
Secondly, some sections, such as grammar items GR K-O, were comprised of items that had the ability to distinguish between more and less proficient test-takers, but seemed excessively easy for the test-taker population (i.e., IF values of .75 and higher). This perhaps comes as no surprise: it could be predicted that prospective PhD students may have had more contact with English grammar through extensive academic reading undertaken during their undergraduate and MA-level coursework, and so they may have a more developed English language proficiency than the first year undergraduate students for whom this test was originally designed. Nonetheless, test sections such as these could be retained, especially as part of an easier warm-up section of the exam, to balance out newly created, more difficult items, that will give the reading subsection an overall mean of approximately .50.
Finally, a few parts of this exam, such as vocabulary test items VO K and L, were found to be quite easy for this specific exam population (IF values above .80) while also not separating the proficient test takers from the less proficient test- takers (ID values of less than .10). As suggested by Ebel and Frisbie (1991), placement exam items that do not discriminate between proficient and less proficient should be revised. This result should not be considered disheartening, however, if one considers that exam development should be an iterative and on- going process which involves continued monitoring, piloting, revision, and improvement of items.
Question 2. What recommendations for next steps can be made for this particular test, in this particular testing context?
In light of the results presented in the previous section and the high mean (78%) and median (84%) scores for the reading section, it can be safely concluded that although the reading test is generally functioning adequately in terms of the ID values, it is quite easy given the proficiency level of the new test taker population. Accordingly, future test development should focus on the creation, piloting, and inclusion of items that target the same constructs but are increasingly difficult, so that the reading test can better spread out the test takers.
Question 3. What recommendations can be generally made concerning the value of locally-driven accountability projects?
The most important recommendation for any major test is to continue the test-development process. Tests should be evaluated not simply as a response to external pressure, but because the continuous monitoring and development of test items serves to ensure that local test administrators are aware of how well their assessment instruments fit their test-taker population and are functioning the way they are intended to. The primary purpose of a placement test is to spread students out according to proficiency level, and so test administrators should regularly check basic descriptive statistics and conduct item-level analyses in order to ensure the test is indeed doing this. Furthermore, by engaging in continuous test development, local stakeholders demonstrate for all interested parties that they are pro-actively participating in both the discussion about and research concerning accountability.
Iterative, self-reflective test development-akin to or using an action-research based theoretical framework-also serves to support agendas that promote both research and continuing education for local educators. It provides an opportunity for local instructors to participate in the review and development of testing materials, something which will lead to not only broader instructor knowledge about effective assessment practices but also greater familiarity with the local test items and how these intersect with locally held curriculum goals. Moreover, extending participation in program development to instructors helps foster ownership so that instructors feel a higher responsibility towards the program.
Notes
1The National Program for Bilingualism 2004–2019. This is commonly referred to as Colombia Bilingüe
2 This curve is an assumption of many univariate and multivariate analyses such as ANOVA and MANOVA, respectively.
3 Of course, the clever reader may construct a scenario where- in the mean, median, and mode all are at the same point, without having a normal distribution, but this situation is not frequent.
4 This, however, may not be the score you want to report to your public! Indeed, normed proficiency tests such as the TOEFL or the GRE will add a constant to their scoring, so that a person that scores 30% has a slightly more palatable experience receiving their score.
5 Not only does skewness (i.e., non-normality of the data set) in- dicate that the placement exam doesn't work, but it also indicates that inferential statistical calculations (e.g., t-tests, ANOVAs, MANOVAs) may be in jeopardy of not working because of their assumptions for data normality. As a result, data cleaning (see, for example Tabachnick and Fidell, 2013, Chapter 4) becomes critically important.
6 In this case, thoughtful test developer should consider the popula- tion and the placement test that is being administered to make sure there is an appropriate, localized fit. Is it the case that the place- ment test doesn't fit the sample population-that it is markedly more difficult than the test-takers' abilities (i.e., administering the TOEFL to elementary school students)? In this instance, neither the TOEFL or the elementary school students are at fault or are bad; there simply is not a good fit between the population and the test. Accordingly, test-developers would have the responsibility to create a placement test that matches and responds to the sample population's general ability normal.
7 Again, the clever reader is invited to demonstrate her knowledge by constructing a situation in which the data set maintains these parameters while not being normal.
8 Scholars such as Purpura (1996) have shown that reading compre- hension skills can be predicted by grammar knowledge.
References
Brown, J.D. (1995). The elements of language curriculum: A systematic approach. Boston, MA: Heinle ELT. [ Links ]
Brown, J.D. (2005). Testing in language programs: A comprehensive guide to English language assessment. New York: McGraw-Hill. [ Links ]
Bush, G.W. (2002).Public Law 107-110. An act to close the achievement gap with accountability, flexibility, and choice, so that no child is left behind. U.S. Congress. [ Links ]
Cárdenas, M. L. (2006). Bilingual Colombia: Are we ready for it? What is needed? Paper presented at 19th Annual EA Education Conference 2006. Retrieved from http://www.englishaustralia.com.au/ea_confe-rence2006/proceedings/pdf/Cardenas.pdf [ Links ]
Clavijo, A. (2004). Critical perspectives about bilingualism in the city of Bogota. Paper presented at primer simposio internacional sobre bilingüismo y educaciín bilingüe en Latinoamé rica (Bilinglatam). Buenos Aires: Argentina. Retrieved from http://www.essarp.org.ar/bilinglatam/ingles/clavijo-olarte.html [ Links ]
Dick, W., Carey, L., & Carey, J.O. (2000). The systematic design of instruction, 5th edition. Boston, MA: Pearson. [ Links ]
Ebel, R.L. (1979). Essentials of educational measurement, 1st edition. Upper Saddle River, NJ: Prentice Hall. [ Links ]
Ebel, R.L., & Frisbie, D.A. (1991). Essentials of educational measurement, 5th edition. Upper Saddle River, NJ: Prentice Hall. [ Links ]
González, A. (2008). Bilingüismo en Colombia perspec- tivas globales y locales. Ministerio de Educaciín Nacional, Colombia. Retrieved from: http://www.mineducacion.gov.co/observatorio/1722/arti-cle-170864.html [ Links ]
Hudson, T. (in press). Research design and analysis in Applied Linguistics draft manuscript, cited with authors permission). University of Hawaii: Hono-lulu, HI. [ Links ]
Kemmis, S., & McTaggart, R. (1988). The Action Research Planner (3rd Ed.). Geelong: Deakin University Press. [ Links ]
Lipez, A., Janssen, G. (2010). Validation study for Colombias ECAES exam. Revista Lenguaje, 38(2), 423 448. [ Links ]
Messick, S. (1995). Validity of psychological assessment: Validation of inferences from persons responses and performances as scientific inquiry into score meaning. American Psychologist, 50, 741 749. [ Links ]
Tabachnick, B., & Fidell, L. (2013). Using multivariate statistics, 6th edition. Boston, MA: Pearson. [ Links ]
Truscott de Mejía, A. (2006). Bilingual Education in Colombia: Towards a recognition of Languages, cultures and identities. Colombian Applied Linguistics Journal, 8, 152 168. [ Links ]
Truscott de Mejía, A. M., Ordíñez, C. L., & Fonseca, L. Universidad de los Andes, (2006). Estudio investigativo sobre el estado actual de la educaciín bilingüe (inglés-español) en Colombia. Retrieved from: http://cife.uniandes.edu.co/archivos/Linea-mientos_para_la_educacion_bilingue.pdf [ Links ]
Truscott de Mejía, A., Lípez Mendoza, A., & Peña Dix, B. (2011). Bilingüismo en el contexto colombiano: Iniciativas y perspectivas en el siglo XXI. Bogotá, Colombia: Ediciones Uniandes. [ Links ]
Usma, J. (2009). Globalization and language and education reform in Colombia: A critical outlook. Ikala, revista de lenguaje y cultura 14(20), 19-42. [ Links ]