


Services on Demand
Journal
Article
 English (pdf)
 Article in xml format
 Article references
 Send this article by e-mail
Indicators
-
 Cited by SciELO
 -
 Access statistics
Related links
-
 Cited by Google
 -
 Similars in
SciELO
Similars in
SciELO -
 Similars in Google
Share

 Permalink
Estudios Gerenciales
Print version ISSN 0123-5923
estud.gerenc. vol.22 no.101 Cali Oct./Dec. 2006
TENDER OFFERS IN SOUTH AMERICA: ARE ABNORMAL RETURNS REALLY HIGH?
DARCY FUENZALIDA1, SAMUEL MONGRUT2, MAURICIO NASH3, JUAN TAPIA4
1 Doctor en Ciencias Empresariales de la Universidad de Lleida, España. Magíster en Economía de la Universidad Católica de Chile e Ingeniero Civil Químico de la Universidad Federico Santa María, Chile. Profesor del Departamento de Industrias de la Universidad Federico Santa María, Valparaíso, Chile. darcy.fuenzalida@usm.cl
2 Doctor en Ciencias Económicas y Empresariales, Universidad de Barcelona, España. Magíster en Economía, Universidad de Maastricht, Holanda. Licenciado en Administració de Empresas, Universidad del Pacífico, Perú. Profesor de Finanzas de EGADE Tecnológico de Monterrey, México. mongrut_sa@up.edu.pe
3 MBA, Magíster en Gestión Empresarial, Ingeniero en Control de Gestión y Contador Auditor. Se desempeña como funcionario en el Banco Santander Santiago, Chile. mauricio.nash@usm.cl
4 Ingeniero Comercial de la Universidad Federico Santa María de Chile. Profesor e investigador en el Departamento de Industrias de la Universidad Federico Santa María, Valparaíso, Chile. juan.tapia@usm.cl
Fecha de recepción: 6-3-2006 Fecha de aceptación 28-8-2006
ABSTRACT
Different studies in developed capital markets have found positive abnormal returns of at least 15% during the announcement date of a tender offer. Although there are almost no studies for South American stock markets, some studies reported positive abnormal returns, ranging from 25% to 50%, related to the announcement of the first tender offer. In this study one argues that estimated positive abnormal returns in emerging markets are high because studies have assumed a completely segmented capital market by applying the market model with a local stock market index. By allowing for partial integration among five South American emerging markets, one shows that there are in fact positive abnormal returns previously, during, and after the announcement date of the first tender offer. However, the positive abnormal return associated to the announcement date is in the order of 8%. A slightly higher abnormal return is obtained using a market model that accounts for partial integration and downside risk. These results prompt towards a lower positive abnormal return in the sample of South American firms studied.
KEY WORDS
Tender offer, abnormal return, emerging market.
JEL code: C12, C32 and G34
RESUMEN
Diferentes estudios realizados en mercados de capital desarrollados han revelado tasas de retorno positivas inusuales de por lo menos 15% durante la fecha de anuncio de la oferta pública de adquisición de acciones. Aunque casi no se han llevado a cabo estudios sobre los mercados bursátiles en Sudamérica, algunos estudios han reportado tasas de retorno positivas inusuales en un rango del 25% al 50%, las cuales están relacionadas con el anuncio de la primera oferta de adquisición. En el presente estudio, se argumenta que las tasas de retorno positivas inusuales estimadas en los mercados emergentes son altas porque los estudios se han basado en un mercado de capitales totalmente segmentado aplicando el modelo de mercado y utilizando un índice del mercado bursátil local. Al considerar la integración parcial entre los cinco mercados emergentes en Sudamérica, se demuestra que efectivamente existen tasas de retorno positivas inusuales antes, durante y después de la fecha de anuncio de la primera oferta de adquisición. Sin embargo, el retorno positivo inusual asociado a la fecha del anuncio se encuentra en el orden del 8%. Utilizando un modelo de mercado que considere la integración parcial y el riesgo a la baja, se obtiene una tasa de retorno inusual ligeramente mayor. Estos resultados señalan una menor tasa de retorno positiva inusual en la muestra de las empresas sudamericanas incluidas en el estudio.
PALABRAS CLAVE
Oferta de adquisición, retorno inusual, mercado emergente
1. INTRODUCTION
There have been numerous studies in the field of tender offers and on the necessary premia to get corporate control in the process of takeover in developed capital markets, but almost none for South American stock markets. International evidence, mainly in the United States, shows that there are high positive abnormal returns for the target company at the moment of announcing the tender offer.
The objective of this study is to show that positive abnormal returns related to the first tender offer are in fact lower than previous estimates if one allows capital markets to be partially integrated instead of completely segmented. Recently, Stulz (1999), and Bekaert and Harvey (2003) have shown that after financial liberalization in emerging markets, their expected returns must fall because their relative volatility with respect to the world volatility must be higher than their correlations with the world market returns. Stulz (1999) has shown that this is the necessary and sufficient condition for globalization to reduce to reduce the risk premium of an small country (in this case an emerging market). This is the case even when emerging markets are more sensitive to world events due to their financial liberalizations.1 To the extent that local and world events play a meaningful role in explaining stock returns in emerging markets there will be less variation to explain and therefore abnormal returns must be lower than otherwise.
In this research, one shows that accounting for partial integration among five South American stock markets yields positive abnormal returns, which are lower than the ones estimated by previous studies. In order to show this, one uses 17 tender offers that have been accomplished during the period 1998-2002 across five South American stock markets (Argentina, Brazil, Chile, Peru and Venezuela). In particular, one is interested in answering the following research questions: Do target South American firms offer positive abnormal returns around the announcement date of their first tender offer in a situation of partial integration? Does one find evidence of information leakage during the days previous to the announcement date of the first tender offer? Is there evidence of stock market overreaction?2
In particular, an hybrid multifactor Capital Asset Pricing Model (CAPM) is used as a market model. This is in fact just one way to represent a situation of partial integration. As pointed by Bodnar et al. (2003), a situation of partial integration is very difficult to represent because in this situation every investor has access to an incomplete but well-defined list of stocks. In order to specify this situation one needs information about all individuals and available securities for them. Hence, it may be possible that a situation of partial integration does not correspond to the hybrid multifactor CAPM. However, since the hybrid multifactor CAPM is a strange mix of the full-integration and the full-segmentation CAPM, it may be taken as a first approximation to a situation of partial integration.
The paper has been divided into six sections. The next section discusses the existing empirical evidence concerning tender offers, while the third section reviews the main aspects related to event studies. The sample criteria and data description appears in the fourth section, while the methodology and results are discussed in the fifth section. The last section concludes the paper.
2. TENDER OFFERS: EMPIRICAL EVIDENCE
A takeover refers to transfer of control of a firm from one group of shareholders to another group of shareholders. The controlling shareholders of the bidder company wish to acquire the company to the controlling shareholders of a target company. This change in the controlling interest of a corporation can be accomplished either through a friendly acquisition or an unfriendly, hostile, bid. A hostile takeover (with the aim of replacing current existing management) is usually attempted through a public tender offer (Harvey and Mongerson, 2006).
A tender offer is a general offer made publicly and directly to a firm's shareholders to buy their stock at a price well above the current value market price (Harvey and Mongerson, 2006).
The empirical evidence concerning tender offers is vast, so this section summarizes the most relevant studies for the purposes of this research.
Dodd and Ruback conducted one of the earliest studies concerning tender offers in (1977). These authors studied 172 companies traded at the New York Stock Exchange (NYSE) covering the period between 1958 and 1976. The objective of their study was to analyze the premium obtained by target companies on the announcement date of a tender offer and whether this premium was different for successful and unsuccessful bids. Using the market model, these authors found that abnormal returns of target companies acquired via successful bids was about 21%, while it was 19% for the case of unsuccessful bids. Later on, Jensen and Ruback (1983) conducted several studies between 1977 and 1983 and concluded that takeover in their sample have offered positive abnormal returns ranging between 16% and 30%.
Through the years several authors have found similar results for the NYSE and the NASDAQ. In this sense, Bredley et al. (1983) reported a premium ranging between 23% and 60% for target companies at the NYSE. Jarrel et al. (1988) studied 663 cases of successful tender offers between 1962 and 1985 and came to the conclusion that positive abnormal returns for target companies averaged 30%. Furthermore, Asquith (1988) found a positive abnormal return of 19% on NASDAQ target companies 10 days prior to a tender offer announcement, result that prompts to information leakage.
Zingales (2000) studied the magnitude of the average premium paid for voting shares in countries where such information is available. Such average premium varies enormously from country to country. In most of them it ranges between 10% and 25%, with Israel (45%) and Italy (82%) as the main exceptions. This variation can be explained by the characteristics of each country, with a probable effect on the ability to derive private gains from company control. Zingales concludes that as both local legislation and supervision improve, the premia on controlling stock will tend to be lower. Another interesting result was obtained by Moloney (2002) who found that, on average, the bidder company rewards the target company between 15% and 50% over the market price of the target company prior to the announcement of the tender offer. He concluded that there is a high positive abnormal return in the case of hostile bids and that there is a low positive abnormal return when ownership is highly concentrated and absorbed.
Although there are almost no studies for South American emerging markets, an interesting piece of evidence was offered by Fuenzalida and Nash (2003) whom studied 14 Chilean companies during the years 1995 and 2002. They conclude that there is evidence of positive abnormal returns on the announcement date of a tender offer of about 26%. Besides, these positive abnormal returns are lower in the case of public companies operating under the Tender Offer Law in Chile.3
3. ISSUES IN EVENT STUDIES
In conducting event studies there are several issues that one needs to account for. In this section, one reviews the main stages of the procedure. Five issues are discussed: event definition, selection criteria, estimation of abnormal returns, estimation of model parameters and tests for detecting abnormal returns. The following subsections will discuss each one in turn.
3.1 Event definition
The best results with an event study are obtained when the exact date of the event is identified. In order to do this it is crucial to identify the event subject at hand: e.g. the announcement date of a merger, an acquisition, an earnings announcement, a change in the debt rating, the adoption of an ISO standard, etc. Then, the estimation and event windows must be determined (See Figure 1).4
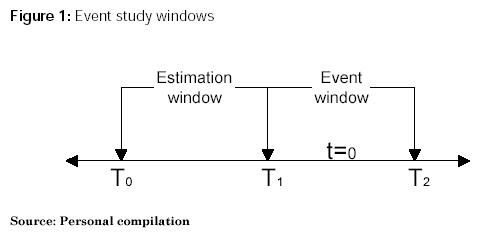
Using the same notation as Campbell et al. (1997), one defines t=0 as the event date when the announcement occurs, the interval [T1+1, T2] is the event window with length L2=T2-T1-1, while the interval [T0+1, T1] is the estimation window with length L1=T1-T0-1. When the study is being conducted with daily data, the estimation window usually is between 100 and 300 trading days (Peterson 1989).
The length of the event window usually depends on the ability to date precisely the announcement date. If one is able to date it with precision, the event window will be short and the tests to detect abnormal returns will be more powerful. Nevertheless, the length of the event window normally ranges between 21 and 121 days (Peterson 1989). Note that the event window includes the event announcement day, which occurs at t=0.
3.2 Selection criteria
This step is certainly a very important one since it is easy to introduce a selection bias in the definition of the sample of firms to be studied. In emerging markets the main tradeoff that one must make is between having quantitatively more firms in the sample, but with several firms subject to thin trading or having less number of firms, but actively traded. In the first case, one needs to use a procedure to test for abnormal returns in the presence of thin trading, while in the second case one has to avoid as much as possible any selection bias in the sample.
This tradeoff is due to the low number of actively traded or liquid stocks in emerging markets. For example, the percentage of actively traded stocks, as a fraction of the total number of traded stocks per year was between 5% and 19% at the Lima Stock Exchange (LSE) during the period 1991-2002 (Mongrut 2006).
Thin trading or non-synchronous trading means that whenever a market shock occurs, it will not be incorporated immediately into the price of a thin traded stock because it is not being traded. If one does not consider the effect of thin trading, there will be a serious bias in the moments and comoments of asset returns (for example, the beta parameters of thin traded stocks will be lower than the beta parameters of actively traded stocks). The reason for this is that time series of stock prices are taken to be recorded at time intervals of one length when in fact they are recorded at other irregular time intervals (Campbell et al., 1997).
Different ways to deal with the problem of thin trading have been suggested by Scholes and Williams (1977), Dimson (1979), and Cohen et al. (1983) in the context of market risk estimation. Each one of them tried to give an estimation of the market risk parameter (beta) in the presence of thin trading. However, as reported by Brown and Warner (1985), there is little to gain by using the procedures of Scholes and Williams (1977), and Dimson (1979) in testing abnormal returns.
What happens if one only includes few firms actively traded in the sample? A small number of firms will not represent a problem because parametric tests statistics used to detect abnormal returns converge to their asymptotic values rather quickly (Brown and Warner 1985). This implies that even in the presence of abnormal returns that do not obey a normal distribution, one can still use parametric tests invoking the Central Limit Theorem. The real problem is the potential for a selection bias. In our study, there could be observed and unobserved common characteristics among these few firms that make them more prone to become a target for a tender offer. In this sense, one cannot draw inferences for the total population of tender offers. This issue will be addressed again in the fifth section.
3.3 Estimation of abnormal returns
There are mainly three models to estimate abnormal returns: the constant-mean return model, the market model, and the market adjusted model.5 Nevertheless, in this research only the market model is used. In the following sections one discusses the market model in tow alternative scenarios: full-segmentation of capital markets and partial integration.
3.3.1 The market model with full-segmentation
The market model with full-segmentation states that:
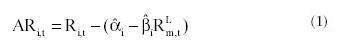
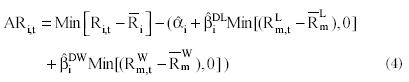
Where6
ARi,t : Abnormal return of stock "i" in period "t"
Ri,t : Realized return of stock "i" in period "t"
RLm,t : Return of a local market index in period "t"
The market model adjusts for the stock return for the local systematic risk in estimating the abnormal return. In this way, the variance of the abnormal return will be reduced because one is removing the portion of the return that is related to the local market index. Popular choices for the market index are the local equally weighted market index and the local value weighted market index. However, the former index is more likely to detect abnormal returns because it has been shown that is more correlated with market returns (Peterson 1989).
Usually, the model parameters (alpha and beta) are estimated using Ordinary Least Squares (OLS) during the estimation window. The OLS estimation of equation (1) relies on two crucial assumptions: the variance of the abnormal return is constant through time and there is no time series correlation among the abnormal returns. Hence, the model implies absence of heteroskedasticity and serial correlation. Unfortunately, these assumptions are usually not met. In particular, thin trading could generate times series dependence or serial correlation.
If there is heteroskedasticity and serial correlation in abnormal returns it is better to use a different method to estimate the model parameters such as the Generalized Autoregressive Conditionally Heteroskedastic Model (GARCH). The GARCH (1,1) is expressed in the following way (2):
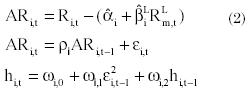
Where:

Furthermore, event clustering within the same time period could generate another problem: cross-correlation among abnormal returns of different stocks. Although, Brown and Warner (1985) have noted that, unless the potential bias is substantial, it is better to assume cross-sectional independence, it is wise to avoid event clustering otherwise the statistical power of the tests will diminish.
Another problem is a variance increase use to the event announcement. This also generates the problem of heteroskedasticity. If one uses the variance of the estimation window instead of the variance of the event window, the tests statistics will yield too many rejections of the null hypothesis that the cumulative average abnormal return is equal to zero. A way to deal with this problem is by using the standardized cross-sectional test proposed by Boehmer et al. (1991).
The OLS estimation of the model parameters also relies on the assumption that abnormal returns are normally distributed. There is considerable evidence that daily stock returns (raw returns), and their respective abnormal returns, are right skewed and leptokurtic (fat tails) (Fama 1976). In emerging markets stock returns are considerable more skewed and leptokurtic than in developed markets (Bekaert et al., 1998). Although, the parametric tests statistics converge rather quickly to a normal distribution, it is advisable to estimate the model parameters using a procedure that allows for the non-normality in the cross-section of abnormal returns, such as the Theil procedure proposed by Dombrow et al. (2000) or to use a non-parametric test to test for abnormal returns. In particular, one may use two nonparametric tests: the sign test analyzed by Cowan (1992) or the rank test proposed by Corrado (1989).
3.3.2 The market model with partial integration
Emerging markets are not completely segmented, but rather partially integrated (Bodnar et al., 2003). In such a situation a better way to specify abnormal returns is by using a hybrid version of the market model where local and world events play a role in explaining stock returns:
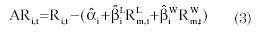
Where:
 Return of a global market index in period "t".7
This model can be estimated using OLS or the GARCH procedure, but given the high volatility of emerging markets it is better to use the later procedure instead of the former to estimate the model parameters within the estimation window.
As previously stated, stock returns in emerging markets are non-normal because they are usually right skewed. In other words, investors in these markets face substantial downside risk (Estrada, 2000). In this sense, Estrada (2002) proposed a modification of the traditional Capital Asset Pricing Model (CAPM) in order to allow for downside risk, the result was the D-CAPM. This model states that what matters to expected returns in emerging markets is the downside systematic risk or downside beta as opposed to the total systematic risk or beta from the traditional CAPM.
The ex-post version of a hybrid D-CAPM can be used to estimate abnormal returns. This version is expressed in the following way:
In this version one is considering partial integration and downside risk simultaneously. Furthermore, given the non-normality of emerging market stock returns, the parameters of model 3 and 4 can be estimated using the GARCH procedure.
3.4 Tests for abnormal returns
Once abnormal returns have been estimated for each stock, using one or more models, one has to test whether abnormal returns are statistically significant or not. This task can be performed for each day or for a time interval during the event window. The test for each day aims to test whether individual cumulative abnormal returns are statistically significant, while the test for a time interval aims to determine the statistical significance of cumulative average abnormal returns during a selected time interval for a group of stocks.
Two main situations can arise: only one event occurs per stock or each stock is subject to the occurrence of many events within the selected time interval. In both cases, one may use parametric and nonparametric tests statistics. The choice of one or more test statistics depends on the situation faced by the researcher. In emerging markets the situation usually is far from ideal, so the best way to proceed is by using a combination of parametric and nonparametric tests.
Parametric tests use standardized abnormal returns to align event period abnormal returns’ volatility with its estimation period volatility and to prevent stocks with large volatility to dominate test statistis (Boehmer et al., 1991). The standardized abnormal return is given in the following way:
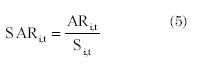
Where:
SARi,t: Standardized abnormal return for stock "i" within the event window
Si,t: Standard error
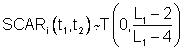
Now, one can cumulate abnormal return for each stock within the time interval [t1,t2] in the following way:
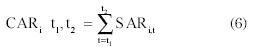
The standard error involves information from the estimation window and from the event window because it must include the standard error of the estimate (from the estimation window) and the standard error of the forecast (from the event window).
Parametric tests can be defined to test for abnormal returns per each stock at any given date, but in this research one is interested in detecting aggregate abnormal performance for a give period or time interval. In this sense, one must define parametric and nonparametric test accordingly.
In order to aggregate abnormal returns across several stocks and events for a selected time interval [t1, t2] (within the event window), the first step is to aggregate the individual abnormal returns considering N events. The average abnormal return for period "t" is as follows:
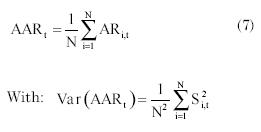
The next step is to aggregate the average abnormal returns through the selected time interval. The result is as follows:
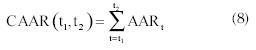
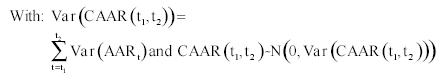
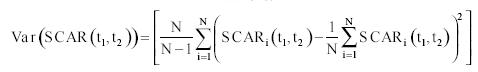
The variance of CAAR assumes that different event windows do not overlap to each other (i.e. no event clustering), so one may avoid covariance terms. Then, in order to test the null hypothesis that cumulative average abnormal returns are zero, one uses the following test statistic (MacKinlay 1997 and Campbell et al., 1997):
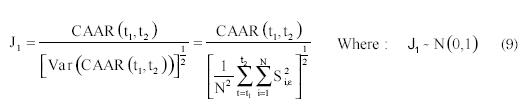
Whenever one considers that cumulative abnormal returns vary across securities, it is suitable to give equal weight to the realized cumulative abnormal return of each security. This is what J1 does.
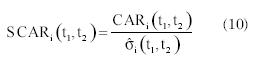
Another possibility is to consider constant abnormal returns across securities. In this case it is more appropriate to give more weight to the securities with the lower abnormal return variance so that the power of the test will improve. In order to construct a test consistent with this possibility one must first construct a test statistic for each security using the standardized cumulative abnormal return within the selected time interval [t1, t2] (Patell, 1976):
Where:
The standardized cumulative abnormal return has a Student-T distribution with a null expectation. As long as the length of the estimation window increases (L1>30), the distribution for this test converges to the standard normal distribution (Cowan and Sergeant 1996). Now, by aggregating expression 10 through the number of events within the selected time interval (Campbell et al., 1997):
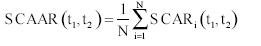
One obtains the second parametric test statistic:
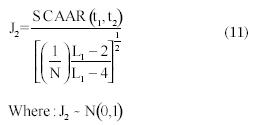
SCAAR(t1,t2): Average standardized cumulative abnormal return for the event window [t1,t2]
Brown and Warner (1985) report that the Patell’s test (expression 10) is well specified under a variety of conditions. Furthermore, there is little to gain by using a more complicated test unless there is a serious problem like an increase in the variance of abnormal returns (induced by the event) or unusually high cross-correlation. If the variance of abnormal returns increases on the event date the Patell’s test rejects the null hypothesis more often than the nominal significant level (Cowan and Sergeant 1996). In other words, event-related variance increases cause these tests to report a price reaction more often than expected (Cowan 1992). In order to avoid this problem, one may use the Boehmer et al. (1991) test or better known as the BMP test:
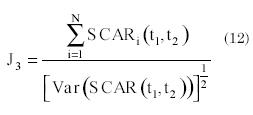
Where:
Due to the fact that the BMP test works with data from the event window, it can consider any event-induced variance and it is not affected by the problem of thin trading. Furthermore, the test is essentially unaffected by the presence of event-date clustering (Boehmer et al., 1991).
Concerning the problem of non-normality, one may try to tackle this problem using a nonparametric test, which does not rely on this assumption. Here, there are two choices either the generalized sign test or the rank test from Corrado (1989). In general the rank test is more powerful than the generalized sign test in detecting abnormal returns, however in the presence of event induced variance different authors favor the generalized sign test. Besides, given that in the presence of non-normality both test are well specified and equally powerful, in this research one has favor the generalized sign test over the rank test.
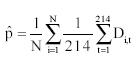
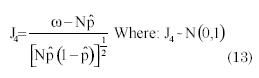
The generalized sign test aims to determine whether the number of securities with positive cumulative abnormal returns in the event window exceeds the expected number in the absence of abnormal security performance (Cowan 1992). The expected number of positive abnormal returns along 214-day estimation period is given by:
In the above expression, the dummy variable "D" takes the value of one whenever there is a positive abnormal return for security "i" on day "t", otherwise is zero. Now, if one defines "ω" as the number of securities in the event window with a positive cumulative abnormal return, one may write the generalized sign test statistic (S) in the following way:
These four tests (three parametric and one nonparametric) will be used in the empirical part of this research.
4. SAMPLE CRITERIA AND DATA DESCRIPTION
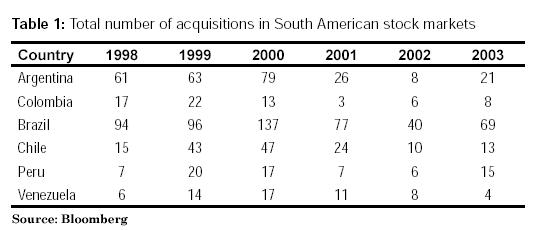
Table 1 shows the total number of acquisitions in six South American capital markets. Only a small fraction of the total number of acquisitions fulfilled our sample criteria. The criteria to select a particular acquisition were based upon the following five requirements: the type of acquisition must be a tender offer, only target firms that have been subject to a first tender offer during the period 01/01/1998 to 12/31/2003 were selected, each firm in the sample must have a market presence of at least 60% during the estimation period and non-missing observations for the event period, there must be no other news besides the announcement of the tender offer during the analyzed period, and securities with overlapping event periods are excluded from the analysis unless they belong to different industries.
The above period of analysis was chosen because no acquisition fulfilled our sample criteria during the three previous years: 1995-1997. The requirement of a market presence of at least 60% during the estimation period was meant to include as much firms as possible. However, as Table 2 shows only one firm had such low market presence, the remaining firms had more than 80% presence.
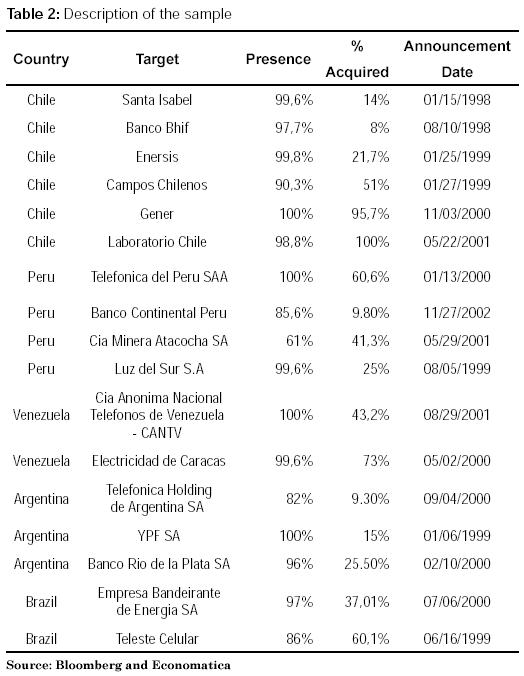
The indicator of presence is definned as follows:
Where:
q: Number of days in which there were at least 1 trade of the stock within the selected period
d: Total number of days within the selected period
Missing quotes were treated in the way suggested by Brown and Warner (1985): the missing quote and the succeeding period quote were removed from the analysis. This method attains the greatest sample size without affecting the identification of abnormal performance (Peterson 1989). The remaining two criteria were established to avoid any confounding effects and any cross-correlation due to event clustering, respectively.
Applying the above selection criteria yield only 17 companies, which are reported in Table 2. Two observations are in order: there was no firm in Colombia able to fulfill the sample criteria, and there was no firm able to fulfill the sample requirements in 2003. Therefore, our results only apply for the period 1998-2002.
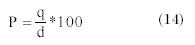
Given the small sample size cause of concern is the possibility for a selection bias. In particular, one may wonder if there are observed and unobserved common characteristics among these few firms that make them more prone to become a target for a tender offer. However, as Table 2 shows, it seems to be no selection bias due to observable variables. Indeed, target firms are based in different countries, the percentage acquired varies widely, bidder firms come from different countries (not reported), and target firms belong to different industries (see Figure 2).8
5. METHODOLOGY AND RESULTS
This section explains briefly the different steps used in this research to determine the daily abnormal performance of stock returns. The event under study is the announcement of a tender offer from the bidder firm to the target firm. In this sense, one is interested in the announcement date of the tender offer instead of the effective date where the acquisition was made.
Around the announcement date reported in Table 2, one has defined an estimation period of 214 days and an event period of 30 days where 20 days were defined prior to the announcement date and 10 days after this date. Hence, there are 245 days per stock including the announcement date.9
The market model was used to estimate daily abnormal returns per stock.10 However, due to the fact that one is working with target firms from different countries, one needs to control for differences in the level of market integration across the five capital markets considered. Hence, it has been decided to use a hybrid version of the market model with and without downside risk. In other words equations 3 and 4 were used to estimate daily abnormal returns. The hybrid market model does not include currency risk, so one implicitly assumes that the influence of this risk upon stock prices is small.11
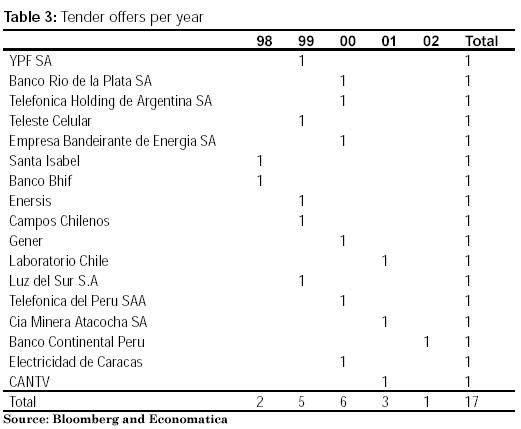
In order to account for the possibility of heteroskedasticity and serial correlation among abnormal returns, equations 3 and 4 were estimated using the GARCH (1,1) procedure. Furthermore, confounding effects were avoided, as well as event clustering unless stocks belong to different industries. Table 3 shows potential event clustering in years 1998-2001, but from Table 2 one may see that only in years 1999 and 2001 there is event clustering. However, it is unlikely to find cross-correlation because in 1999 and 2001 firms belong to different industries and in 2001 they even belong to different countries.
Following the suggestions by many authors, one has used parametric and nonparametric tests were used to detect aggregate abnormal performance. Three parametric tests were used (J1, J2 and J3) and one nonparametric test (J4). The first two tests were used because they have some ability to detect abnormal performance even with small sample sizes, while the BMP test (J3) was used to account for event-induced variance. The generalized sign test (J4) served to account for non-normality in the cross-section of abnormal returns.
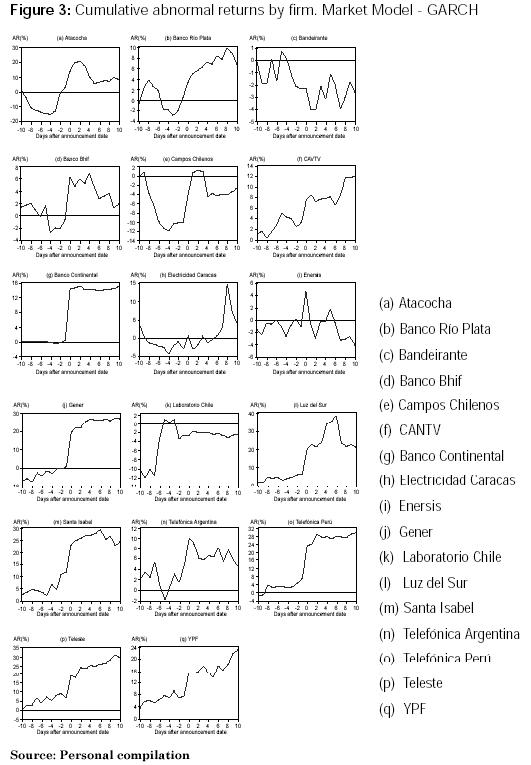
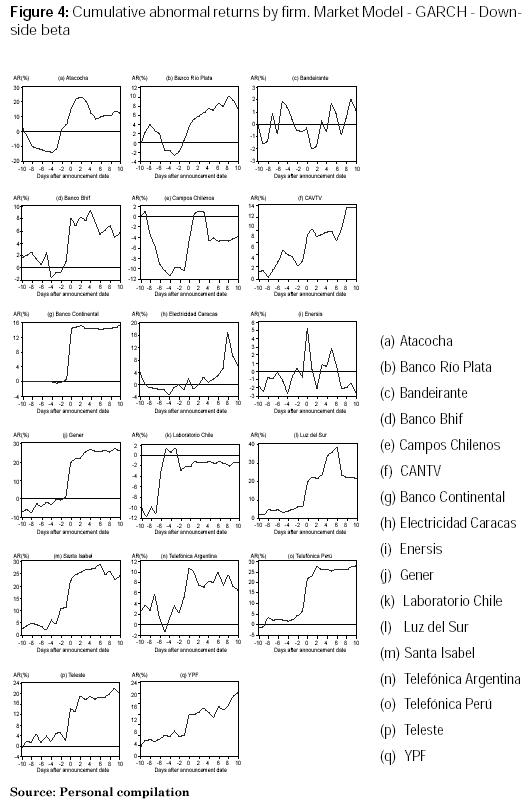
A major concern in working with a small sample size is the possibility that one firm (an outlier) drives the results. Figures 3 and 4 the cumulative abnormal returns for each firm in the sample according to the two models used to estimate abnormal returns (in both figures firms were ordered from left to right). It is not true that positive abnormal returns are present only in one or two firms. In both Figures, more than 80% of the firms report positive cumulative abnormal returns (See Table 3).
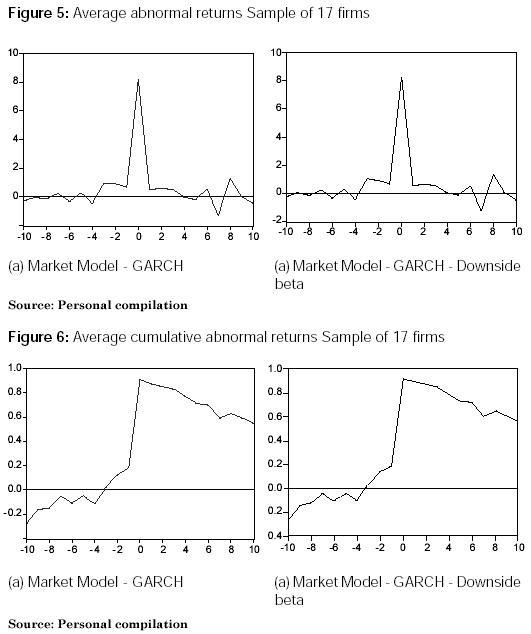
Another important problem is the possibility for an event-induced variance increase. From Figures 5 and 6, there seems to be an event-induced variance, so one needs to account for this problem. It is also remarkable the similarity among the results of both specifications with and without downside risk. However, as expected, abnormal returns with the partial integration model with downside risk are higher than the ones obtained with the model without downside risk.
Tables 4 and 5 report the statistical significance of average cumulative abnormal returns. Parametric tests J1 and J2 show statistically significant positive abnormal returns ranging between 3.1% and 8.2% for one day before and one day after the announcement of the first tender offer. This result isrobust across both specifications. Furthermore, the BMP test (J3) is able to detect positive abnormal returns ranging between 0.18% and 8.2% for different windows mainly before the announcement date. However, abnormal performance due to information leakage is of low magnitude because abnormal returns range between 0.18% and 0.48%. It is worth noting that the partial integration model with downside risk yield more significant abnormal returns than the partial integration model without downside risk.(See Table 4-5).
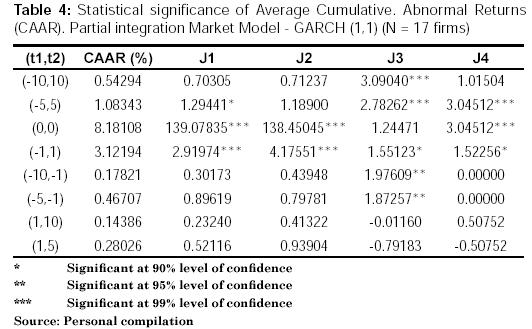
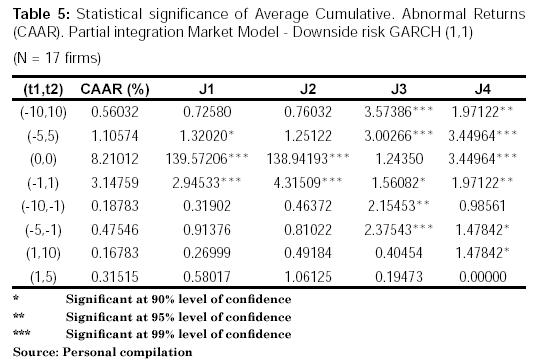
The performance of the partial integration market model with downside risk even improves when the generalized sign test is used. In this case, the generalized sign test is able to detect not only positive abnormal performance before, but also after the announcement date of a tender offer. Nevertheless, the market overreaction is of low magnitude (0.17%).
In general, the results show a positive abnormal return of about 8% for the announcement date of a tender offer and low positive abnormal returns for the days before and after the announcement date.
6. CONCLUSION
Consistent with the previous literature, the results obtained show that tender offers in South America do convey good news to the market in the way of positive abnormal performance for the announcement date. However, the reported abnormal performance (8%) is substantially lower than the one reported by the studies reviewed in the introductory part.
The reason for the above result lies in the different views about South American stock markets. In this research, one believes in the view of partially integrated capital markets instead of the full-segmented view. In this scenario stock returns are also sensitive to world events, so abnormal returns cannot be as large as in the case of a full-segmented capital market.
The results also show traces of information leakage and market overreaction. This is consistent with previous literature about stock market efficiency in South American stock markets. For instance, Mongrut (2002) finds short-term overreaction at the LSE. However, the information leakage seems more robust across model specifications than market overreaction.
The later result is not strange because the days previous to the announcement date of the tender offer are contaminated by the negotiations between the target and the bidder company, and the speculation about the acquisition. Hence, it is likely that some information is filtered to the market.
Although this study has presented evidence of positive abnormal performance surrounding the first announcement of a tender offer, several questions remain unanswered: How one may improve the model used in this study to characterize a situation of partial integration? How do abnormal returns relate to the firm ownership concentration? How do they relate to successful and unsuccessful bids? These questions add to a large list of unsolved issues in emerging markets that one hope are going to be addressed in the near future.
References
1. In fact, the emerging market covariance and correlation with the world return may increase due to the financial liberalization.
2. We only discuss the results related to target firms because we found no evidence of positive or negative abnormal returns in the sample of bidder firms (not reported).
3. Fuenzalida and Nash (2004) have shown that the Tender Offer Law in Chile has depressed the Stock Exchange because it forces the acquisition of 100% of a given stock package when 2/3 of the stock ownership is reached. This situation generates an incentive to turn diffusely held firms into closely held firms and eventually leave the Stock Exchange.
4. All Figures and Tables are own elaboration unless otherwise stated.
5. Brown and Weinstein (1985) have concluded that there is little value to gain in using a multifactor model (such as the Arbitrage Pricing Theory-APT) versus the market model. Furthermore, Dyckman et al. (1984) have concluded that the market model is more suitable for detecting abnormal performance.
6. The data corresponding to stocks was obtained from Economatica for each country in US$ dollars. One also uses the Morgan Stanley Capital International (MSCI) Stock Market Indexes.
7.The Global Market Index is the one provided by the MSCI.
8.The total number of acquisitions is based on the effective date of the acquisition instead of the announcement date of the acquisition.
9. It was not possible to work with a bigger number of days for the estimation period because the number of stocks would fall. Conversely, a lower number of days for the estimation period would damage the significance of the estimation of the model’s parameters.
10. Other models such as the constant-mean return model and the market-adjusted model were not used because there is no way to account for differences in market integration.
11. In the presence of substantial currency risk, it would have been better to use the International Capital Asset Pricing Model (ICAPM) analyzed by Bodnar et al. (2003).
The authors are grateful to Alex Saldaña and Carlos Barrientos for outstanding research assistance.
BIBLIOGRAPHIC
1. Asquith, D. (1988) Evidence on theories of volume, Bid-Ask spreads and return premia among NASDAQ targets of tender offers bids, Doctoral Research Paper, UCLA. Los Angeles, Estados Unidos. [ Links ]
2. Bekaert, G., and Harvey, C. (2003) Emerging markets finance. Journal of Empirical Finance, 10, 3-55. [ Links ]
3. Bekaert, G., Erb, C., Harvey, C. and Viskanta, T. (1998) Distributional characteristics of emerging market returns and asset allocation. Journal of Portfolio Management, 102-116. [ Links ]
4. Bodnar, G., Dumas, B., and Marston, R. (2003) Cross-border valuation: The international cost of equity capital. National Bureau of Economic Research (NBER) working paper 10115. [ Links ]
5. Boehmer, E., Musumeci, J., and Poulsen, A. (1991) Event-study methodology under conditions of event-induced variance. Journal of Financial Economics, 30, 253-272. [ Links ]
6. Bredley, M., Desai, A., and Kim, H. (1983), The rationale behind Interfirm Tender Offers, Journal of Financial Economics, 11, 183-206. [ Links ]
7. Brown, S. and Warner, J. (1985) Using daily stock returns: The case of event studies. Journal of Financial Economics, 14, 3-31. [ Links ]
8. Brown, S. and Weinstein, M. (1985) Derived factors in event studies. Journal of Financial Economics, 14, 491-495. [ Links ]
9. Campbell, J., Lo, A. and MacKinlay, C. (1997) The econometrics of financial markets. Princeton University Press, New Jersey. [ Links ]
10. Cohen, H., Hawawini, G., Maier, S., Schwartz, R., and Whitcomb, D. (1983) Estimating and adjusting for the intervalling effect bias in beta. Management Science, 29, 135-148. [ Links ]
11. Corrado, C. (1989) A nonparametric test for abnormal security-price performance in event studies. Journal of Financial Economics, 23, 385-395. [ Links ]
12. Cowan, A. (1992) Nonparametric event study tests. Review of Quantitative Finance and Accounting, 2, 343-358. [ Links ]
13. Cowan, A. and Sergeant, A. (1996) Trading frequency and event study test specification. Journal of Banking and Finance, 20, 1731-1757. [ Links ]
14. Dimson, E. (1979) Risk measurement when shares are subject to infrequent trading. Journal of Financial Economics, 7, 197-226. [ Links ]
15. Dodd, P., and Ruback, R. (1977) Tender offers and stockholders returns: An empirical analysis, Journal of Financial Economics, 5, 351-373. [ Links ]
16. Dombrow J., Rodriguez, M. and Sirmans, C. (2000) A complete nonparametric event study approach. Review of Quantitative Finance and Accounting, 14, 361-380. [ Links ]
17. Dyckman, T., Philbrick, D., and Stephan, J. (1984) A comparison of event study methodologies using daily stock returns: A simulation approach. Journal of Accounting Research, 22, 1-30. [ Links ]
18. Estrada, J. (2000) The cost of equity in emerging markets: A downside risk approach. Emerging Markets Quarterly, 4, 19-30. [ Links ]
19. Estrada, J. (2002) Systematic risk in emerging markets: The D-CAPM. IESE working paper. [ Links ]
20. Fama, E. (1976) Foundations of finance. New York: Basic Books, Inc. [ Links ]
21. Fuenzalida, D., and Nash, M. (2003) Efecto de la Ley de OPA en el retorno de la acción en Chile. Mexican Journal of Economics and Finance, 2 (4), 305-320. [ Links ]
22. Fuenzalida, D., and Nash, M. (2004) Different Legislations Regarding OPAs. Estudios Gerenciales, 91, Abril-Junio, 13-34. [ Links ]
23. Harvey, C. and Morgenson, G. (2006) Dictionary of Money and Investing: The Essential A-to-Z Guide to the Language of the New Market. The New York Times Ed. [ Links ]
24. Jarrell, G., Brickley, J., and Netter, J. (1988) The market for Corporate Control: The empirical evidence since 1980. Journal of Economic Perspectives 2, (1), 49-68. [ Links ]
25. Jensen, M. and Ruback, R. (1983) The market for corporate control: The scientific evidence, Journal of Financial Economics, 11, 5-50. [ Links ]
26. MacKinlay, C. (1997) Event studies in economics and finance. Journal of Economic Literature, 35 (1), 13-39. [ Links ]
27. Moloney (2002) The Market for Corporate Control, Clemson University, 18th document. [ Links ]
28. Mongrut, S. (2002) Market efficiency: An empirical survey in Peru and other selected countries. Apuntes 51, Segundo semestre, 49-85. [ Links ]
29. Mongrut, S. (2006) Tasas de descuento en Latinoamérica: hechos y desafíos. Documento de discusión No. 9, centro de investigación de la Universidad del Pacífico. [ Links ]
30. Patell, J. (1976) Corporate forecasts of earnings per share and stock price behavior: Empirical tests. Journal of Accounting Research, 14, 246-276. [ Links ]
31. Peterson, P. (1989) Event studies: A review of issues and methodology. Quarterly Journal of Business and Economics, 28 (3), 36-66. [ Links ]
32. Scholes, M. and Williams, J. (1977) Estimating betas from nonsynchronous data. Journal of Financial Economics 5, 309-327. [ Links ]
33. Stulz, R. (1999) Globalization of equity markets and the cost of capital. National Bureau of Economics Research (NBER) working paper 7021. [ Links ]
34. Zingales. L (2000) ¿Por qué vale la pena tener el control de la empresa? Mastering Management 6, Diario Estrategia de Chile. [ Links ]

