


Services on Demand
Journal
Article
 English (pdf)
 Article in xml format
 Article references
 Send this article by e-mail
Indicators
-
 Cited by SciELO
 -
 Access statistics
Related links
-
 Cited by Google
 -
 Similars in
SciELO
Similars in
SciELO -
 Similars in Google
Share

 Permalink
Estudios Gerenciales
Print version ISSN 0123-5923
estud.gerenc. vol.23 no.105 Cali Oct./Dec. 2007
LEAN MANUFACTURING MEASUREMENT: THE RELATIONSHIP BETWEEN LEAN ACTIVITIES AND LEAN METRICS
Medición en Lean Manufacturing: Relaciones entre Actividades Lean y Métricas Lean
DIEGO FERNANDO MANOTAS DUQUE1, LEONARDO RIVERA CADAVID2
1Ingeniero Industrial, Universidad del Valle. Especialista en Finanzas, Universidad del Valle. Maestría en Gestión Financiera, Universidad de Chile. Profesor Asistente, Escuela de Ingeniería Industrial y Estadística, Universidad del Valle, Cali, Colombia. manotas@pino.univalle.edu.co
2Ingeniero Industrial, Universidad del Valle. Master of Science in Industrial Engineering, Georgia Institute of Technology. Ph.D. in Industrial Engineering, Manufacturing Systems Option, Virginia Polytechnic Institute and State University. Profesor de tiempo completo, Departamento de Ingeniería Industrial, Universidad Icesi, Cali, Colombia. leonardo@icesi.edu.co
Fecha de recepción: 14-01-2007 Fecha de corrección: 27-06-2007 Fecha de aceptación: 24-08-2007
ABSTRACT
Lean Manufacturing was developed by Toyota Motor company to address their specific needs in a restricted market in times of economic trouble. These concepts have been studied and proven to be transferrable and applicable to a wide variety of industries. This paper aims to integrate a set of metrics that have been proposed by different authors in such a way that they are consistent with the different stages and elements of Lean Manufacturing implementations. To achieve this, two frameworks for Lean implementations are presented and then the main factors for success are used as the basis to propose metrics that measure the advance in these factors. A tabular display of the impact of "Lean activities" on the metrics is presented, proposing that many a priori assumptions about the benefits on many different levels of improvement should be accurate. Finally, some ideas for future research and extension of the applications proposed on this paper are presented as closing points.
KEY WORDS
Lean Manufacturing, Performance Metrics, Measurement Systems, Lean Activities
RESUMEN
Lean Manufacturing fue desarrollada por Toyota para satisfacer sus necesidades específicas en un mercado restringido y en tiempos de estrechez económica. Estos conceptos han sido estudiados y se ha comprobado su aplicabilidad en una amplia variedad de industrias. El objetivo de este artículo es el de integrar un conjunto de métricas que han sido propuestas por diferentes autores, de tal manera que sean consistentes con las etapas y elementos de implementaciones de Lean Manufacturing. Para lograrlo se presentan dos marcos de referencia para implementaciones Lean y los principales factores de éxito se utilizan como base para proponer métricas que identifiquen el avance en estos factores. Posteriormente se propone una tabla que cruza el impacto de las "Actividades Lean" sobre las métricas, postulando que muchos de los supuestos a priori sobre estos impactos deberían ser precisos. Finalmente se proponen algunas ideas para proyectos de investigación hacia el futuro y posibles extensiones de las aplicaciones propuestas aquí.
PALABRAS CLAVE
Lean manufacturing, indicadores de desempeño, sistemas de medición, actividades Lean.
1. INTRODUCTION
This article presents the relationship between the activities that are normally considered part of Lean Manufacturing and the performance metrics that are proposed for Lean environments.
To accomplish this, first a brief historical and conceptual background in Lean Manufacturing is presented, followed by a framework of success factors for Lean implementations.
Then, the dimensions of performance that should be measured in a Lean environment are presented, followed by the development of metrics for each of these dimensions.
Finally, a table is used to relate the activities that are associated with Lean production to the performance indicators previously described.
Avenues for future research are mentioned, in order to suggest possibilites for further exploration in this topic of the effect of Lean Activities in the performance measures.
2. BACKGROUND IN LEAN MANUFACTURING
2.1 Historical Development
To provide context for Lean Manufacturing and measurement systems, it is important to understand the historical development of Lean concepts. Should the reader desire to investigate further about the development of Lean Manufacturing, there is extensive bibliographical material available.
All roots of Lean point first to Henry Ford, who put in place an impressive production system in the Highland Park manufacturing plant, in 1913. There, a set of practices and tools (interchangeable parts, standard work and the assembly flow line) was put in place in such an integrated way that allowed them to turn out products at incredible speeds, with very short flow times and high consistency.
This system was not very flexible, though. The Model T was manufactured virtually unchanged during 19 years under this system, and there was no need for setups or changeovers since there was only one product being processed in that line. Increased demand for shorter product cycles and more variety, as well as the market demands after World War II, changed the competitive marketplace in such a way that Ford´s early "Leanness" was not sustained in the long run.
But, there were good students learning important lessons. Kiichiro Toyoda (member of the founding family of Toyota) and Taiichi Ohno (Toyota´s leading manufacturing engineer) visited Ford factories right after World War II and observed their operation. They were convinced that with some elements from the Ford system, their adaptation to their scale and reality and a lot of ingenuity they could make Toyota a competitive force in the automotive market.
Essentially, they changed the emphasis from machine and workstation optimization to product flow through the total process, implementing some clever and "simple" ideas like dimensioning the manufacturing resources according to actual demand (rightsizing), improving the self-monitoring capabilities of equipment to ensure quality (Jidoka), designing the process layout to facilitate the sequence of the operations (Group Technology), studying and improving quick setups to enable rapid changeovers (SMED) and the use of kanbans to coordinate the production pull from and link one workstation to its predecessors and successors, and also to link the company with its suppliers and enable JIT supply (Womack, 2002).
These processing improvements made possible to offer a wide variety of products in a sequence that reflected more closely the market´s demands, reducing lead times and eliminating the need for large volumes of inventory (which, with the space constraints for manufacturing and warehousing facilities in Japan, was critical for the financial success of any business).
Also, a management system was developed to reflect and support all these changes in focus and style, which is now known as the "Toyota Production System" (TPS). It is not the focus of this document to go into great detail about TPS, however some elements will be mentioned, like autonomous work teams, visual controls and information displays, "andon" lights to observe the status of the process, "jidoka" (autonomation) or the ability of equipment to detect out of control processes and stop itself, and the continuous strive to reach one piece flow.
2.2. General Principles
Since this is not a treaty on Lean Manufacturing implementation, the reader would find examples and case studies on Lean implementation in different sources in the literature (Thompson and Wallace, 1996; Grutter, Field and Faull, 2002; Sohal, 1996;
It has been said that the two basic concepts in Lean thinking are to eliminate waste and create value (Murman et. al., 2002). Emiliani (1998), based on Womack and Jones (1996) presents a more detailed framework with five basic steps:
- Specify Value: What do customers want? When and how do they want it? What combination of features, capabilities, availability and price will be preferred by them?
- Value Stream Analysis: A Value Stream is the collection of processes and activities required to bring a product to the customer, from beginning to end. The Value Stream is not limited by boundaries between companies; that is the reason to strive to integrate suppliers, manufacturers, distributors and even retailers in the efforts to recognize and analyze the Value Stream. Also, three main categories of activities are distinguished: a). Those that add value; b). Those that do not add value but cannot be currently avoided and c). Those that do not add value and should therefore be eliminated.
- Continuous Flow: Companies should try to make value flow continuously, not in batches. In this paradigm, the term onepiece flow has great appeal and is highly coveted. Also, traditional functional organizations do not help continuous flow, therefore a focused teams approach (closer to the product) is recommended.
- Customer Pull: A principle made popular by the JIT concepts; it states that companies should not push their products to customers, and rather let them pull "value" (products or services) and link all the production chain (even with suppliers) in such a way that materials are not released and activities are not done until they are needed. The discipline of pull is established and enforced by using kanbans, which are physical or electronic mechanisms to transmit the need for parts and subassemblies from one point in the process to the preceding one.
- Continuous Improvement: As the commercial slogan for the Toyota luxury brand (Lexus) puts it, it is "The passionate pursuit of perfection". It is the conviction that improvement efforts are never finished, and it is the consistency to keep the discipline for improvement in place (kaizen).
3. THE TRANSFORMATION PROCESS
3.1. Planning the change
The first steps to do when embarking on a transformation process provide an important foundation for the journey. Three things should be present before starting any project:
- Define the need for change (burning platform): It is essential to understand and communicate continuously what is the motivation for a Lean transformation effort. This should provide guidance and clarity to everybody in the company (Hyer, et.al, 1999).
- Top management commitment and support: If employees don´t see, feel and believe in a real commitment from upper management, nothing much will happen. This involvement and support should be not only verbal but also factual, with managers participating in shop floor activities and kaizen events.
- Identify target areas, model lines and propagation strategy: A plan should be crafted, indicating which production lines will be transformed to Lean, in what sequence and time frame. This plan should also address which lines are going to go first, to be used for demonstration effect, and also how the people from that line (with newly acquired knowledge and skills) are going to contribute in the propagation of Lean concepts through training and coaching for subsequent product lines.
3.2 Success Factors
According to the framework developed by Liker (1998), presented (with minor additions and changes) in Figure 1, there are four key factors for success in the implementation of a Lean effort:
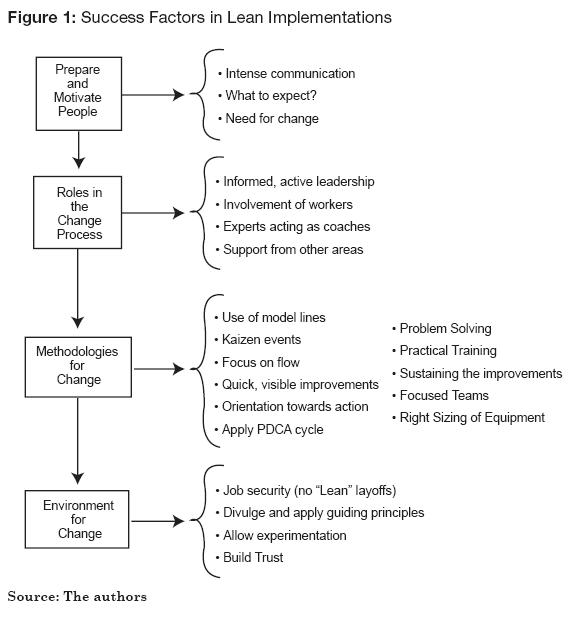
Preparation and motivation of people: Intense communication, clarification of expectations, emphasize the need for change and, essentially, letting people know what´s ahead.
Roles in the change process: The need for an informed and active leadership, the involvement of the employees in all aspects of the project, experts acting as coaches and support from management and the other functional areas are required roles that need to be filled for the success of a lean implementation.
Methodologies for change: Here all the technical tools that sometimes are thought to be "the Lean things" come into play, like the use of model lines, kaizen events as a way to participate and show quick and visible improvements, the orientation to action (training is done simultaneously in the classroom and in the practice in the shop floor), the work in focused teams, the right sizing of equipment and the change of the physical line layout.
Environment for change: As in any transformation effort, the environment that upper management facilitates and puts in place is critical for success. In Lean implementations is important to provide job security (no Lean-related layoffs), constant reinforcement of the guiding principles, a safe environment for experimentation and a climate of mutual trust between workers and management and also amongst different work teams. These success factors have to be taken into account in the planning of the process, so the implementation phase can begin.
3.3 Implementation
In Figure 2 a framework for Lean Manufacturing implementation is presented.
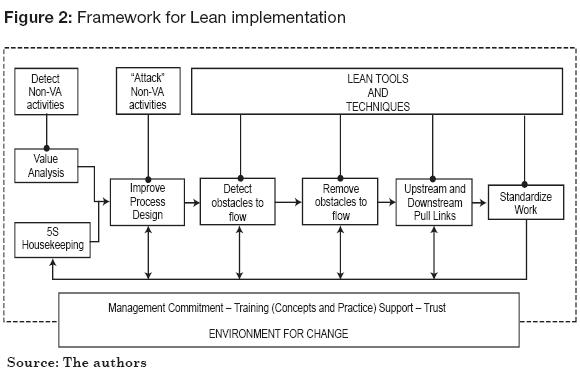
These implementation activities should lead to improvement in five dimensions, which are the concepts the company is trying to put into action (Adapted from Karlsson and Ahlstrom, 1996 and Martinez and Perez, 2001).
1. Elimination of waste
2. Continuous improvement
3. Continuous flow and Pull-driven systems
4. Multifunctional teams
5. Information systems
The degree to which these goals are "reached" will lead to the proposal of metrics that reflect the advancement of a team or line in the implementation of Lean Manufacturing.
3.4. Measuring the progress
For each of the improvement dimensions, several indicators can show the company the evolution of the line in its process (Karlsson and Ahlstrom, 1996 and Martinez and Perez, 2001).
Elimination of waste: Waste is everything that does not add value to the product, like inventories, machine setups, machine downtime, movement of parts and scrap. Therefore, the metrics should reflect those categories of waste:
- WIP: Value of WIP in the line.
- Setup time: Time spent in setups/total productive time (percentage).
- Machine downtime: Hours-machine lost due to malfunction/Total machine hours scheduled (percentage).
- Transportation: Number of parts (trips) transported * Distance.
- Space Utilization: How much area does the line need, including its WIP and tools.
Continuous improvement: It represents the discipline of considering evolution as the normal state of a system. Some ideas to measure this include (Rentes and Van Aken, 2003):
- Number of suggestions per employee per year
- Percentage of suggestions that get implemented
- Scrap: % of the products that need to be scrapped.
- Rework: % of the units that need to be sent to rework.
Continuous flow and Pull-driven systems: It is the ability to abandon the batch mentality and adjust the processes to accept smoother movement of products through the line, which are going to be triggered by the pull of the customer of each process. Some metrics:
- Lot sizes: Average lot size for each product.
- Order flow time: Time an order spends being processed in the shop floor.
- Order lead time: Average time from the placement of an order (by a customer) to its delivery.
- Pulling Processes: Percentage of the line processes that pull their inputs from their predecessors.
- Pull Value: % of the total annual value or throughput of the system that is scheduled through pull mechanisms.
Multifunctional teams: In Lean implementations, teams have more responsibility and autonomy, so improvement and problem-solving can happen closer to the source (Niepce and Molleman, 1996; Forza, 1996). Also, to make flexibility in the line feasible, it is necessary to have a multi-skilled workforce. Some metrics for these aspects:
- Autonomous control: % of quality inspection carried out by the team.
- Workteam Task Content: % of the tasks required to make the product performed by the team.
- Cross training: Average over team members of Number of skills a team member possesses/Number of skills needed in a team.
- Number of employees capable of assignment rotation.
Information systems: The reduction of vertical levels in the structure, and the autonomous operation that teams have to reach, makes necessary that employees have timely access to better information to enable problemsolving and decision making. It does not necessarily mean, but it certainly does not exclude, computerized information systems. Some metrics:
- Frequency with which information is given to employees.
- Percentage of procedures that are documented in the company.
- Frequency with which the line or cell progress boards are updated.
3.5. Purpose of the Metrics
Every metrics system has different applications. A proposal such as the one presented in this article would have several uses, such as:
Monitoring the progress of a Lean implementation: The establishment of a baseline for the different metrics at the outset of an implementation process is necessary to show progress and to assess the effectiveness of the different changes, tools and techniques that are implemented.
Continuous monitoring: Once different tools are implemented (post-implementation), these metrics will serve, in a way, as the input to build control charts and to establish improvement goals for report periods (monthly, quarterly and yearly review meetings).
Benchmarking: It should be clear that no two factories are identical, not even manufacturing the exact same product. However, metrics can always be used for partial comparisons and to stimulate exchange of ideas and learning processes. Benchmarking is a key use of metrics to examine and compare processes that are similar; team performances; use of materials and process inputs; total and factor-specific productivity. No useful comparison can be drawn without the existence of at least basic measurements of the inputs, outputs and performances of processes and functions in the company.
4. IMPACT OF TYPICAL "LEAN ACTIVITIES" ON THE METRICS
The framework presented in this section is a proposal that and would require a technical investigation to be confirmed. It is, however, an interesting starting point to understand the relationship between the actions taken and their measured results.
When Lean Manufacturing is brought up, there are several things that come to mind such as production lines organized in cells, the use of kanbans for production control and many others. These, however, are not the principles that drive lean implementations, they are the tools that transformation teams have at their disposal to operationalize the Lean concepts. These are the "things to do" once it is known which are the "things to achieve".
However, it is interesting to try and classify the impact these activities should have on the Lean metrics that have been presented. This can illustrate the level of the impact that activities can have on the overall Lean transformation process, and will also serve to clarify why the adoption of some tools without the conceptual clarity of "why is the company doing this?" and "where is the company headed with this?" can have disappointing results.
The activities or features of a Lean system have been classified in four main categories, according to their focus. Some activities can be clearly considered to belong in more than one category, so they have been placed in the category that seemed to have a stronger association with them. The categories and activities are:
Industrial Engineering: This category includes the activities and features related to production planning and methods. The activities are:
- Production Smoothing: It is the effort to run the process in a sequence that resembles as closely as possible the composition of the actual market demand.
- Use of kanbans for pull: It is the employment of a signaling mechanism to inform the previous stage in the process that a certain number of a specific part is required.
- SMED (Single Minute Exchange of Dies): It is a systematic way of analyzing and shortening setup times.
- TPM (Total Productive Maintenance): It is a set of tools and techniques aimed at transforming maintenance from an activity done "when problems arise" to a normal part of operation.
- Work standardization: It is the formalization of the way things are done, to enhance their consistency and repeatability.
Physical Processes: These are the activities that require physical changes to equipment and workplace (probably suggested by Industrial Engineers anyway).
- Rearrange processes in cell layouts: This is the grouping of the equipment needed to produce a family of products into one specific area, to make them a unit.
- Right-sizing of equipment: Instead of rigid, hard automation, large batch equipment with lengthy setups, Lean operations require flexible, small lot size with faster changeover machines.
- Change the material handling equipment: For example, going from industrial trucks moving pallets (batches) of product to conveyors moving units without room for WIP accumulation.
- Visual Controls: It is the use of visual aids for different purposes in the workplace, like tool placement, control of equipment parameters and status of the process, for example.
Personnel Activities: These are activities and features that work mostly with people and the way they interact in and with the workplace.
- 5S: It is a set of principles and practices that improve the environment in the workplace and the quality of work life, starting from cleaning and sorting and evolving to self-discipline and autonomous teams.
- Power to stop the line: In Lean environments the workers have the authority to stop the production line when they detect defects to work immediately in their solution and attack the problem at its roots.
- Cross training: As workcells need to be more autonomous and also the production rhythm can be altered changing the staffing of a cell, it becomes essential that workers become multi-skilled. This also enriches the content of their work and improves their perspective for process improvement.
- Root-cause analysis: It implies the use of simple tools (Five whys, Fishbone Diagrams, 5M diagrams) to tackle the problems at work and find the solution to the problem, not to symptoms. This is essential in an environment with autonomous teams.
- Information Displays: Lean environments use a great deal of information displayed in the workcells and in the plant to enable everybody to know the status of the process at any given time.
Management Support: These features deal mostly with the environment set-up by management, to ensure that the transformation process takes place.
- Management Commitment: This has to be experienced all the workers, because if only middle management or the production area try to change to a Lean environment they will clash with other areas and upper management.
- Empowerment: The ability to make decisions as close as possible to the problem, the power and tools to know what to do or how to find help.
- Leading by example – involvement: Managers and engineers have to participate in training, 5S events and kaizen events. A manager with a messy and cluttered office can not praise the advantages of 5S to his workers.
- Monetary support: Some changes will require investment, like acquiring a rack for tool storage or installing a conveyor belt. The teams need to know that necessary investments will be done.
Figure 3 shows the impact that these Lean activities and features are expected to have on the different performance measures defined.
From Figure 3 it can be observed that all the metrics have at least a couple of activities that can affect them. Also, a lot of activities have an effect on the Multifunctional Teams section of the metrics, which seems to indicate that this section requires a lot of factors to be in place to happen adequately.
The activities that checked more boxes were Empowerment (8 boxes), Arrange Process into Workcells (7), Right-Sizing of Equipment (7), 5S (6) and Production Smoothing (6).
Again, this is a tentative table and would need to be confirmed with survey data; however it would seem consistent with the Lean philosophy that Empowerment was a rather important aspect of a transformation process.
Also interesting is the appearance of 5S, because it is perceived by some people as a rather mundane cleaning drive when in reality it is the practical foundation for improvement of the workplace, discipline, TPM and even self respect.
5. AREAS FOR FUTURE RESEARCH
After discussing Lean Manufacturing, its implementation and measurement, several questions arise that could lead to future research projects.
5.1. What is the impact of Lean Activities on Performance?
As it was seen in the last part of section 4 in this document, it would be necessary to design a survey and collect some data in Lean companies to confirm the proposals presented here. It would be very interesting to find out which activities are more powerful or more basic than others in a Lean implementation.
Also, future research could uncover a structure in these activities, in which some of the features are more building blocks of an environment for change and some others are final manifestations of specific production aspects that needed to be improved.
5.2. How to measure the alignment of the organizational culture with Lean principles?
As with any other change initiative, Lean implementations differ greatly from one company to the next. Some of the problems and discrepancies can be attributed to differences in market segment, production processes and competitive and regulatory environment. However, it seems reasonable to suspect that changes as big as a Lean implementation are greatly influenced by the culture of the company, its values and traditions.
It would be of great value to investigate which aspects of organizational culture are more important than others for a Lean implementation and how to measure them to develop a change management plan based on culture.
5.3. How to create financial measurements that relate Lean activities to bottom line results?
It is well known that main point of impact of Lean implementations is the reduction of times (total time in system, lead times, WIP amounts). However, only recently there has been some discussion to tie lean improvements to bottom line impacts (Rivera, 2006 a and 2006 b). In future research papers the relationship of lean improvements to the bottom line of the company and the actual cash flows will be explored.
5.4. How to use ERP systems to collect system-design information?
There is an interesting wealth of information in an ERP system. Crossing information from Manufacturing, Marketing and Logistics could generate vital inputs for a Lean system, such as the takt time (the production pace the market demands) for a given product, keeping current the Heijunka box (which levels the production to reflect in the shortest possible period the mix of demand for a family of products), the cycles and schedules of the water spider (a person who keeps the right levels of parts and raw materials close to their point of usage for just-in-time systems) and the analysis of use and number of kanbans that are required between different points of the process, from raw materials storage to finished goods warehousing.
5.5. Measurement systems for Lean Supply Chains and Lean Maintenance
Lean principles have been expanded in scope, from the manufacturing activities to encompass all the different processes that a company performs. Lean thinking promotes to apply these principles to maintenance, product development, marketing and human resources. Still, these are all activities that might be considered of the private purview of a single company. Many networks of companies (value networks) are striving to create Lean Supply Chains, where real-time logistical information flows to the points where it is needed and companies collaborate as a matter of daily activities. These networks aim to deliver to the customers the best possible value experience, and they work in a coordinated and cooperative fashion. A logical development of the metrics presented in this article is to characterize the new activities and interfaces a Lean Supply Chain has to build metrics systems that encompass the whole network of value to improve the experience of the customer and increase benefits for the collaborating companies.
6. CONCLUSIONS
Lean Manufacturing implementations require the establishment of an environment that makes the rest of the elements of the process possible. This environment (set up by management) will ensure that employees feel empowered and have the necessary tools to gain product and process ownership, focused teams work and autonomy in the development of solutions and process improvements.
Five main dimensions can be measured to assess the degree of evolution in a Lean transformation. These are Elimination of Waste, Continuous Improvement, Continuous Flow and Pull Driven Systems, Multifunctional Teams and Information Systems. Four or five metrics were defined for each of the dimensions.
What is the relationship between the activities and features of a Lean environment (which are commonly mentioned in practice and in the literature) and the Lean performance metrics presented? This question was addressed in a speculative fashion, leaving open the door for more research to establish these relationships with actual data.
Lean Manufacturing is much more than a manufacturing technique. It is a different way of viewing the labor relationships, the way operations are done, the way value is added and therefore the way used to measure it should be different. This paper presented some of the commonly used performance metrics in the research literature.
7. REFERENCES
Emiliani, M.L. (1998). Lean Behaviors. Management Decision, 36 (9), 615-631. [ Links ]
Forza, C. (1996). Work Organization in Lean Production and Traditional Plants: What are the differences?. International Journal of Operations & Production Management, 16(2), 42-62. [ Links ]
Grutter, A., Field, J. & Faull, N. (2002). Work team performance over time: Three case studies of South African Manufacturers. Journal of Operations Management, 20, 641-657. [ Links ]
Hyer, N.L, Brown, K. A. & Zimmerman, S. (1999). A socio-technical systems approach to cell design: case study and analysis. Journal or Operations Management, 17, 179-203. [ Links ]
Karlsson, C. & Ahlstrom, P. (1996). Assessing changes towards Lean Production. International Journal of Operations & Production Management, 16(2), 24-41. [ Links ]
Katayama, H. & Bennett, D. (1996). Lean Production in a changing competitive world: A Japanese perspective. International Journal of Operations & Production Management, 16(2), 8-23. [ Links ]
Liker, J. (1998). Becoming Lean: Inside Stories of U.S. Manufacturers. Portland: Productivity Press. [ Links ]
Martinez, A. & Perez, M. (2001). Lean Indicators and Manufacturing Strategies. International Journal of Operations & Production Management, 21(11), 1433-1451. [ Links ]
Murman, E., et. al. (2002). Lean Enterprise Value: Insights from MIT´s Lean Aerospace Initiative. New York: Palgrave. [ Links ]
Niepce, W., Molleman, E. (1996). A Case Study: Characteristics of work organization in Lean Production and Socio-Technical Systems. International Journal of Operations & Production Management, 16(2), 77-90. [ Links ]
Rivera, L. & Chen, F., (2006 a). Costtime profiling: putting monetary measures onto value stream maps", Paper presented at the Annual Industrial Engineering Research Conference, Orlando, FL. [ Links ]
Rivera, L. & Chen, F., (2006 b). Cost- Time Profiling: Impact of Lean Tools on the Cost-Time Investment of a Product. Paper presented the 16th FAIM (Flexible Automation and Intelligent Manufacturing Conference) 2006. Limerick, Ireland. [ Links ]
Sohal, A. (1996). Developing a Lean Production Organization: An Australian case study. International Journal or Operations & Production Management, 16(2), 91-102. [ Links ]
Thompson, P. & Wallace, T. (1996). Redesigning production through teamworking: Case studies from the Volvo Truck Corporation. International Journal of Operations & Production Management, 16(2), 103-118. [ Links ]
Womack, J.P. & Jones, D. (1996). Lean thinking: banish waste and create wealth in your corporation. New York: Simon & Schuster. [ Links ]
Womack, J. (2002). Lean Thinking: Where Have We Been and Where Are We Going?. Forming & Fabricating, September 2002, Lean Manufacturing Special Insert, p. L2. [ Links ]

